


By Stephanie Rowton
The S&P 500® ESG Index seeks to provide a measurement of U.S. equities while incorporating ESG factors.1 The index maintains similar industry weights to the S&P 500 while enhancing the index’s sustainability characteristics.
The Importance of Sector Neutrality within the S&P 500 ESG Index
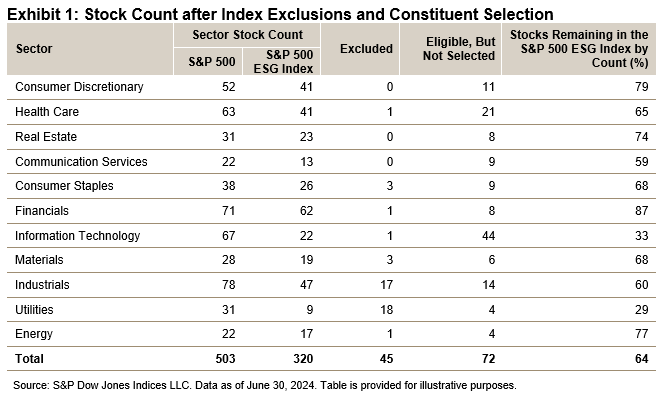
A common misconception is that ESG indices remove or underweight sectors deemed environmentally unfriendly such as Energy or Utilities. Rather than excluding sectors, the S&P 500 ESG Index selects companies that perform highest when considering environmental, social and governance metrics, while historically reflecting many of the attributes of the S&P 500. Removing entire sectors may result in a shift in weight toward other sectors – potentially creating sector bias and concentration risk.
Using Information Technology as an example, one constituent was excluded as per the S&P ESG Indices methodology. It then selected constituents from each industry group within Information Technology, starting from constituents with the highest ESG scores, to reach 75% of the underlying index’s market cap. From this, 22 constituents were selected, meaning the index included only 33% of the initial stock count from the S&P 500’s Information Technology sector. Were the methodology to reallocate additional weight to Information Technology, it could have created concentration risk in the few selected constituents.
Achieving Sector Neutrality
The S&P 500 ESG Indices aim to achieve a broadly sector-neutral outcome by making ESG score exclusions on a relative basis within each GICS® industry group, rather than removing entire industry groups.2 Consequently, the success of the index is not solely measured through its performance, but rather by whether industry group weights (and, by extension, sector weights) remain similar to the S&P 500.
However, excluding companies based on ESG metrics will result in deviation from the underlying index. Some active share is therefore inevitable; while the sector active share is only 6.27%, illustrating broad sector neutrality, the index itself has an active share of 27.54%,3 driven by a disparity in holdings and weights with the S&P 500. The deviation between the S&P 500 ESG Index and the S&P 500 is particularly evident when a sector has several constituents removed or a company with a high float market cap (FMC) is excluded.
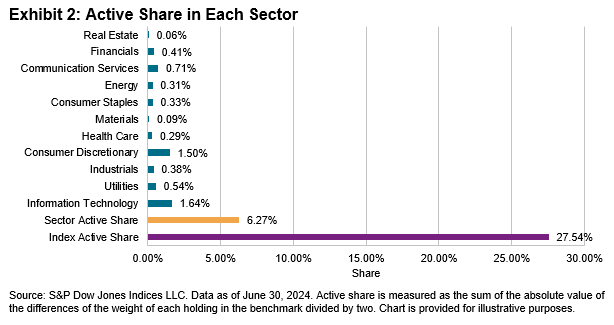
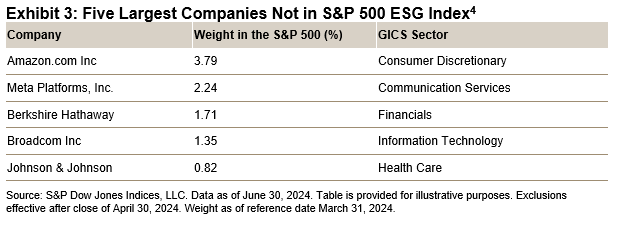
When considering Information Technology (see Exhibit 2), it is possible to conclude that active share was likely driven from a few constituents that were included in the S&P 500 ESG Index. Furthermore, Broadcom (AVGO), with an FMC of 1.35%, was not selected for inclusion (see Exhibit 3). Whereas the removal of Amazon, with an FMC of 3.79%, is a likely driver for the deviation in the Consumer Discretionary sector.
Performance Attribution
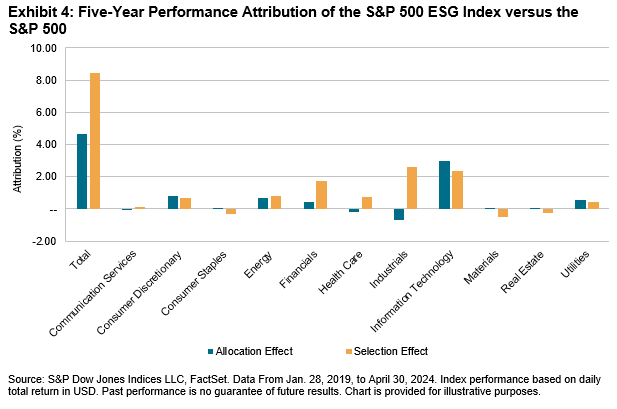
Perhaps unsurprisingly, performance attribution primarily reveals the history of constituent selection rather than sector weighting (see Exhibit 4).5 This is partly because the index has historically been successful in maintaining similar sector weights to the S&P 500. An additional outcome of maintaining similar sector weights is the index achieving relatively low tracking error4 at 1.39%.6 Interestingly, the S&P 500 ESG Index’s performance has consistently benefited from selecting the second-best scoring constituents7 and avoiding the worst ESG-scoring constituents.8
Conclusion
The S&P 500 ESG Index has successfully provided a measurement of U.S. equities with an ESG lens and has maintained similar industry group weights as the S&P 500. By utilizing index construction to maintain broad sector neutrality, the index has historically reduced the impact of sector-driven performance, increased the impact of stock selection and consequently produced low tracking error versus the S&P 500.
1 See Rowton, Stephanie, Sanchez, Maria, “The S&P 500 ESG Index: 5 Years of Defining Core Through an ESG Lens”
2 See Rowton, Stephanie and Sanchez, Maria, “The S&P 500 ESG Index: 5 Years of Defining Core Through an ESG Lens”
3 Source: Arrow, S&P Global as of June 30, 2024.
4 Please refer to the Exclusions file.
5 See Rowton, Stephanie, Sanchez Maria “The S&P 500 ESG Index: 5 Years of Defining Core Through an ESG Lens”
6 Data as of April 30, 2024, 36-month annualized tracking error.
7 New Frontiers: The S&P 500 ESG Index’s Performance Beyond the S&P 500
8 See Beyhan, Maya, “The Key to the S&P 500 ESG Index’s Outperformance: Avoiding the “Worst”
Disclosure: Copyright © 2024 S&P Dow Jones Indices LLC, a division of S&P Global. All rights reserved. This material is reproduced with the prior written consent of S&P DJI. For more information on S&P DJI, please visit S&P Dow Jones Indices. For full terms of use and disclosures, please visit www.spdji.com/terms-of-use.
Original Post
Editor’s Note: The summary bullets for this article were chosen by Seeking Alpha editors.
Read the full article here