


Investment Thesis
The Invesco S&P SmallCap 600 Revenue ETF (NYSEARCA:RWJ) is as straightforward as it sounds. RWJ weights small-cap stocks by revenue rather than market capitalization and has delivered category-leading returns over the last five and ten years. However, after comparing RWJ against 84 other small-cap ETFs, I discovered RWJ typically ranks in the top or bottom quartile. Based on substantial outperformance from 2020-2022 and historical trends, today isn’t the best time to buy RWJ. This article also compares RWJ’s fundamentals against three other small-cap ETFs and reveals a surprising weakness for a revenue-focused fund: poor profitability. For these reasons, I don’t recommend readers buy RWJ, and I look forward to explaining why in more detail below.
RWJ Overview
Strategy Discussion and Key Exposures
RWJ tracks the S&P SmallCap 600 Revenue-Weighted Index and rebalances quarterly. The Index re-weights S&P SmallCap 600 stocks, which pass a profitability screen based on trailing four-quarter revenue. S&P Dow Jones Indices defines a small-cap stock as one with a market capitalization between $850 million and $3.6 billion. It’s a higher threshold than other Indexes like the Russell 2000, and I favor this approach, explained in detail in this article on the Schwab U.S. Small-Cap ETF (SCHA).
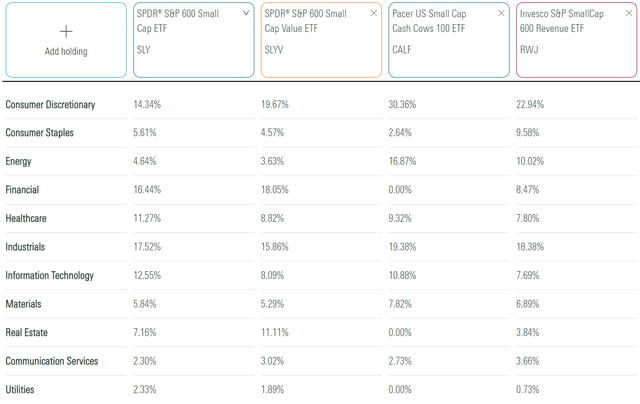
RWJ’s sector exposures are listed below. For the fundamental analysis later, I’ve decided to compare RWJ against three ETFs:
- SPDR S&P 600 Small Cap ETF (SLY)
- SPDR S&P 600 Small Cap Value ETF (SLYV)
- Pacer US Small Cap Cash Cows 100 ETF (CALF)
SLY and SLYV are easy comparators. SLY is the market-cap-weighted version of RWJ, while SLYV is the value version and aligns with how Morningstar categorizes RWJ (small value). CALF is different because it uses free cash flow yield to select a concentrated group of 100 small-cap stocks. Some readers mentioned it in other RWJ articles, and I think it’s a higher-quality option.
Morningstar
RWJ has more exposure to Consumer Discretionary, Consumer Staples, and Energy stocks than SLY and SLYV, with offsets in Financials and Real Estate. Less Financials sector exposure was beneficial YTD. RWJ has 2.65% exposure to the Regional Banking industry compared to 8.97% and 8.05% for SLYV. CALF avoids these sectors altogether, as free cash flow metrics are generally not applicable.
RWJ’s top ten holdings are listed below, totaling 17.65%. You might assume weighting by revenue results in a less concentrated fund, but that’s not the case here. SLY’s top ten totals 6.10%. RWJ overweights World Fuel Services (INT), United Natural Foods (UNFI), and The Andersons (ANDE) by a combined 8.61%. As a result of RWJ’s revenue weighting scheme, its weighted average price-sales ratio declined to 0.90 from 2.54 for SLY and 2.09 for SLYV.
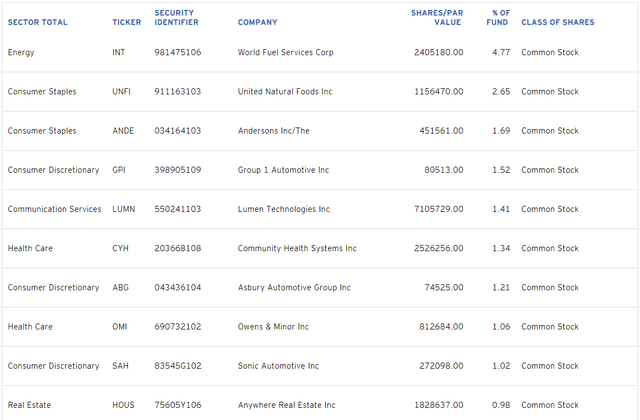
Invesco
Performance Analysis
Since March 2009, RWJ delivered an annualized 11.20% return compared to 9.49% and 8.96% for SLY and SLYV. RWJ’s standard deviation was higher, but the risk was worth it. Its 0.52 Sharpe Ratio was the best.
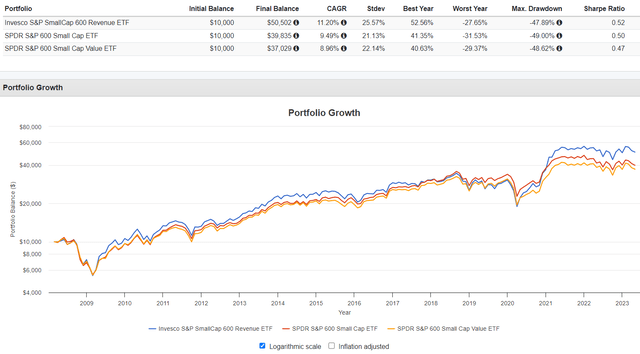
Portfolio Visualizer
However, this graph is difficult to interpret because we can’t tell how much excess return is attributable to just a few years, which looks isolated to 2020-2022 and sometime around 2013-2015. Recognizing that readers categorize funds differently than Morningstar and analysts like myself, I’ve benchmarked RWJ’s annual returns against up to 85 small-cap peers. This peer group includes small-cap value, blend, and growth ETFs, and I plan to do this more because it provides crucial context. Some ETFs are consistently average, which is fine for some. Others have fantastic five- and ten-year lookbacks but are skewed. If you purchase them at the wrong time, you might have to wait several years for returns to normalize, so it’s good to plan ahead.
Here are the rankings I calculated for RWJ. For 2008, returns are for March to December only, and for 2023, returns are through April. My data source is Portfolio Visualizer, and I’ve included percentile rankings in parentheses to normalize the results (lower is better).
- 2008: #11/23 (48%)
- 2009: #4/24 (17%)
- 2010: #18/30 (60%)
- 2011: #9/32 (28%)
- 2012: #4/33 (12%)
- 2013: #2/38 (5%)
- 2014: #13/39 (33%)
- 2015: #38/44 (86%)
- 2016: #12/48 (25%)
- 2017: #52/61 (85%)
- 2018: #61/64 (95%)
- 2019: #51/67 (76%)
- 2020: #17/75 (23%)
- 2021: #2/81 (2%)
- 2022: #14/85 (16%)
- 2023: #29/85 (34%)
To summarize, RWJ ranked above average 11/16 times, demonstrating that you’ll likely do better than average if you have a somewhat long time horizon (3-5 years). However, there were pockets of underperformance. From 2017-2019, RWJ ranked in the bottom quartile, delivering a 1.63% annualized return compared to 8.21% and 6.57% for SLY and SLYV. Over three years, the total return impact was as much as 22%.
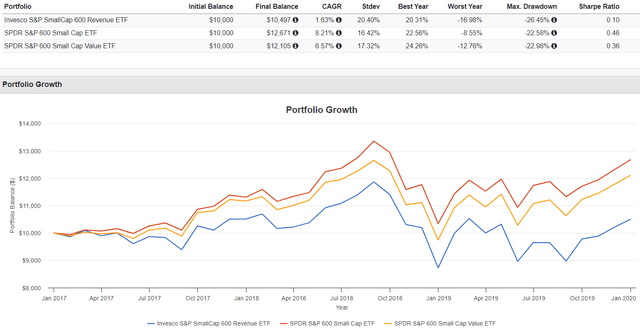
Portfolio Visualizer
Also, this underperformance followed relatively strong returns from 2011-2016 (except for 2015). Therefore, you should consider mean reversion. From 2020-2022, RWJ was a top-quartile performer, but given the historical patterns, you should be careful about adding to RWJ now. It’s prudent to protect gains.
I won’t list the annual returns for all 85 ETFs, but here are the 30 largest by AUM, with FactSet style classifications in the second column. Please let me know in the comments section if you would like the same percentile rankings for any ETF in the list.
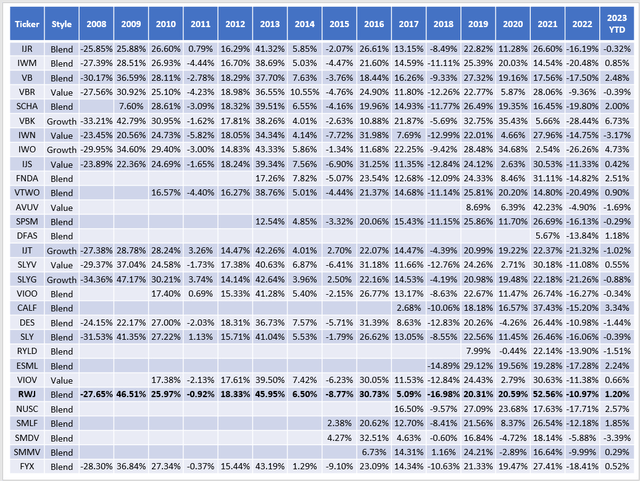
The Sunday Investor
In the last ten years, RWJ’s returns were closer to the average value ETF return in 9/10 years, so Morningstar’s categorization seems appropriate. The exception was in 2020 when RWJ followed the pattern of funds like the Vanguard Small Cap Growth ETF (VBK).
RWJ Fundamentals
The following table highlights selected fundamental metrics for RWJ’s top 25 industries, totaling 60% of the portfolio. Summary metrics for RWJ, SLY, SLYV, and CALF are in the final rows.
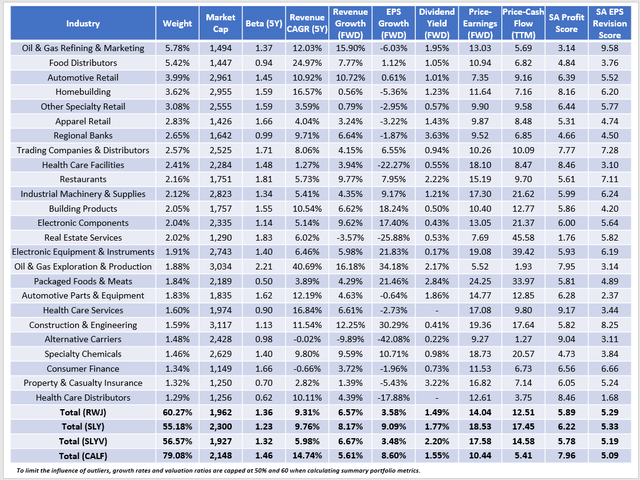
The Sunday Investor
A few observations:
1. As discussed earlier, weighting small-cap stocks by revenue instead of market capitalization results in a more concentrated fund. SLY and SLYV have 55% and 56% of assets in their top 25 industries, while CALF is more focused at 79%. World Fuel Service makes up the bulk of RWJ’s Oil & Gas Refining & Marketing exposure, and the same is true for United Natural Foods and the Food Distributors industry. Once you account for these two stocks, the concentration is roughly the same.
2. RWJ has a 1.36 five-year beta, higher than SLYV but lower than SLY. In the small-cap segment, value stocks are typically more volatile than growth stocks, while the opposite is true with large-cap stocks. It’s an essential takeaway because value investors sometimes seek to reduce risk and unknowingly assume small-cap value stocks provide added protection. They might, but it’s far from guaranteed. It’s more of a question of a fund’s sector exposures because every recession differs and affects specific industries more than others.
3. RWJ’s estimated sales and earnings growth rates are low at 3.58% and 1.49%. It’s a red flag, and I think RWJ’s top quartile ranking from the last four years won’t repeat. There is a substantial discount on forward earnings. RWJ trades at 14.04x on a weighted average basis compared to 17.45x and 14.58x for SLY and SLYV. However, that factor is out of favor. Plain vanilla growth funds like VBK and IWO are outperforming YTD.
4. I’m disappointed RWJ’s revenue weighting scheme didn’t boost the Index’s profitability score, derived using individual Seeking Alpha Factor Grades. Intuitively, sales growth leads to higher earnings, but that’s not the case here. RWJ’s weighted average net income margin is just 5.60% compared to 13.82%, 10.15%, and 7.05% for CALF, SLY, and SLYV. These poor profitability metrics indicate RWJ is too speculative, which may explain the less consistent performance results described earlier.
Conclusion
RWJ has led the small-cap ETF market over the last decade. However, owning RWJ is like being on a rollercoaster. It delivered top-quartile performance from 2020-2022 but ranked near the bottom the three years prior. I’m concerned investors may be buying at the top today, so I’m hesitant to recommend RWJ. Furthermore, low earnings growth and profitability offset its valuation benefits, so I don’t see any significant short-term opportunities. To be sure, RWJ will likely outperform if you plan to hold for 3-5 years, and it’s a good ETF. I just don’t think the timing is right today. Thank you for reading, and I look forward to the discussion in the comments section below.
Read the full article here