


Looking for a dividend stock with a wide moat? Take a look at Iron Mountain Incorporated (NYSE:IRM), the world’s largest records storage company. For years, bears have tried to make the case that paper storage would go the way of the buggy whip, due to the global digitization of records.
However, IRM’s earnings tell the opposite story. Storage revenue continues to grow, as do other earnings metrics. IRM had “organic storage rental revenue growth of 11% in Q1 ’23, reflecting continued benefit of pricing combined with positive volume trends and data center growth.” (IRM site.)
Company Profile:
IRM is the global leader for storage and information management services. It is a real estate investment trust (“REIT”) serving over 225,000 organizations around the world, with a real estate network of over 90 million square feet across ~1,450 facilities in approximately 50 countries. It services more than 225,000 organizations around the world, including 95% of the Fortune 1000. It was founded in 1951.
IRM’s Global Data Center Business operates in 21 data centers across 19 global markets, either directly or through unconsolidated joint ventures. its ALM business provides hyperscale and corporate IT infrastructure managers with services and solutions that enable the decommissioning, data erasure, processing and disposition or sale of IT hardware and component assets. (IRM site.)
Earnings:
IRM had an all-time record total quarterly Q1 revenue of $1.31B in Q1 ’23.
Storage revenue continued to grow in Q1 ’23, rising ~8%, after climbing 5.7% in full year 2022. Service revenue was up 1.4%, after rising nearly 28% in 2022.
Adjusted EBITDA, NFFO (normalized funds from operations), NFFO/share, and AFFO (adjusted funds from operations) all rose ~7% – 7.6% in Q1 ’23, while Interest expense jumped 20%. The share count was roughly flat, as it was in full year 2022.
Net Income surged 57% in Q1 ’23, after growing ~28% in 2022.
Management signed 52 megawatts of new leases in Q1 2023, with a single hyperscale customer in 2 deals for a total of 44 megawatts. This is over 50% of its guidance for 2023 of 80-plus megawatts.
Adjusted EBITDA was up 11.8% in 2022, with NFFO rising ~7%, NFFO/share up ~6%, and AFFO up 9.7%. Like most other companies, IRM had a significant rise in Interest expense in 2022 – it was up 16.8%:
Hidden Dividend Stocks Plus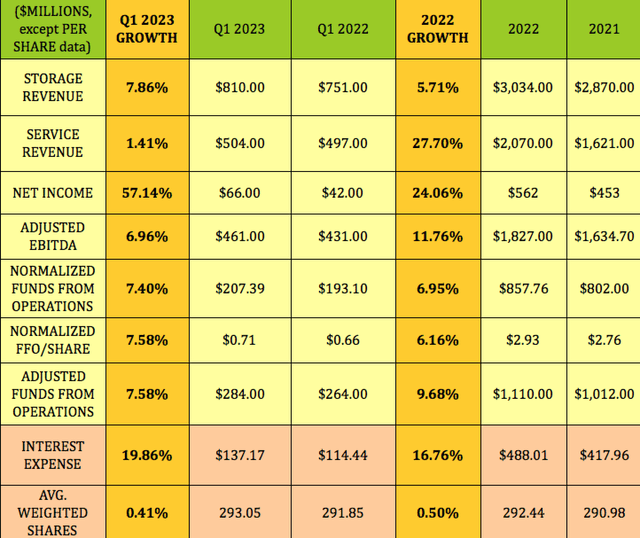
Segments:
Management has invested in the Data Center business in recent years. This segment has continued to grow – revenue was up 15.5% in Q1 ’23. The Records Management segment’s revenue grew ~8%, while Data Management declined 3%; and Information Destruction segment revenue declined 7%.
IRM site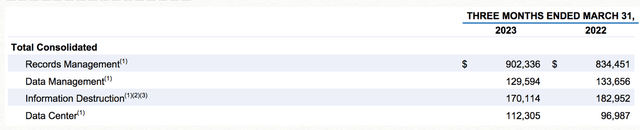
Guidance:
Management reiterated its 2023 guidance, which calls for midpoint growth of ~9% in Revenue, ~7% in Adjusted EBITDA, ~5% in AFFO, and ~4% in AFFO/Share. Management expects a ~1% headwind for currency in revenue, EBITDA, and AFFO, with ~2% in AFFO/share in 2023:
IRM site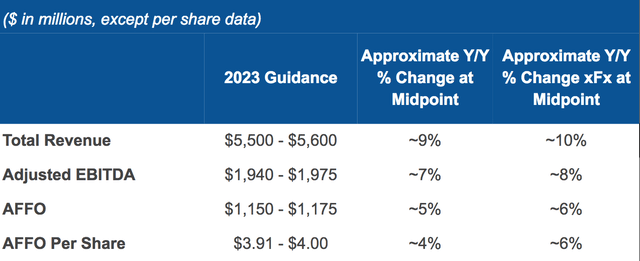
Dividends:
At its 6/8/23 price of $55.67, IRM yields 4.44%. It’s not a dividend growth stock, with a low 2% average 5-year growth figure. Management has maintained the quarterly dividend at $0.6185 since Q4 2019.
IRM goes ex-dividend next on 6/14/23, with a 7/6/23 pay date.
Hidden Dividend Stocks Plus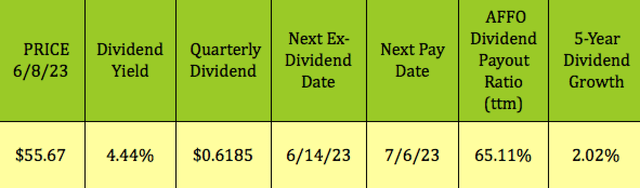
The 6.6% rise in AFFO/share improved IRM’s dividend payout ratio by ~6%, dropping it 63.76% in Q1 ’23, vs. ~68% in Q1 ’22. Full year 2022 had an even larger improvement of 11.8%, to a 65.11% payout ratio:
Hidden Dividend Stocks Plus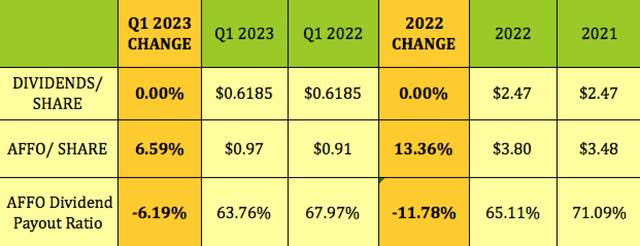
Taxes:
“At December 31, 2022, we have federal net operating loss carry forwards of $63.5 million, which can be carried forward indefinitely, of which $57.1 million is expected to be realized to reduce future federal taxable income. We have assets for foreign net operating losses of $81.9 million, with various expiration dates (and in some cases no expiration date), subject to a valuation allowance of approximately 56.0%.” (IRM 2022 10-K.)
Profitability & Leverage:
ROA improved a bit in Q1 ’23, while ROE soared, due to 57% growth in Net Income, vs. a lower Equity base.
Management increased debt in 2022, from $11.7B to $13.3B. Management invested $302M in Q1 ’23: $274M in growth capex, and $28M in maintenance capex.
Net Debt/EBITDA improved in Q1 ’23, to 5.77X, vs. 5.96 in Q1 ’22, while Debt/Equity jumped from 13.49X to 19.91X, due to the lower equity base. Management has a target leverage range, of 4.5 to 5.5X.
Keep in mind that the Specialty REIT sub-industry is a mix of many different types of businesses. One of the traditional problems with analyzing IRM is that it has a unique business – it’s not quite a Tech company, nor is it a typical REIT.
Hidden Dividend Stocks Plus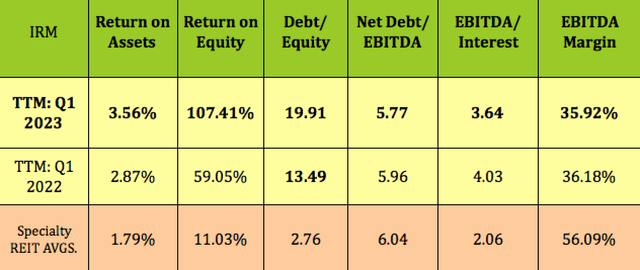
Debt & Liquidity:
IRM had ~$1B in liquidity, as of 3/31/23, with Net Lease adjusted leverage of 5.1X, its lowest level since 2017. 75% of its debt is fixed rate, at a weighted average interest rate of 5.3%, and a 5.7 year average maturity.
In March ’22, management extended the maturity date of IRM’s Revolving Credit Facility and the Term Loan A from June 3, 2023 to March 18, 2027. They also refinanced and increased the borrowing capacity under the Revolving Credit Facility from $1,750M to $2,250M. They increased the net total lease adjusted leverage ratio maximum allowable under Term Loan A from 6.5x to 7.0x, and removed the net secured lease adjusted leverage ratio requirement.
In early May, management completed a private placement of $1B in aggregate principal amount of its 7.000% Senior Notes due 2029.
Performance:
IRM has outperformed the specialty REIT industry, the broad Real Estate sector (XLRE), and the S&P 500 (SPY) so far in 2023. It has also had a much better total return than all of them over the past year:
Hidden Dividend Stocks Plus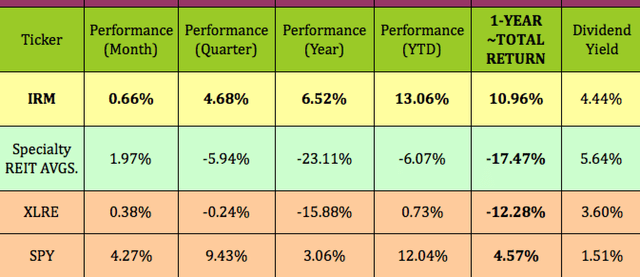
This past year wasn’t a fluke. Looking back 10 years, IRM’s total return was over 5X that of the S&P 500’s:
Ycharts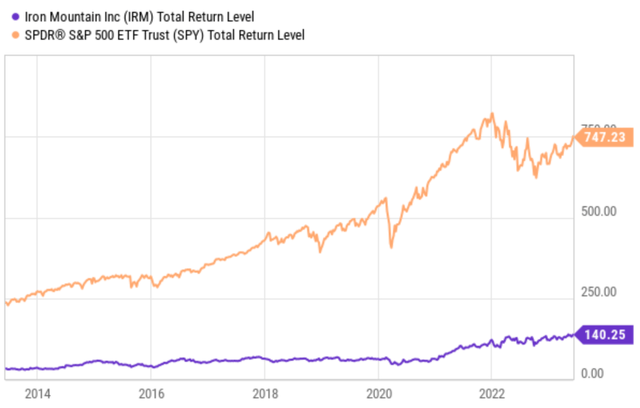
Analysts’ Targets:
IRM received 2 new ratings from street analysts in December ’22: A sector perform rating with a $58.00 price target from RBS Capital Markets; and an outperform rating with a $66.00 price target from BNP Paribas.
At $55.67, IRM is 4% below the $58.00 average price target, and 19% below the $69.00 highest price target. That low $20.00 target is very dated, maybe back to the March 2020 COVID pullback.
Hidden Dividend Stocks Plus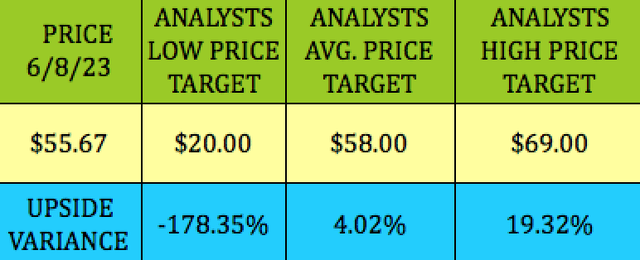
Valuations:
At its 6/8/23 intraday price of $55.67, IRM is in line with the Specialty REIT industry average trailing P/AFFO, while being a bit cheaper on a forward P/AFFO basis. It has much lower P/Sales and EV/EBITDA valuations, whereas its P/Book is much higher, due to its lower equity base.
Hidden Dividend Stocks Plus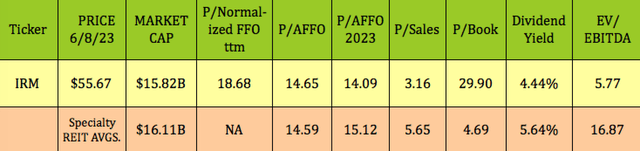
Parting Thoughts:
Put Iron Mountain Incorporated on your watchlist and wait for a market pullback, or try selling out of the money puts below IRM’s price/share, to get a lower entry point. This is a long-term holding candidate with a wide moat, so it’s not surprising that Warren Buffett’s Berkshire Hathaway (BRK.A) has owned IRM in the past.
All tables furnished by Hidden Dividend Stocks Plus, unless otherwise noted.
Read the full article here