


Our objective is to enhance the worth of our portfolio. Our financial resources are finite, as our portfolio must operate within real-world constraints. Consequently, this necessitates difficult decisions, occasionally requiring us to part with shares we’d prefer to retain. In instances like this, we relinquish a favorable opportunity to seize an even more advantageous one. This is a continuous endeavor. Should a more promising prospect arise, we are open to adapting once more.
So which shares have I been buying lately?
From September through November, I’ve purchased preferred shares quite a few times. On several of those days, I was buying shares of CIM-B (CIM.PR.B) or CIM-D (CIM.PR.D).
The image below shows my purchases of CIM-B and CIM-D:
The REIT Forum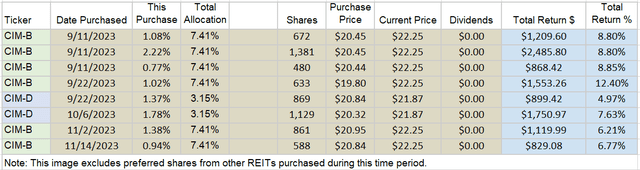
None of my open positions in the shares are older than that. Of course, these are real positions. Not monopoly money.
A total investment of about $135,671.56. That has purchases rounded to the nearest cent, but it’s pretty close.
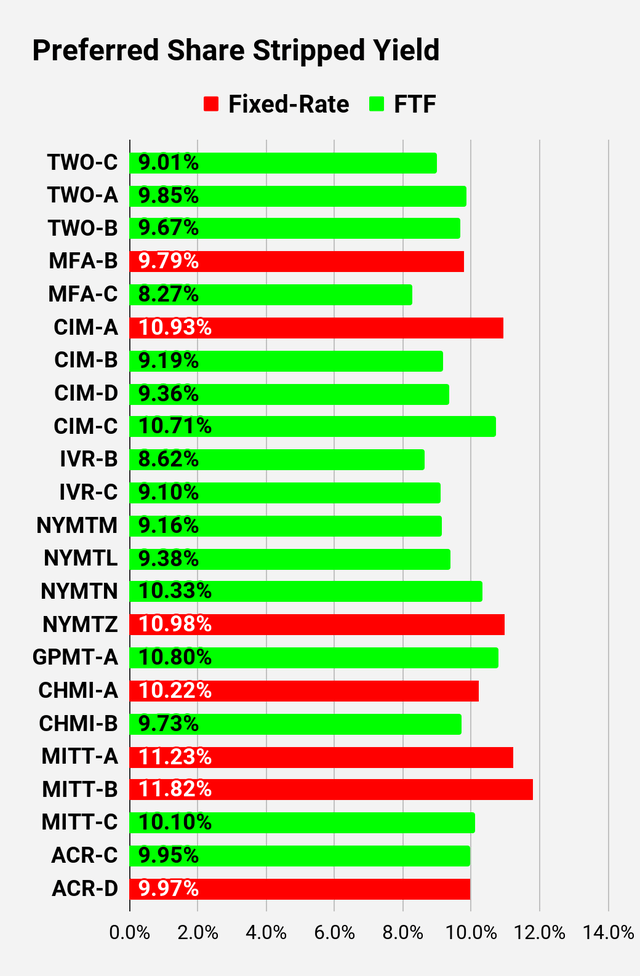
I think these shares will continue to climb because of the upcoming floating date. The floating rate kicks in on 3/30/2024. That’s when the yield should jump higher. If share prices and interest rates are unchanged (with current dividend accrual) the stripped yield would be 13.14% on CIM-B and 12.9% on CIM-D starting 3/30/2024. That’s quite a bit higher than the 9.19% on CIM-B and 9.36% on CIM-D today. That big dividend increase should make shares quite attractive.
I don’t expect to hold these shares forever. But I do want to capture the upside in the share price. If we assume that shares will trade at $25.00 when the floating rate hits, then an investor selling at $25.00 would have the same return as if shares were called. The annualized yield to call is about 60% for CIM-B and 68% for CIM-D. That’s from the combination of two fixed-rate dividends ($.50 per dividend) and the capital gain necessary for shares to reach $25.00.
Of course, even if shares trade in the mid $24.00 range or worse yet the $23.00 range, it would still represent a respectable capital gain along with two dividends.
What’s the risk? Well, the economy could plunge with home prices falling or the Federal Reserve could slash rates. Slashing rates would reduce the yield, but investors would also have fewer income alternatives. Still a negative factor, but I doubt we will see any big reduction in short-term rates over the next 4 to 5 months.
I think the risk/reward profile here is quite favorable.
Prior Trades
I’ve invested in CIM-B before, but I haven’t found other opportunities for CIM-D.
These were my prior trades:
The REIT Forum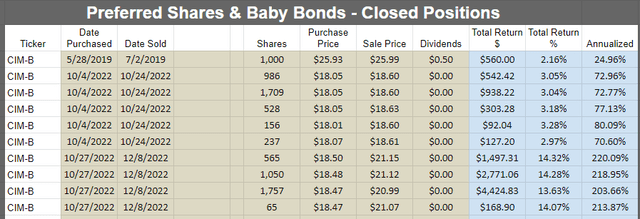
Most of the trades were pretty short and the annualized returns were quite strong.
You may notice that some of the sale prices are in the $18.60 range. That’s lower than any of my recent purchases. However, I still earned a respectable return on the position. Between those dates, I had other investments I wanted to be in. Those are sacrifices that we have to make sometimes. On the other hand, the sales around $21.00 look great. We got back in at a slightly lower price after having our capital available for other investments for 9 months.
Plan
I don’t expect to hold these shares forever. I’m invested in them now because they offer a solid yield and significant upside. If shares trade around $25.00, then I can probably find better opportunities at that point. As great as a 13% yield on cost sounds, I can always reallocate if we see more attractive uses for the capital.
Stock Table
We will close out the rest of the article with the tables and charts we provide for readers to help them track the sector for both common shares and preferred shares.
We’re including a quick table for the common shares that will be shown in our tables:
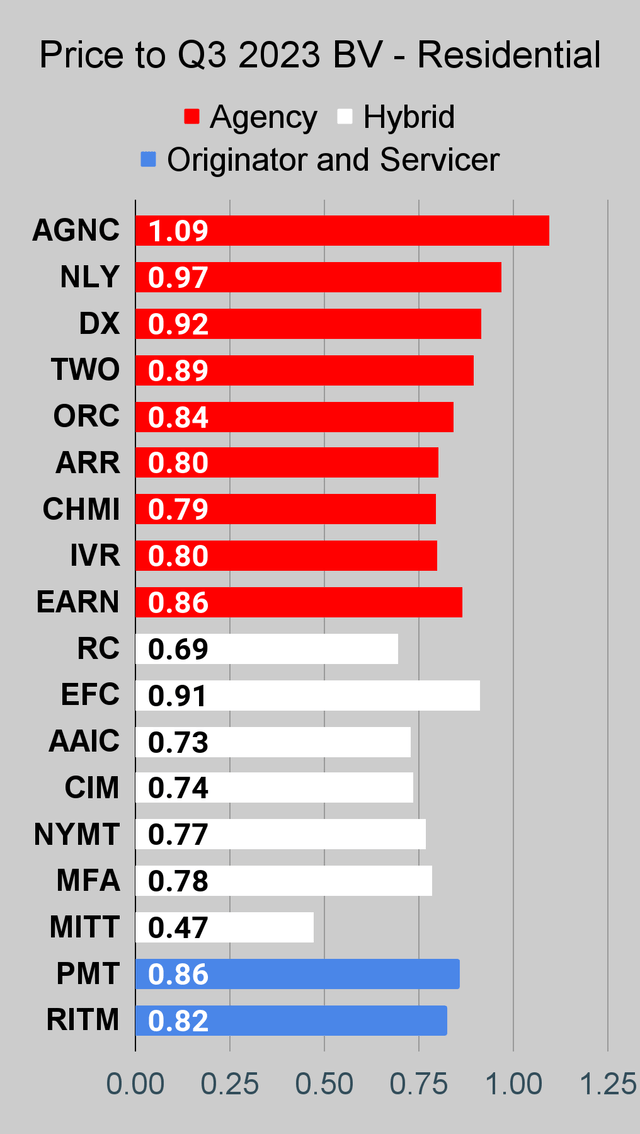
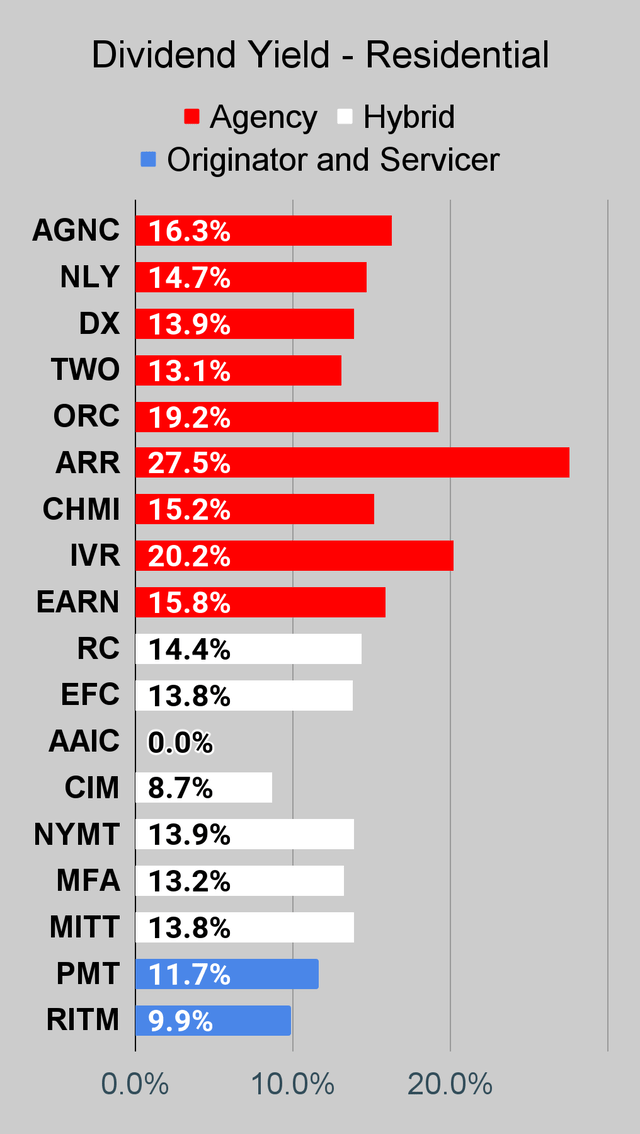
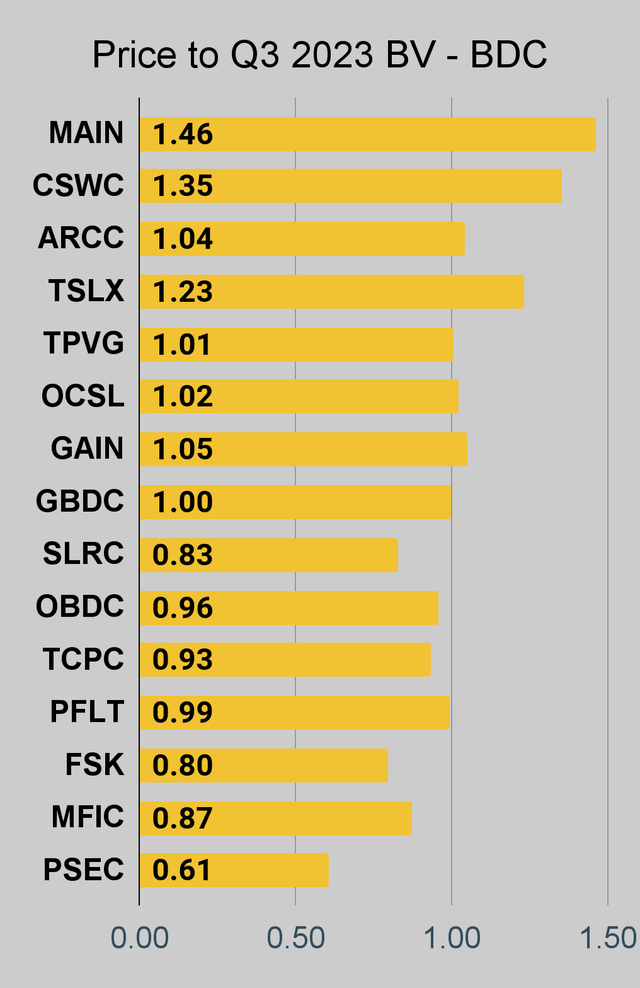
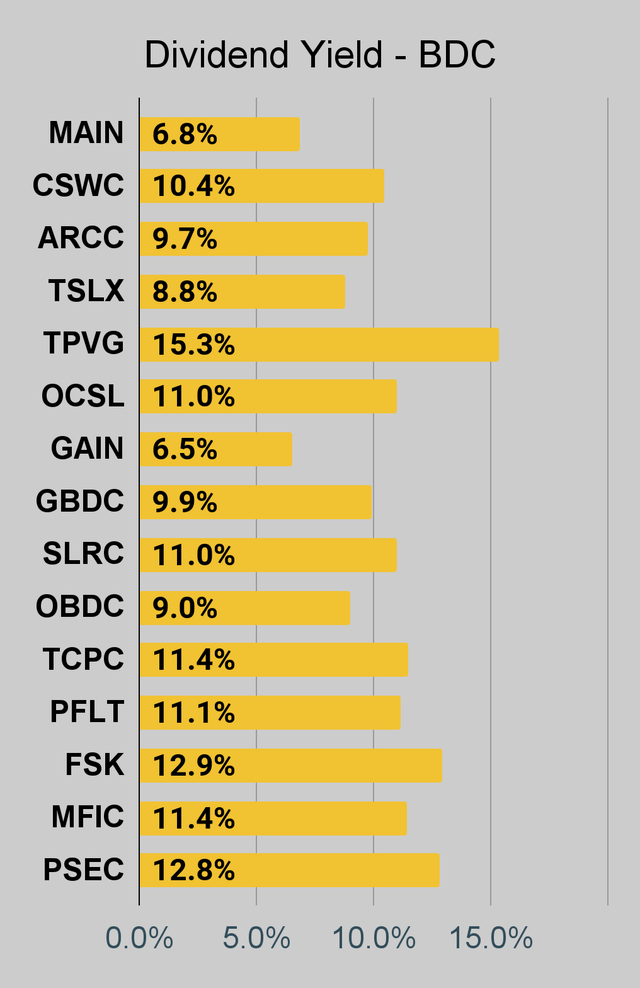
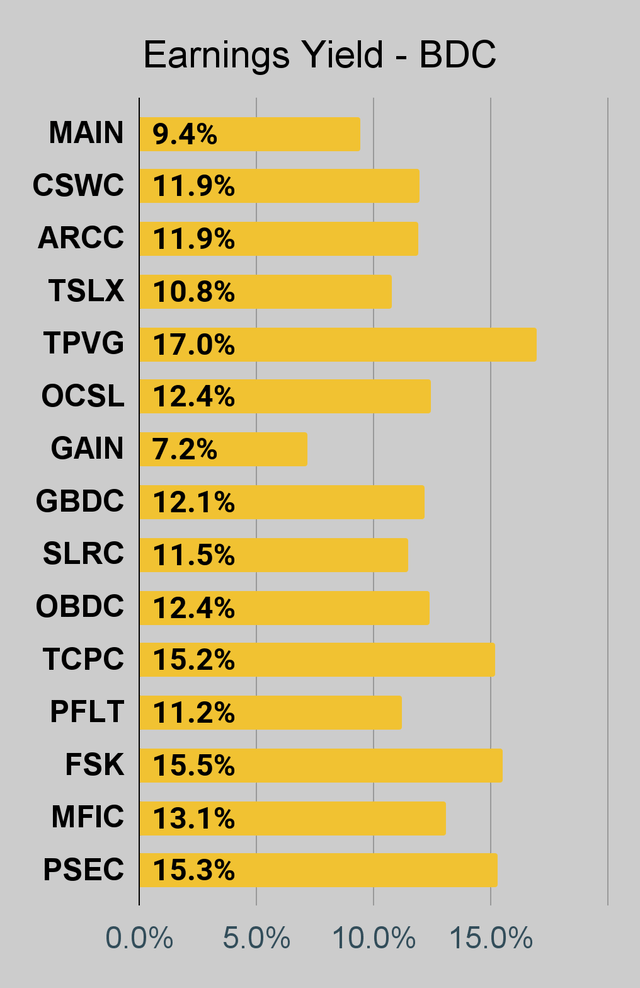
If you’re looking for a stock that I haven’t mentioned yet, you’ll still find it in the charts below. The charts contain comparisons based on price-to-book value, dividend yields, and earnings yield. You won’t find these tables anywhere else.
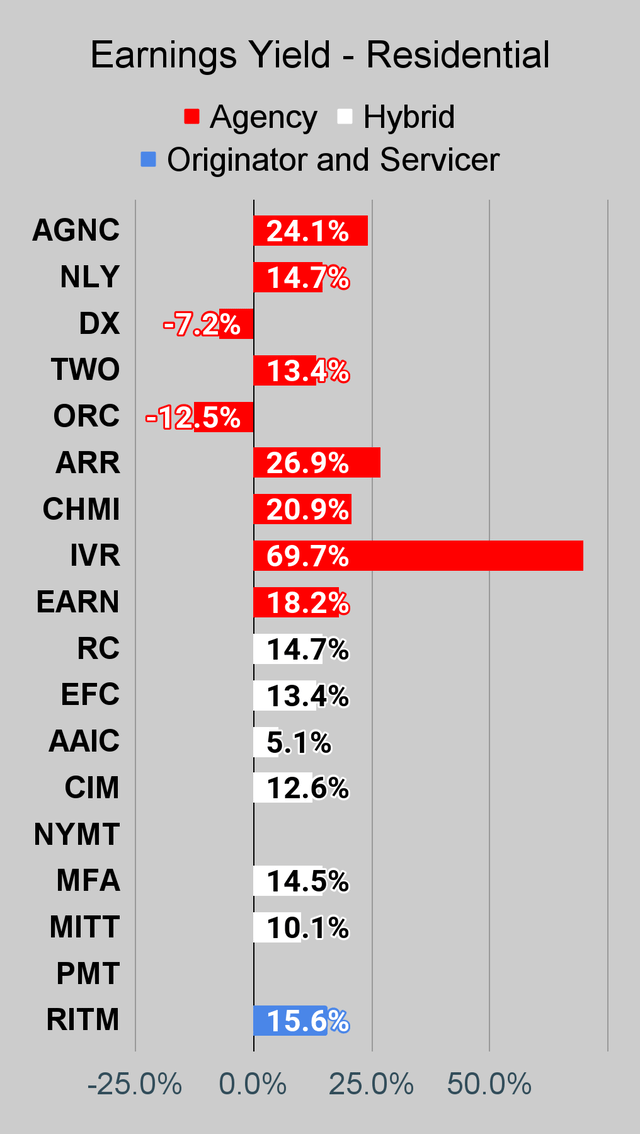
For mortgage REITs, please look at the charts for AGNC, NLY, DX, ORC, ARR, CHMI, TWO, IVR, EARN, CIM, EFC, NYMT, MFA, MITT, AAIC, PMT, RITM, BXMT, GPMT, WMC, and RC.
For BDCs, please look at the charts for MAIN, CSWC, ARCC, TSLX, TPVG, OCSL, GAIN, GBDC, SLRC, OBDC, PFLT, TCPC, FSK, PSEC, and MFIC.
This series is the easiest place to find charts providing up-to-date comparisons across the sector.
Note on Book Values
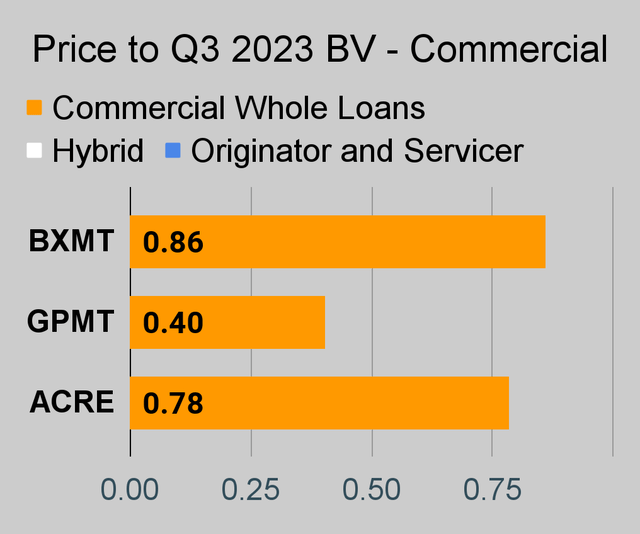
I’ve updated the charts to use Q3 2023 book values. These are much closer to current book values. Companies that have not reported values for Q3 2023 will be blank. We don’t want to put Q2 2023 and Q3 2023 BVs in the same charts due to the significant changes.
Residential Mortgage REIT Charts
Note: The chart for our public articles uses the book value per share from the quarter indicated in the chart. We use the current estimated (proprietary estimates) book value per share to determine our targets and trading decisions. It is available in our service, but those estimates are not included in the charts below. PMT and NYMT are not showing an earnings yield metric as neither REIT provides a quarterly “Core EPS” metric. Presently, a few other REITs also have no consensus estimate.
Second Note: Due to the way historical amortized cost and hedging are factored into the earnings metrics, it is possible for two mortgage REITs with similar portfolios to post materially different metrics for earnings. I would be very cautious about putting much emphasis on the consensus analyst estimate (which is used to determine the earnings yield). In particular, throughout late 2022 the earnings metric became less comparable for many REITs.
 The REIT Forum |
 The REIT Forum |
 The REIT Forum |
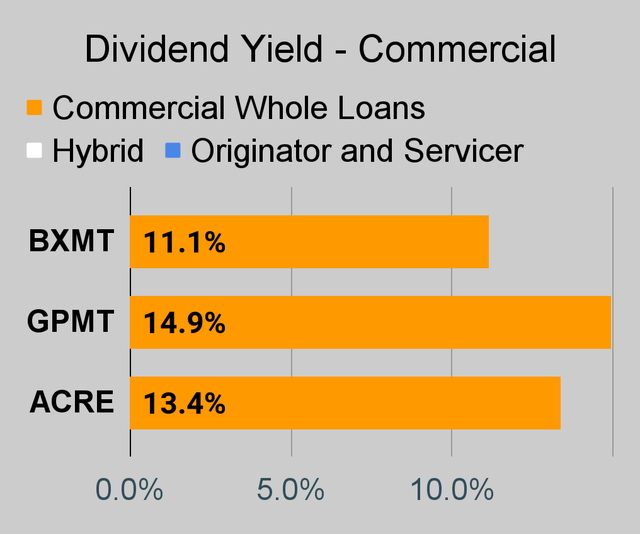
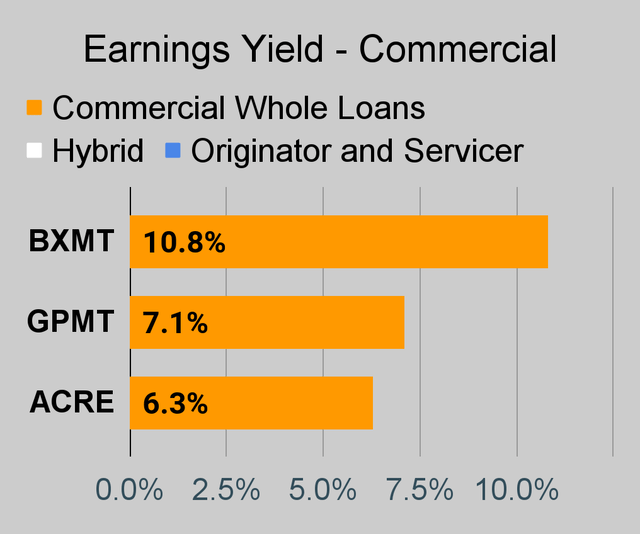
Commercial Mortgage REIT Charts
 The REIT Forum |
 The REIT Forum |
 The REIT Forum |
BDC Charts
 The REIT Forum |
 The REIT Forum |
 The REIT Forum |
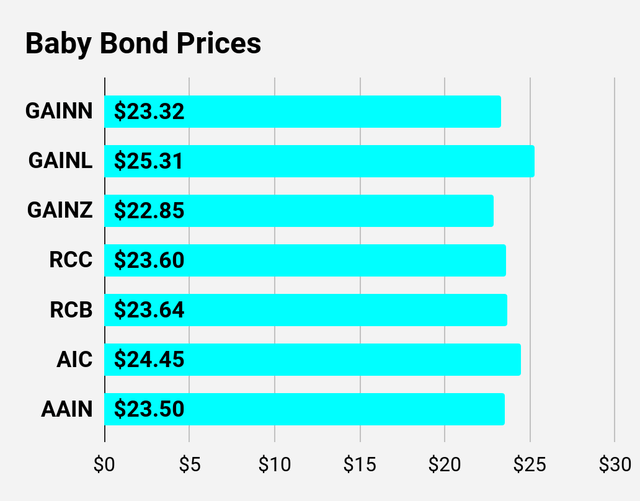
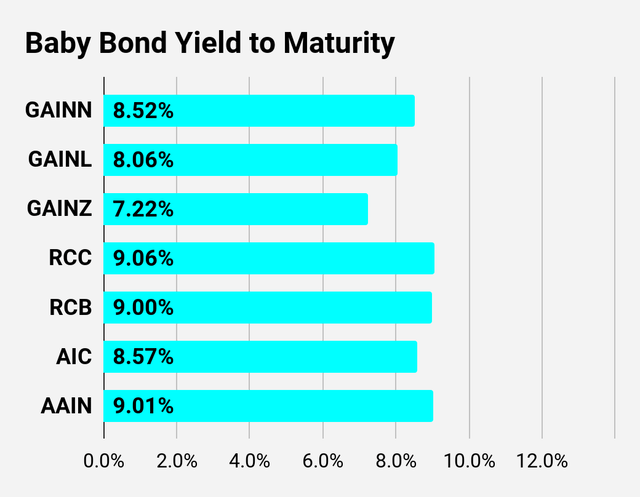
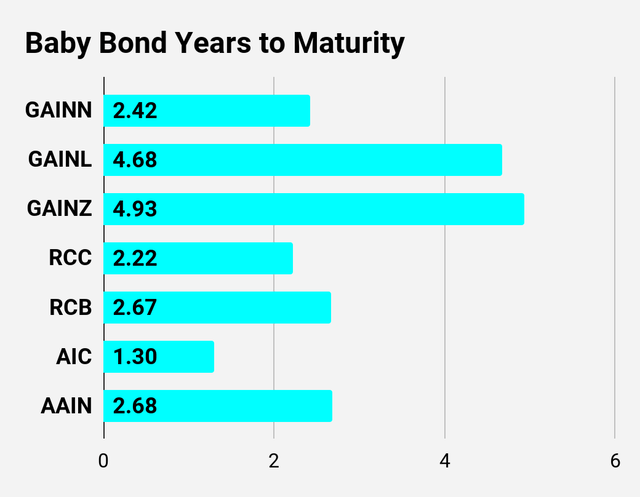
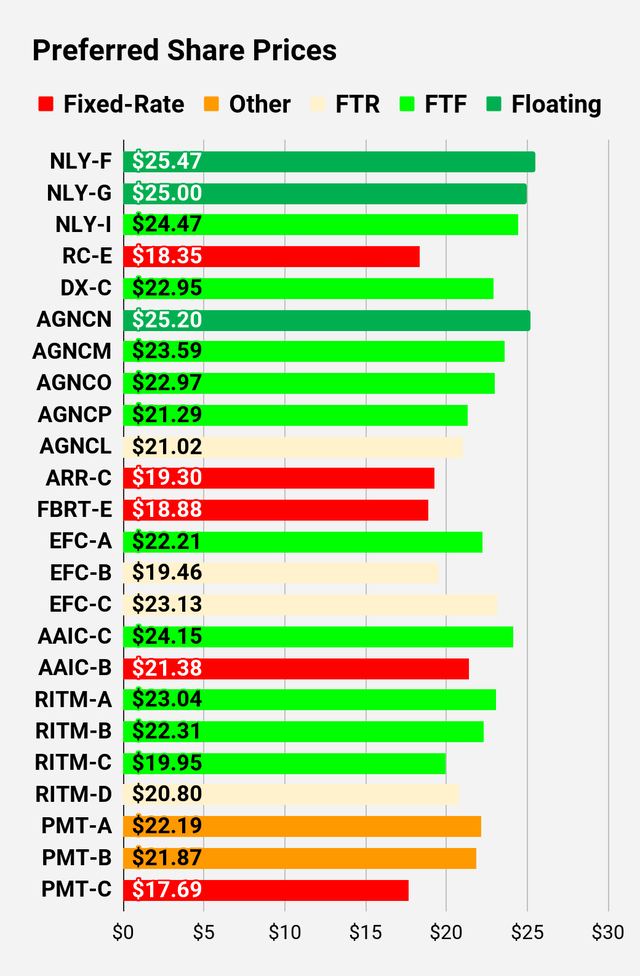
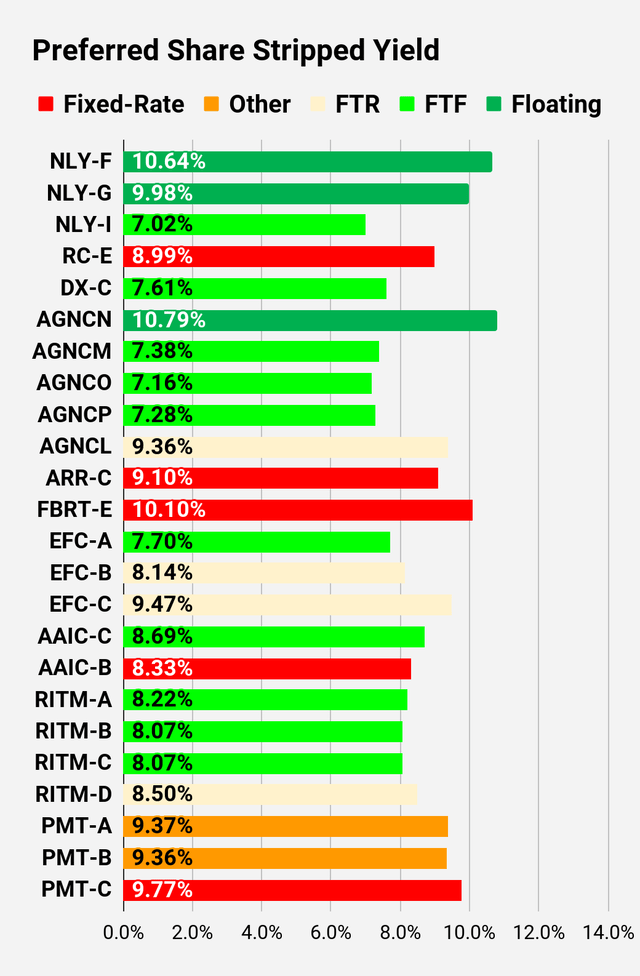
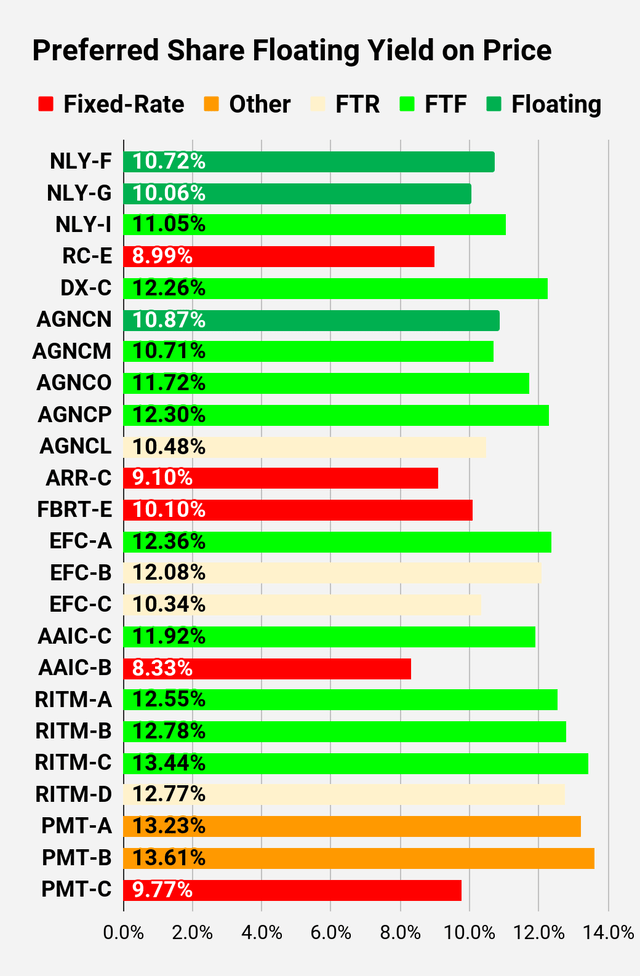
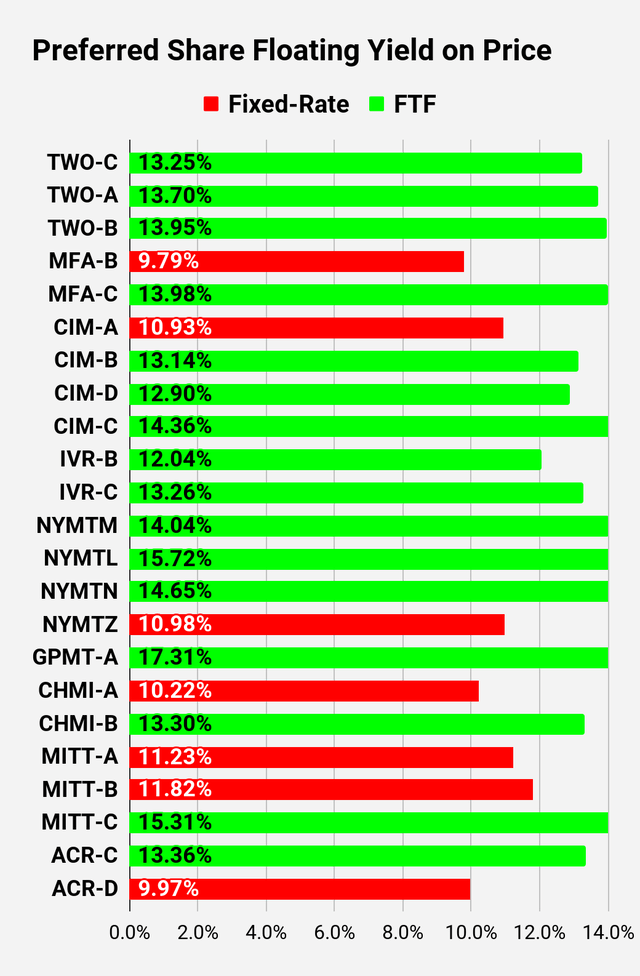
Preferred Share and Baby Bond Charts
I changed the coloring a bit. We needed to adjust to include that the first fixed-to-floating shares have transitioned over to floating rates. When a share is already floating, the stripped yield may be different from the “Floating Yield on Price” due to changes in interest rates. For instance, NLY-F already has a floating rate. However, the rate is only reset once per 3 months. The stripped yield is calculated using the upcoming projected dividend payment and the “Floating Yield on Price” is based on where the dividend would be if the rate reset today. In my opinion, for these shares, the “Floating Yield on Price” is clearly the more important metric.
 The REIT Forum |
 The REIT Forum |
 The REIT Forum |
 The REIT Forum |
 The REIT Forum |
 The REIT Forum |
 The REIT Forum |
 The REIT Forum |
 The REIT Forum |
Note: Shares that are classified as “Other” are not necessarily the same. Within The REIT Forum, we provide further distinction. For the purpose of these charts, I lumped all of them together as “Other”. Now there are only two left, PMT-A and PMT-B. Those both have the same issue. Management claims the shares will be fixed-rate, even though the prospectus says they should be fixed-to-floating.
Preferred Share Data
Beyond the charts, we’re also providing our readers with access to several other metrics for the preferred shares.
After testing out a series on preferred shares, we decided to try merging it into the series on common shares. After all, we are still talking about positions in mortgage REITs. We don’t have any desire to cover preferred shares without cumulative dividends, so any preferred shares you see in our column will have cumulative dividends. You can verify that by using Quantum Online. We’ve included the links in the table below.
To better organize the table, we needed to abbreviate column names as follows:
- Price = Recent Share Price – Shown in Charts
- S-Yield = Stripped Yield – Shown in Charts
- Coupon = Initial Fixed-Rate Coupon
- FYoP = Floating Yield on Price – Shown in Charts
- NCD = Next Call Date (the soonest shares could be called)
- Note: For all FTF issues, the floating rate would start on NCD.
- WCC = Worst Cash to Call (lowest net cash return possible from a call)
- QO Link = Link to Quantum Online Page
Second batch:
Third batch:
Strategy
Our goal is to maximize total returns. We achieve those most effectively by including “trading” strategies. We regularly trade positions in the mortgage REIT common shares and BDCs because:
- Prices are inefficient.
- Long-term, share prices generally revolve around book value.
- Short-term, price-to-book ratios can deviate materially.
- Book value isn’t the only step in analysis, but it is the cornerstone.
We also allocate to preferred shares and equity REITs. We encourage buy-and-hold investors to consider using more preferred shares and equity REITs.
Editor’s Note: This article covers one or more microcap stocks. Please be aware of the risks associated with these stocks.
Read the full article here