


By Brian Nelson, CFA
Nobody likes value traps. They can do some serious long-term damage to one’s portfolio. But what is a value trap? Well, in layman’s terms, it’s a stock that looks cheap at face value using valuation multiples–the most common of which being the price-to-earnings [P/E] ratio–but the stock may actually be fully valued, or worse expensive, after considering the process of enterprise valuation (also known as the discounted cash-flow [DCF] method) and after assessing the company’s cash-based sources of intrinsic value: net cash on the balance sheet and future expected enterprise free cash flows. We’ve used the following hypothetical example before in this article, but it bears repeating in this work to illustrate how investors can go wrong if they skip the DCF and instead rely on short-cut valuation multiples.
Let’s say a hypothetical company has 100 shares outstanding and generates $1 in earnings. Its share price is trading at $100 per share, and it has no debt and no contingent liabilities or other concerns. On the balance sheet stands $1 billion in cash, however. Would you buy this hypothetical stock for 100 times earnings? You might balk, and say “No way! Not at 100 times earnings. That’s far too expensive.”
Well, let me tell you. If you were to buy 100 shares of stock of this hypothetical company for $100 each (as in the hypothetical example), then you’d spend $10,000 for all the assets of the firm [100 shares of stock x $100 per share], and guess what? There is $1 billion of cash just sitting on the balance sheet that would be yours. As the then-owner of the company (you own all the shares), you would also own all the assets of the firm, too. Said another way, you’d be trading $10,000 [the purchase price for all the stock] for a $1 billion of cash on the balance sheet by buying all of this company’s stock at 100 times earnings. You’d also get all the company’s future free cash flows as a bonus.
The market is not this inefficient, of course, where situations like this would occur, but this hypothetical example is very important for two reasons. It shows: 1) valuation multiples can be misleading, and 2) the balance sheet is an absolutely critical component of value, often ignored…
…The stock market is not necessarily full of investors buying low P/E stocks and selling high P/E stocks, but rather it is full of investors that are selling stocks that they believe whose price is above a reasonable estimate of intrinsic value, and investors that are buying stocks that they believe whose price is below a reasonable estimate of intrinsic value. One could sell a high P/E stock because one thinks it is overvalued just because of the P/E, but the stock might not be overvalued at all. That stock could have a huge net cash position on the balance sheet just like the example above, or other valuation dynamics that are fantastic, which aren’t captured within this year’s or next year’s accounting earnings (i.e. the ‘E’ in the P/E ratio).
Warren Buffett has famously said that in similar words that ‘value’ is a component of ‘growth,’ and the term “value investing” is redundant. What he is referring to in part is how growth in future enterprise free cash flows within the DCF valuation process in part drives the value of the company–a company’s intrinsic value estimate on the basis of the stock’s cash-based sources of intrinsic value. A stock is not undervalued because it has a low P/E or a low price-to-book [P/B] ratio, but rather a stock can be considered undervalued if a reasonable DCF-derived fair value estimate is meaningfully above its share price. ‘Value’ and ‘growth’ are tied at the hip in this regard. However, most ‘value’ ETFs tend to look only at valuation multiples when dividing stocks between ‘value’ and ‘growth’ and because of this, many ‘value’ ETFs have become good proxies for measuring the returns of value traps in our view. From this perspective, the best way to evaluate how value traps have performed the past 20 years is to look at how the group of ‘value’ has performed relative to the group of ‘growth.’
The area of large cap growth has outperformed the area of large cap value by a considerable margin the past two decades. (TradingView)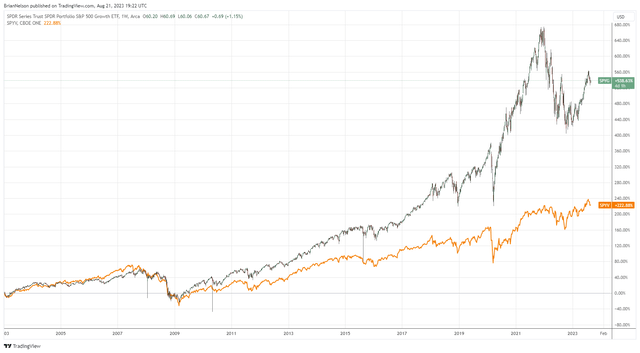
On a price-only basis, the SPDR Portfolio S&P 500 Growth ETF (SPYG) has outperformed the SPDR Portfolio S&P 500 Value ETF (SPYD) by over 300 percentage points during the past 20 years or so. ‘Value’ or perhaps better labeled value traps, have been laggards, and they generally should be. Just because a stock has a low P/E ratio or a low P/B ratio doesn’t mean it’s undervalued or an attractive investment consideration relative to other higher valuation-multiple ideas out there. Further, because many ‘value’ stocks typically have large net debt positions and their free cash flows are eaten up by dividend payments, the wide gap in price-only performance between these two ETFs also reveals that many stocks with strong cash-based sources of intrinsic value–net cash positions and gobs of free cash flow generation–have been the better investment considerations the past two decades.
This just makes sense to us. Quantitative value has generally missed the boat when it came to the attractiveness of equities with recurring, asset-light businesses models that throw off a lot of free cash flow, as many quants use book value (shareholders’ equity) in dividing equities between ‘value’ and ‘growth.’ Book value suffers from a number of faults, as entities such as Boeing (BA), McDonald’s (MCD), and Domino’s (DPZ) have had negative book value at times for various reasons (e.g., pension adjustments, recapitalizations, etc.), indicating that accounting book equity (shareholders’ equity) isn’t as reliable as one would like within the valuation process. Stock prices and returns are in part driven by a company’s net cash position and changes in expectations of future enterprise free cash flows. Book equity doesn’t have much to do with these cash-based dynamics that determine the value of a stock.
Many value traps tend to have low valuation multiples that many beginning investors seem to love. Value traps also tend to have large net debt positions, which is one of the biggest explanatory drivers behind why they have such low valuation multiples in the first place. Within the enterprise valuation construct, for example, net debt is a reduction to the discounted present value of future enterprise free cash flows. Net debt depresses the firm’s market capitalization that it otherwise would earn if it didn’t have a massively leveraged balance sheet, causing its price to be comparatively low relative to its earnings; hence, explaining its low P/E ratio. In this day and age with information at everyone’s fingertips, a low P/E ratio should be viewed as more indicative of a value trap than a truly undervalued equity. With all this being said, let’s have a look at three potentially dangerous value traps.
AT&T (T)
AT&T is trading at 5-6x forward earnings, which may seem cheap at face value, but the company’s financials have all the makings of a potentially dangerous value trap, in our view. AT&T has one of the worst qualities when it comes to intrinsic-value considerations, something that largely explains why it trades at such a low P/E ratio: Its net debt stood at a massive $133.75 billion at the end of the second quarter of 2023. The company’s free cash flow generation has improved to ~$8 billion during the first half of 2023 from the ~$5.9 during the same period a year ago, which is a good thing, but it is only part of the valuation story.
From our perspective, AT&T’s low P/E ratio does not speak to a stock at a bargain-basement price, but rather its low P/E ratio can be largely explained by uncertainties surrounding potential liabilities associated with lead cables and its massive net debt position that weighs on shares. Investors also have to accept the capital intensity inherent to AT&T’s business model (its capital spending is elevated), which could come back to haunt its improving free cash flow trajectory. If you’re wondering whether to consider buying AT&T at this point just because of its low P/E ratio, you may be focusing on many of the wrong things when it comes to investing.
Stanley Black & Decker (SWK)
Many Dividend Aristocrats suffer from lofty net debt positions and huge dividend liabilities that soak up much of their free cash flow generation. It’s worth emphasizing that, within the construct of enterprise valuation, net debt is subtracted from the present value of future expected enterprise free cash flows in arriving at a reasonable estimate of the intrinsic value of the equity, while over time, a company’s equity value (capital appreciation) is reduced by the payment of the dividend. Remember: if you have a $10 stock, and it pays a $1 in dividends, you don’t have a $10 stock and a $1 in dividends, but rather you have a $9 stock and a $1 in dividends. You can read more about the structural dynamics of the dividend payment in this article.
On the basis of its most recently-issued guidance, Stanley Black & Decker is expected to lose money on a GAAP basis this year. Looking back to peak earnings, however, one could make the argument that Stanley Black & Decker’s mid-cycle earnings power is in the mid- to- high-single-digits of earnings per share, suggesting the company could possibly be trading at a rather low double-digit normalized P/E ratio, which could be considered attractive at face value. However, the company has a large net debt position, comparatively little cash on hand, and free cash flow has been negative year-to-date in 2023, coming up short with respect to organically covering its dividend. In the context of its financials, Stanley Black & Decker fits the mold of a potentially dangerous value trap in or view.
Walgreens Boots Alliance (WBA)
Walgreen Co. used to be a clean “story.” Then, the firm bought Alliance Boots several years ago, and shares have languished for the better part of a decade now, after completing that transaction. Dealmaking, a dwindling stake in AmerisourceBergen (ABC), and liabilities related to the opioid crisis have only complicated Walgreens Boots Alliance’s investment prospects, not the least of which is the corresponding analytics. The market tends to like simple stories, and Walgreens is no longer one of them. During 2022, Walgreens Boots Alliance was one of the worst performers in the Dow Jones Industrial Average (DIA).
Shares are trading at a forward P/E of 6-7x, but as with AT&T, there may be a very good reason for it. The company has a large net debt position, and its free cash flow generation hasn’t been great. Walgreens noted in its most recent earnings release that “net cash provided by operating activities was $1.2 billion in the first nine months of fiscal 2023, a decrease of $2.6 billion from the year-ago period, and free cash flow was $116 million, a decrease of $2.5 billion from the year-ago period driven by lower earnings, lower working capital contributions, and increased capital expenditures including growth initiatives.” A low P/E, a large net debt position, and weakening free cash flow speak to a potentially dangerous value trap, in our view.
Read the full article here