


Written by Sam Kovacs.
Introduction
Piedmont Office Realty Trust, Inc. (PDM) just cut its dividend by 41% from $0.21 per quarter to $0.125, effectively slashing an 11% yield into a 7% yield.
Ouch!
PDM DFT Chart (Dividend Freedom Tribe)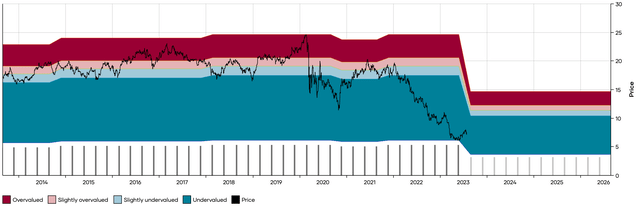
In the meantime, we’ve been implementing a strategy which has been generating 14% net yields, net of losses, and have had 96.8% successful trades on what we’ve been sharing here on Seeking alpha in the past two months.
Piedmont’s management somewhat hinted at a dividend cut, without flat out saying it in the last quarterly earnings call, just a few days before the cut was announced:
The company’s dividend for the last several years has been based upon our forecasted taxable income that includes our property operating income, interest expense, and gains and losses from the sale of real estate assets. With gains anticipated from the possible dispositions that Chris discussed, we’re not in a position at this time to speculate on what action the Board may take immediately regarding our dividend policy. However, as has been our long-term policy, we’d expect the dividend to be adjusted to taxable income forecasts.
There have been 9 articles on Seeking Alpha covering PDM in the past year, all of which said that the stock was either a buy or a strong buy.
Some called it their best pick for 2023, others said that the 12.8% yield was “investment grade,” or even “peachy.”
Nonetheless, when management dropped the hammer on investors a few days ago, the result was a 40% decrease in income.
And this is always the risk with high double-digit yielding stocks.
The yield usually comes at a price.
This doesn’t mean that we have never bought stocks with double-digit yields.
On March 17th, we suggested buying Arbor Realty Trust (ABR) at $11, when the stock yielded 14%.
The stock has returned 49% since then.
ABR DFT Chart (Dividend Freedom Tribe)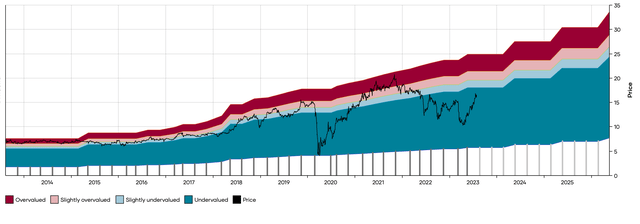
The dividend is well covered, and in my opinion the yield on Arbor comes at the price of complexity and market fear. Many investors do not understand ABR’s business model, which is why they reacted with so much fear to a baseless short report.
This is why our “High Yield” portfolio targets a yield of 6%.
It is the highest yield at which we believe we can create a well-balanced – well-diversified portfolio which can provide competitive market returns, dividend income and some dividend growth.
What to do when you need more yield?
The fact is, that some individuals approaching retirement or already in retirement need more yield.
They realize that their nest-egg just isn’t going to cut it if they don’t achieve a high yield on their investments.
Those folks will tell us “your 6% yielding portfolio is good in theory, but I need 10% to make ends meet.”
The desire for high yields doesn’t come from greed, it often comes from necessity.
Who’s to blame them? Food inflation, real estate inflation, raw materials inflation has eroded consumer buying power in the past few years.
As everything costs more, it is no surprise that individuals need more to make ends meet.
When the options are to either go back to work or to take on more market risk with high yielding equities, the latter option is often what they go for.
But taking more risk isn’t the right answer…
If being successful in the markets was as simple as buying equities with very high yields, everyone would just do that, and the high yields would erode.
Like I said above, a higher yield nearly systematically comes at a price. The price of higher risk. This is usually operational risk at the company level, which can trickle down into dividend cuts and stocks plunging.
If enough of your positions cut their dividend by 40% and lose 50% of their market value, you find yourself in between a rock and a hard place.
But it doesn’t need to be this way.
There is a way to generate higher yields without taking excessive risk.
But it involves having an edge.
The edge cannot come from equities
The edge cannot come from equities. Or it can, but it involves high quality stock selection, which just cannot be achieved with double-digit yields all while maintaining adequate diversification.
If you’re not sufficiently diversified, you’re taking on large amounts sector risk, which as anyone who was overweight tech in 2022 find out, is very dangerous.
Selling cash secured put options offers investors the possibility to generate high risks.
But there’s a caveat.
The caveat is that, to be successful in doing so, investors need to be able to select the right put options.
Not only those with the highest yields, but those with the lowest risk of assignment.
If you’ve never sold out of the money cash secured put options before, here’s how it works:
- You pick a stock which has options.
- You sell a put at a price lower than today’s and collect the premium right away.
- You set aside enough cash to cover 100x the strike price per option contract you trade (options are traded in lots of 100 shares)
- If in between now and the strike date, the share price stays above the strike price, the option will expire worthless.
- You then sell another put option and repeat.
- If the share price dips below the strike price, you’re now at risk of assignment. You have two possibilities:
- buy back the option at a higher price and take a loss and move on, or
- get assigned the stock you purchase.
- We prefer option 1, as it allows us to never carry stock.
It becomes clear that to be successful trading options in such a way, you must:
- Be able to identify options which pay the highest premiums
- Be able to identify the stocks which are the least likely of dipping below the strike price.
Without a systematic approach to these two challenges, you’ll be shooting in the dark, and likely to endure more pain than gain.
Introducing our YieldCraft Put Options
To differentiate the type of option that we trade from those which we’re not interested in, we’ve branded these YieldCraft options.
Like I mentioned before, these are options for which the premiums provide the highest yield.
The first step, of course, is to annualize the yield you’d get from selling an option at a certain premium.
If you can get a premium of $1 on an option where the underlying stock trades at $100, and there is 1 month until expiration, then we can calculate that we’re receiving a monthly yield of 1%, or an annual yield of about 12%.
If, for the same stock, you could get a $0.5 premium for the same $100 strike but with 15 days to expiration, then we can calculate that you’re getting 0.5% biweekly, or about 12% annually.
Both offer an equivalent yield.
So we calculate yields on tens of thousands of options daily from over 2,000 stocks (the largest 2K stocks in the US, all have a market cap of above $1bn).
And we keep those with a net yield of 10% or more, giving a provision of about $0.015 per share or $1.5 per contract in commissions.
That is the first part sorted, and it’s the easy part: focusing on the options which pay you a high yield.
The second part comes from minimizing risk. This is more an art than a science, as nobody can say with certainty where a stock is headed 10 to 60 days from now.
Here we employ a variety of risk metrics: First we weed out any stock which will announce earnings in between now and the expiration date.
Second we remove the 30% worst stocks on certain momentum metrics.
Then using historical volatility over the past year, we calculate an assignment risk in percentage points. We will calculate for instance that based on how the stock has behaved in the past 12 months, there is a 4% chance that the option will be assigned. We aim to never have something below 7%.
We will also look at the number of standard deviations from the mean the price would have to move to be assigned based on the option’s implied volatility.
We will finally only focus on options which expire in less than 50 days, as to ensure that we always limit our market exposure to a reasonable amount of time.
It is a process which we are constantly refining, and will be making our tech tools open to willing Seeking Alpha members in Q3 of 2023.
An option which passes all of our tests is branded a YieldCraft Put Option: and we’re willing to sell it.
The strategy’s risks
The risk comes from when the stock price goes below the strike price and you are forced to either buy back the option or take assignment of the stock.
In this case, you are obliged to either buy back the option at a higher price and incur a loss (our preferred methodology) or take assignment of the stock.
It is a given that not 100% of trades will be successful.
Since sharing two articles on Seeking Alpha with option trades implementing the strategy, 92 out of 95 trades were successful. The 3 losing trades would have made small losses, reducing the projected annual yield from 16% to 14%, once the losses are incurred.
That’s a 96.8% success rate, and we target to generate anywhere from a 16-20% net yield before losses and a 12-16% net yield after losses.
36 YieldCraft trades to execute at market open
Here are 36 YieldCraft Put option trades which I’m looking to execute at market open.
The list is on the smaller side of our daily lists, as we’re still going through earnings season, once earnings season is passed, the lists usually grow larger again.
Remember the prices of these options can be illiquid and might move in or out of your favor when you go to place the trades, make sure you’re executing them at a premium you’re comfortable with.
Note that I’m not looking to trade the Broadcom option as it would require over $80K per contract set aside to cover it.
The yields vary from 10% to over 50%. Very juicy yields.
|
Ticker |
Underlying last price |
Contract Name |
Exp Date |
Last Price |
Strike |
DFT Buy Below |
Bid |
Ask |
Bid/Ask spread |
Days before exp |
In the money |
Margin Of Safety |
Yield |
Net Yield |
Assignment risk |
Std Dev Safety |
Implied Volatility |
Volume |
Next Earnings Date |
|
Affirm Holdings Inc (AFRM) |
17.73 |
AFRM230818P00014000 |
08/18/2023 |
0.26 |
14 |
0.24 |
0.26 |
8 |
21 |
21.037789 |
29.7959183673 |
27.93367346939 |
0 |
3.9923224531 |
91.59 |
67 |
2023/08/24 |
||
|
Affirm Holdings Inc (AFRM) |
17.73 |
AFRM230818P00013500 |
08/18/2023 |
0.25 |
13.5 |
0.18 |
0.2 |
10.526316 |
21 |
23.857868 |
23.1746031746 |
21.24338624339 |
0 |
4.4892548676 |
92.37 |
101 |
2023/08/24 |
||
|
Affirm Holdings Inc (AFRM) |
17.73 |
AFRM230811P00013500 |
08/11/2023 |
0.13 |
13.5 |
0.08 |
0.1 |
22.222222 |
14 |
23.857868 |
15.4497354497 |
12.55291005291 |
0 |
6.7572917781 |
92.05 |
10 |
2023/08/24 |
||
|
Affirm Holdings Inc (AFRM) |
17.73 |
AFRM230811P00013000 |
08/11/2023 |
0.1 |
13 |
0.06 |
0.07 |
15.384615 |
14 |
26.677947 |
12.032967033 |
9.02472527473 |
0 |
7.3060104637 |
95.2 |
65 |
2023/08/24 |
||
|
AirBnb (ABNB) |
148.65 |
ABNB230804P00133000 |
08/04/2023 |
1.05 |
133 |
1.02 |
1.07 |
4.784689 |
7 |
10.528086 |
39.9892588614 |
39.40118152524 |
6.22 |
7.3617338799 |
74.57 |
33 |
2023/08/08 |
||
|
AirBnb (ABNB) |
148.65 |
ABNB230804P00132000 |
08/04/2023 |
0.93 |
132 |
0.9 |
0.95 |
5.405405 |
7 |
11.200807 |
35.5519480519 |
34.95941558442 |
6.22 |
7.7861898275 |
75.01 |
36 |
2023/08/08 |
||
|
AirBnb (ABNB) |
148.65 |
ABNB230804P00123000 |
08/04/2023 |
0.35 |
123 |
0.29 |
0.37 |
24.242424 |
7 |
17.255298 |
12.293844367 |
11.65795586527 |
0.6 |
10.8940613977 |
82.59 |
4 |
2023/08/08 |
||
|
AirBnb (ABNB) |
148.65 |
ABNB230804P00122000 |
08/04/2023 |
0.42 |
122 |
0.25 |
0.36 |
36.065574 |
7 |
17.928019 |
10.6850117096 |
10.04391100703 |
0.6 |
11.2587996432 |
83.03 |
0 |
2023/08/08 |
||
|
Atlassian Corp Plc (TEAM) |
177.93 |
TEAM230804P00145000 |
08/04/2023 |
1.59 |
145 |
1.5 |
1.65 |
9.52381 |
7 |
18.507278 |
53.9408866995 |
53.40147783251 |
4.5 |
9.0189006539 |
107 |
64 |
2023/08/10 |
||
|
Atlassian Corp Plc (TEAM) |
177.93 |
TEAM230804P00140000 |
08/04/2023 |
0.9 |
140 |
0.9 |
1 |
10.526316 |
7 |
21.317372 |
33.5204081633 |
32.96173469388 |
2.86 |
10.5550156109 |
105.31 |
1898 |
2023/08/10 |
||
|
Atlassian Corp Plc (TEAM) |
177.93 |
TEAM230804P00135000 |
08/04/2023 |
0.53 |
135 |
0.5 |
0.65 |
26.086957 |
7 |
24.127466 |
19.3121693122 |
18.7328042328 |
0 |
11.8118018778 |
106.51 |
21 |
2023/08/10 |
||
|
Broadcom Inc. (AVGO) |
893.53 |
AVGO230804P00835000 |
08/04/2023 |
2.2 |
835 |
630 |
1.7 |
1.95 |
13.69863 |
7 |
6.550424 |
10.6159110351 |
10.52224123182 |
3 |
9.9841509926 |
34.21 |
13 |
2023/09/07 |
|
|
C3.ai Inc – Class A (AI) |
41.22 |
AI230818P00032000 |
08/18/2023 |
0.67 |
32 |
0.54 |
0.66 |
20 |
21 |
22.367783 |
29.3303571429 |
28.515625 |
0 |
4.04972259 |
96 |
16 |
2023/08/30 |
||
|
C3.ai Inc – Class A (AI) |
41.22 |
AI230825P00030000 |
08/25/2023 |
0.65 |
30 |
0.6 |
0.74 |
20.895522 |
28 |
27.219796 |
26.0714285714 |
25.41964285714 |
0 |
3.4993046344 |
101.4 |
177 |
2023/08/30 |
||
|
C3.ai Inc – Class A (AI) |
41.22 |
AI230811P00030000 |
08/11/2023 |
0.21 |
30 |
0.2 |
0.23 |
13.953488 |
14 |
27.219796 |
17.380952381 |
16.07738095238 |
0 |
6.8118542893 |
104.18 |
22 |
2023/08/30 |
||
|
C3.ai Inc – Class A (AI) |
41.22 |
AI230818P00027500 |
08/18/2023 |
0.24 |
27.5 |
0.2 |
0.28 |
33.333333 |
21 |
33.284813 |
12.6406926407 |
11.69264069264 |
0 |
5.3487588663 |
108.16 |
47 |
2023/08/30 |
||
|
Coinbase Global Inc – Class A (COIN) |
96.39 |
COIN230804P00080000 |
08/04/2023 |
0.65 |
80 |
0.64 |
0.67 |
4.580153 |
7 |
17.003839 |
41.7142857143 |
40.73660714286 |
0 |
7.824805705 |
113.31 |
190 |
2023/08/08 |
||
|
Coinbase Global Inc – Class A (COIN) |
96.39 |
COIN230804P00079000 |
08/04/2023 |
0.53 |
79 |
0.54 |
0.59 |
8.849558 |
7 |
18.041291 |
35.6419529837 |
34.65189873418 |
0 |
8.2432916871 |
114.12 |
56 |
2023/08/08 |
||
|
Coinbase Global Inc – Class A (COIN) |
96.39 |
COIN230804P00071000 |
08/04/2023 |
0.2 |
71 |
0.15 |
0.23 |
42.105263 |
7 |
26.340907 |
11.0160965795 |
9.91448692153 |
0 |
10.9773829166 |
125.12 |
61 |
2023/08/08 |
||
|
Coinbase Global Inc – Class A (COIN) |
96.39 |
COIN230804P00070000 |
08/04/2023 |
0.15 |
70 |
0.13 |
0.2 |
42.424242 |
7 |
27.378359 |
9.6836734694 |
8.56632653061 |
0 |
11.5668924277 |
123.42 |
22 |
2023/08/08 |
||
|
Datadog, Inc (DDOG) |
110.64 |
DDOG230804P00096000 |
08/04/2023 |
0.14 |
96 |
0.19 |
0.22 |
14.634146 |
7 |
13.232104 |
10.3199404762 |
9.50520833333 |
6.43 |
11.4706520666 |
60.15 |
3 |
2023/08/09 |
||
|
Deere & Company (DE) |
432.95 |
DE230804P00410000 |
08/04/2023 |
0.95 |
410 |
0.76 |
0.96 |
23.255814 |
7 |
5.300843 |
9.6655052265 |
9.47473867596 |
5.82 |
9.2318338289 |
29.94 |
34 |
2023/08/18 |
||
|
Dycom Industries Inc. (DY) |
99.1 |
DY230818P00090000 |
08/18/2023 |
0 |
90 |
1 |
1.15 |
13.953488 |
21 |
9.182644 |
19.3121693122 |
19.02248677249 |
5.47 |
3.5162612054 |
45.39 |
0 |
2023/08/23 |
||
|
Eli Lilly and Company (LLY) |
453.59 |
LLY230804P00432500 |
08/04/2023 |
1.42 |
432.5 |
1.33 |
1.63 |
20.27027 |
7 |
4.649573 |
16.0346820809 |
15.85383980182 |
5 |
7.9961096361 |
30.32 |
18 |
2023/08/08 |
||
|
Eli Lilly and Company (LLY) |
453.59 |
LLY230804P00430000 |
08/04/2023 |
1.16 |
430 |
1.09 |
1.28 |
16.033755 |
7 |
5.200732 |
13.2176079734 |
13.03571428571 |
5 |
8.7874603118 |
30.86 |
133 |
2023/08/08 |
||
|
Eli Lilly and Company (LLY) |
453.59 |
LLY230804P00427500 |
08/04/2023 |
0.99 |
427.5 |
0.9 |
1 |
10.526316 |
7 |
5.75189 |
10.977443609 |
10.79448621554 |
5 |
9.4344135349 |
31.79 |
7 |
2023/08/08 |
||
|
Peloton Interactive Inc – Class A (PTON) |
8.76 |
PTON230818P00007000 |
08/18/2023 |
0.1 |
7 |
0.09 |
0.11 |
20 |
21 |
20.091324 |
22.3469387755 |
18.62244897959 |
0 |
4.2821134604 |
81.55 |
3 |
2023/08/24 |
||
|
Peloton Interactive Inc – Class A (PTON) |
PTON230811P00007000 |
08/11/2023 |
0.07 |
7 |
0.05 |
0.06 |
18.181818 |
14 |
20.091324 |
18.6224489796 |
13.03571428571 |
0 |
6.2920063549 |
83.25 |
0 |
2023/08/24 |
|||
|
Peloton Interactive Inc – Class A |
8.76 |
PTON230818P00006500 |
08/18/2023 |
0.06 |
6.5 |
0.05 |
0.06 |
18.181818 |
21 |
25.799087 |
13.36996337 |
9.35897435897 |
0 |
5.2092553775 |
86.08 |
0 |
2023/08/24 |
||
|
Plug Power Inc. (PLUG) |
12.01 |
PLUG230804P00010000 |
08/04/2023 |
0.05 |
10 |
0.04 |
0.05 |
22.222222 |
7 |
16.736053 |
20.8571428571 |
13.03571428571 |
3.65 |
9.9494429883 |
87.71 |
233 |
2023/08/08 |
||
|
Splunk Inc. (SPLK) |
102.29 |
SPLK230804P00094000 |
08/04/2023 |
0.16 |
94 |
0.17 |
0.22 |
25.641026 |
7 |
8.104409 |
9.4300911854 |
8.59802431611 |
6.43 |
9.8666132773 |
42.83 |
1 |
2023/08/23 |
||
|
Unity Software (U) |
43.21 |
U230804P00036000 |
08/04/2023 |
0.37 |
36 |
0.33 |
0.36 |
8.695652 |
7 |
16.685952 |
47.7976190476 |
45.625 |
0 |
8.2822773643 |
105.05 |
34 |
2023/08/08 |
||
|
Unity Software (U) |
43.21 |
U230804P00035000 |
08/04/2023 |
0.27 |
35 |
0.23 |
0.25 |
8.333333 |
7 |
19.000231 |
34.2653061224 |
32.0306122449 |
0 |
9.3491210997 |
105.97 |
51 |
2023/08/08 |
||
|
Unity Software (U) |
43.21 |
U230804P00034000 |
08/04/2023 |
0.16 |
34 |
0.15 |
0.17 |
12.5 |
7 |
21.314511 |
23.0042016807 |
20.70378151261 |
0 |
10.4317579195 |
106.54 |
16 |
2023/08/08 |
||
|
Unity Software (U) |
43.21 |
U230804P00033000 |
08/04/2023 |
0.12 |
33 |
0.11 |
0.12 |
8.695652 |
7 |
23.62879 |
17.380952381 |
15.01082251082 |
0 |
11.169183343 |
110.31 |
15 |
2023/08/08 |
||
|
Vmware Inc. Class A (VMW) |
158.8 |
VMW230818P00140000 |
08/18/2023 |
0.95 |
140 |
0.85 |
1.4 |
48.888889 |
21 |
11.838791 |
10.5527210884 |
10.36649659864 |
1.62 |
4.626112039 |
44.48 |
31 |
2023/08/31 |
Conclusion
If you want higher returns, you either take on more risk at your own peril, or you find an edge.
Selling YieldCraft Put Options in a systemic fashion as we have done has so far generated 96.8%
The Options By Kovacs account has provided updates on all our trades which have expired so far and will continue to do so in the future.
Read the full article here