


I was admittedly somewhat cautious on the global stock market coming into 2024. Election-year seasonal trends pointed to a soft first quarter before a mid-year rise. That cadence did not play out. In fact, the Q1 was unusually strong, particularly for US equities. Foreign stocks were less stellar as the mega-cap tech trade took on added steam through the middle of July.
Today, the iShares MSCI ACWI ETF (NASDAQ:ACWI) trades near 18 times earnings, more than four turns more expensive than it sold for at the index’s low in October 2022. But given a strong share-price appreciation in the last 23 months without a major multiple expansion, earnings growth has proven to be a strong upside catalyst.
While I see rising earnings trends in the out year, I reiterate a near-term hold rating on the fund. At the end of the article, I will note a favorable spot to re-enter ACWI based on technical signals.
ACWI Near 18x Earnings
Yardeni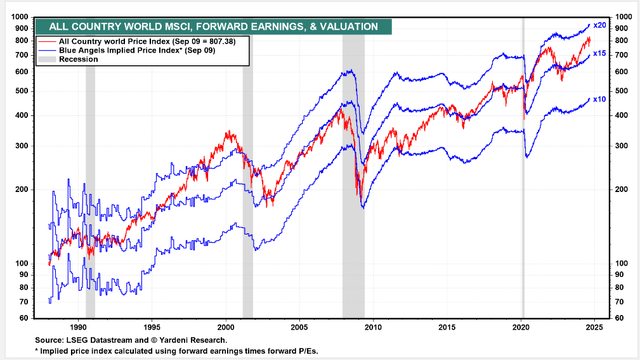
ACWI EPS Growth Seen at 13.6% in 2025
Yardeni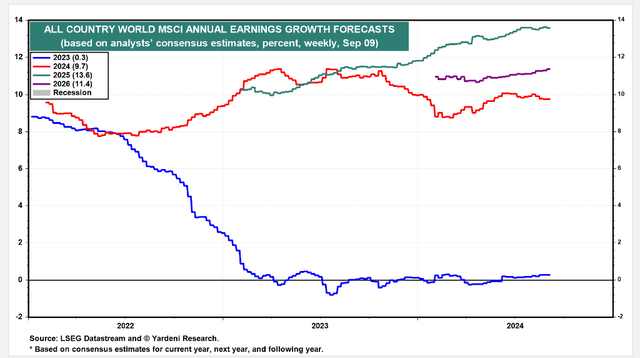
MSCI AC World EPS Actuals and Forecasts
Goldman Sachs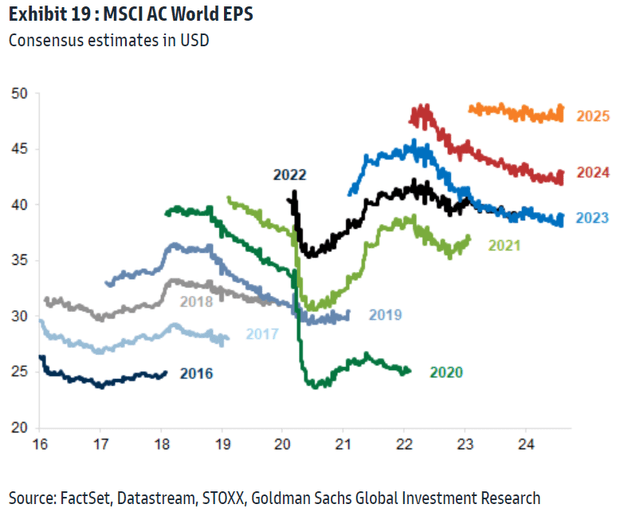
According to the issuer, ACWI aims to track the performance of the MSCI ACWI index, which includes large- and mid-capitalization companies from developed and emerging markets.
ACWI is a large ETF with nearly $18 billion in assets under management as of September 9, 2024, but that’s about unchanged since my analysis in Q4 2023. The ETF sports a moderate 0.32% annual expense ratio, and I would encourage investors to consider the Vanguard Total World Stock Index ETF (VT) as its annual cost is just 0.07%. ACWI pays a 1.93% forward dividend yield, more than 40 basis points above that of the S&P 500.
With strong share price momentum and solid risk ratings, there are certainly quantitative aspects of ACWI that are appealing. Liquidity is another strong point – average daily volume is more than 1.2 million shares while its 30-day median bid/ask spread is tight, averaging just a single basis point, per iShares.
Looking closer at the valuation, the 3-star, Bronze-rated ETF by Morningstar is focused on large caps, but there is a modest amount of mid-cap exposure. The latest P/E ratio is 18.8x, which is to the high side compared with recent years, while its long-term earnings growth rate is solid at 11.8, making for a middle-of-the-road PEG ratio near 1.6.
For my personal allocation, I prefer to split out US and non-US equity ETFs for tax purposes – holding foreign stock funds in taxable accounts, while paying out higher dividends, offers the potential to capture the foreign tax credit, which can help reduce taxes. While every investor’s situation is unique and this is not tax advice, it’s a strategy to consider. Still, I spread out exposure across account types for diversification purposes (taxable, pre-tax, and Roth).
ACWI: Portfolio & Factor Profiles
Morningstar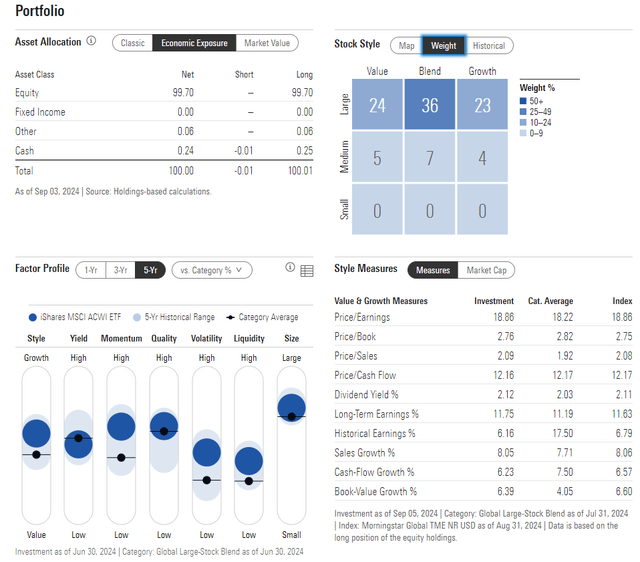
I do like ACWI from a sector breakdown perspective. Just one-quarter of the ETF is invested in the Information Technology sector, a significantly lower percentage compared with the S&P 500. Financials, among the best-performing areas of the market so far this year, is the next-highest weight.
Big picture, there is better equity and style diversification with ACWI which is an attractive aspect.
ACWI: Holdings & Dividend Information
Seeking Alpha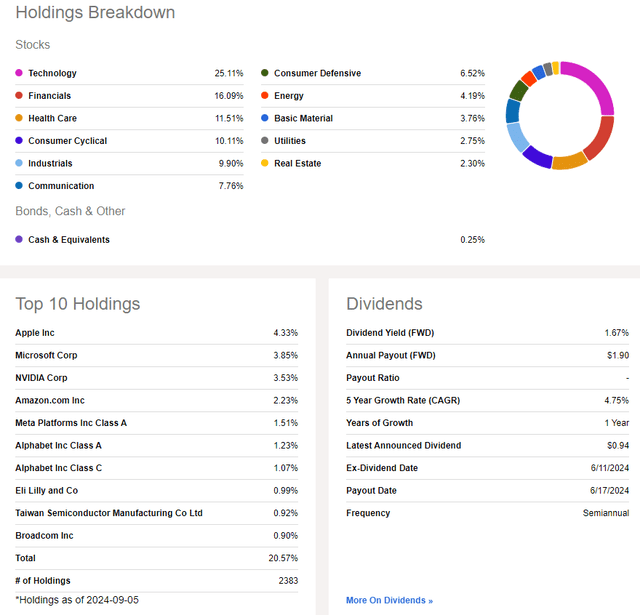
Now here is where we run into short-run bearish risks with global stocks. ACWI’s average September return has been –2.2% over the past 10 years.
We are already off to a rough start, and with a weak technical feature in play (which I will shed light on later in the article), I expect more volatility in the next handful of weeks ahead of the US general election.
ACWI: Bearish September Trends
Seeking Alpha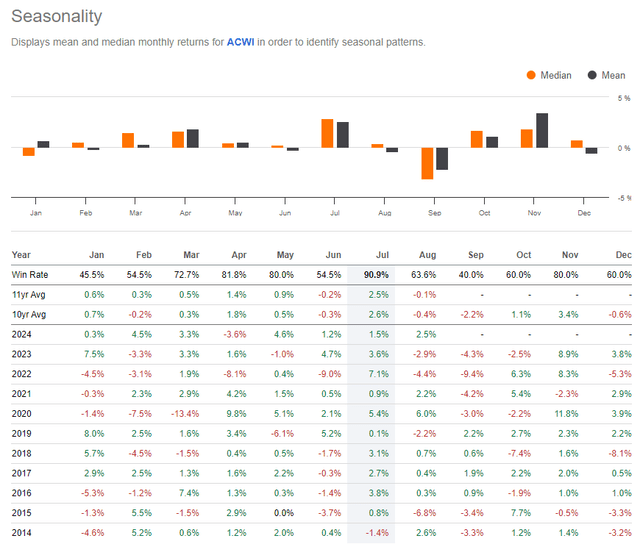
The Technical Take
With a lukewarm valuation, bearish near-term seasonal trends, and a competing ETF that is materially cheaper, ACWI’s technical chart has some issues. Notice in the graph below that shares put in a bearish double top over the summer. The $117 price point was met with selling pressure on a pair of occasions, the second coming on weaker RSI momentum, something technicians call bearish non-confirmation. ACWI has now fallen modestly below its flat 50-day moving average.
The good news is that both the 50dma and today’s price are above the long-term 200dma, which is positively sloped. I also see clear support in the $107 to $108 range – that’s not only where the long-term moving average comes into play, but also where the late 2021 peak happened. Also, an uptrend support line enters the picture at that price confluence, too.
Overall, I see downside risks on the chart, but buying ACWI on a pullback to $108 appears as a favorable risk-reward.
ACWI: Double-Top Pattern, Key Support Near $108
Stockcharts.com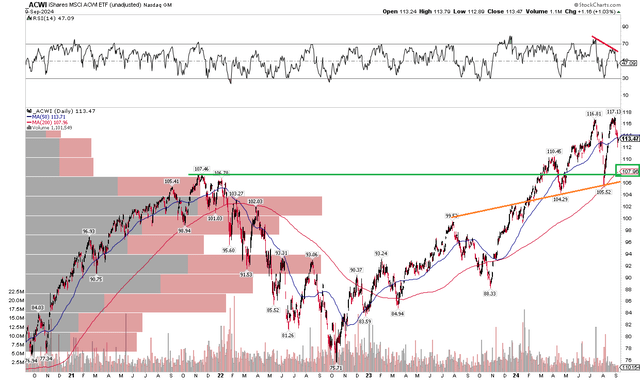
The Bottom Line
I have a hold rating on ACWI. Its valuation is not overly cheap, while the technical situation suggests continued volatility over the next month plus.
Read the full article here