

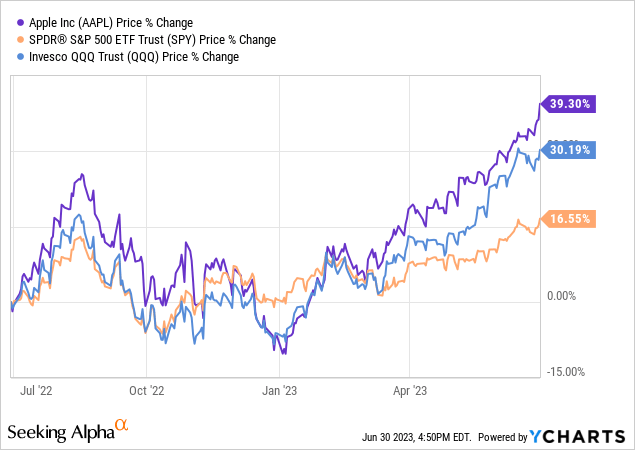
Apple (NASDAQ:AAPL) stock has been on an upward rampage since the beginning of the year with gains already approaching 40%. This outpaces the Invesco QQQ Trust ETF (QQQ) by nearly 10% and the SPDR S&P 500 ETF Trust (SPY) by nearly 23% and is even more impressive considering Apple makes up a large part of these ETFs.
However, what looks impressive may end up being a big red flag for the stock in the near term. The gains outpace any justification when looking at earnings expectations. Based on the trajectory, or lack thereof, of upward EPS estimates, an already high valuation, and a decreasing but stabilizing operating performance, I would lean in the direction of a near-term sell rating for Apple. This is countered by the historically strong performance of the stock over multiple time periods that raises this to hold when considering mean reversion models and the current expected return based on prior 1-year returns. Basically, positive sentiment is capable of holding Apple at elevated levels for a long period of time while fundamentals catch up. We look at the historical performance of Apple stock first and follow up with a look at valuation and operating performance.
Apple’s Historical Performance
Before we look at Apple’s current situation, it’s worth a short history lesson to understand why it has been one of the most popular stocks over the last 25 years. The answer is relatively simple. It has been one of the best stocks to own over the last 25 years. Those fortunate enough to have bought in early have been rewarded with an average annual total return of ~42% and likely won’t care much about the prospects over the next 12 months. They’ll be too busy booking tee times and figuring out which vacation home to spend the week. Those who bought a year ago might be a little more interested even though they’re already up ~37%. The following table highlights the impressive performance of Apple stock since 1998.
AAPL Performance Analysis (June 1998 – June 2023) (Michael Thomas)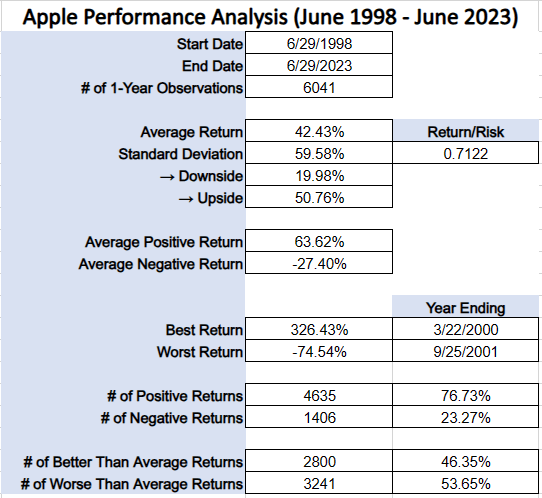
The high return has been accompanied by high volatility as measured by standard deviation. However, most of the volatility has been upside volatility and that’s a good thing when you’re long a stock. The performance over the entire period has been stellar but what happens when we chop it up into all possible periods in between? The following table shows annual total returns for all possible start and end-year combinations since June 1998.
Apple Annual Return Yearly Cross-Reference (Michael Thomas)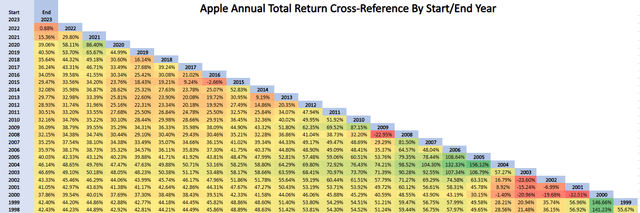
Starting off, we see the oversized returns preceding the tech wreck during the early 2000s. Then it’s off to the races with oversized returns settling into more average returns over the rest of the period, with the Great Financial Crisis marking a short-lived drawdown. In general, it would have been a feat to own Apple and not have had great returns in almost any combination of years presented. The next table shows the corresponding volatility associated with each period.
Apple Volatility Yearly Cross-Reference (Michael Thomas)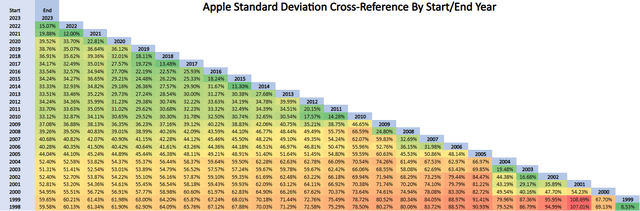
Working from the lower right to the upper left of the table we see that Apple was more volatile early on. This is further supported in the next table showing return/risk where we see the ratio increasing as we move toward the upper left side.
Apple Return/Risk Yearly Cross-Reference (Michael Thomas)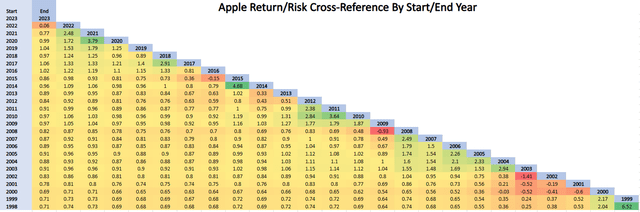
Another view of performance is outlined in the following table. We begin to take a look at whether the current 1-year total return for Apple at ~37% is a precursor to bad returns over the next 12 months or not. The main focus is on mean reversion. The table shows the probability of a negative return following various 1-year performance ranges.
Apple 1-Year vs Prior 1-Year Probability (Michael Thomas)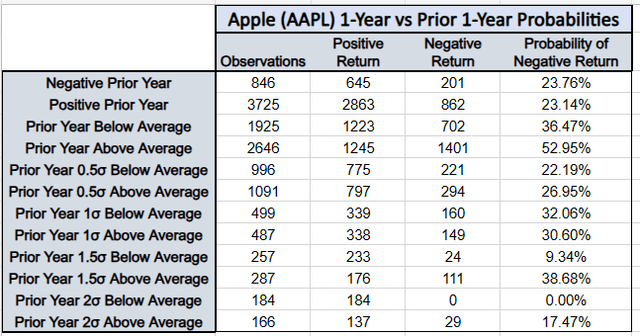
We’ve already seen that Apple’s average 1-year total return over the last 25 years is 42.43%. Comparing that to the most recent 1-year return of 36.98% places it between the “Positive Prior Year” and “Prior Year Below Average” categories, with a following 1-year negative return probability somewhere between 23.14% and 36.47%. The mean reversion model gives pretty decent odds of at least a positive return over the next 12 months and is largely in line with the 3:1 odds of a positive return over the 25-year period.
The next table helps visualize the relationship between 1-year and prior 1-year return. Prior 1-year returns are shown in red and sorted in ascending order. Following 1-year returns are shown in blue.
Apple 1-Year vs Prior 10Year Returns Chart (Michael Thomas)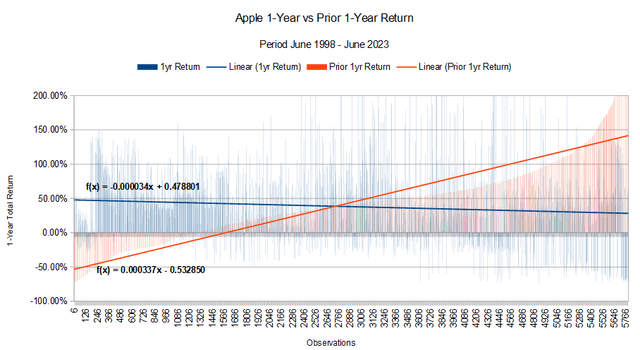
From the chart, lower prior 1-year returns produce higher following 1-year returns on average and vice versa. For some fun with math, we can calculate an expected return based on mean reversion over the next 12 months using the trendline formulas and the latest 1-year return of 36.98% as the prior 1-year return. First, using the formula for the prior 1-year return to solve for x,
.3698 = .000337x – 0.532850, yields x = 2,678
Then plug in the value for x into the 1-year trendline formula,
y = -0.000034 (2678) + 0.478801, yields 38.77%
So even with an already strong 1-year return, the model predicts an even stronger return over the next 12 months. Of course, this is purely based on mean reversion and includes a period of 25 years where Apple has evolved over that time.
Near-Term Warnings
The biggest arguments against Apple are its current valuation and slowing growth. Apple’s forward P/E of 31.78 is 35% higher than its 5-year average forward P/E of 26.38. Comparing forward P/E ratios of 24.93 for QQQ and 20.09 for SPY also highlights a hefty premium and suggests the stock has run way ahead of earnings estimates. This is highlighted in the following chart which compares the increase in share price to the increase in forward EPS estimates along with the forward earnings yield over the last 3 years.
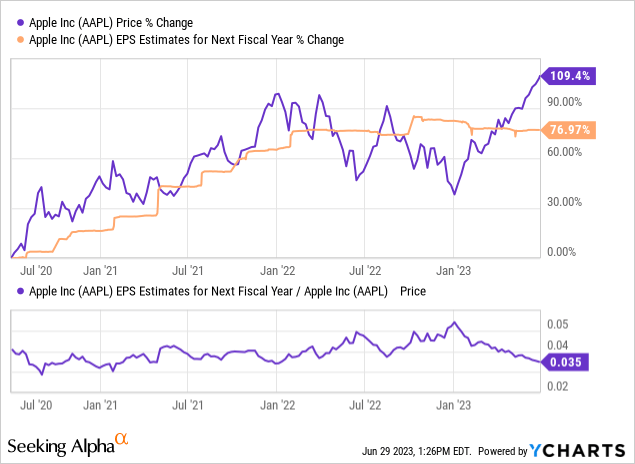
The chart shows that early share price increases were warranted and kept pace with increases in forward EPS estimates. It also shows that the current forward earnings yield of 3.5% is relatively unattractive. Now that we’re in a period of very little to no growth in forward estimates, the run in share price is no longer warranted unless estimates are somehow due to surprise to the upside in the near term. That doesn’t appear to be happening with earnings revisions over the last 6 months mostly flat to slightly down.
Apple Earnings Revisions (Seeking Alpha)
I think it’s more likely that the premium seen in the share price will disappear, bringing the valuation down to a more reasonable level. In addition, the management needs to show continued improvement in operating performance. The following table shows quarterly EBITDA growth and attempts to smooth out results to find underlying trends.
Apple QoQ EBIDTA Trend (Michael Thomas)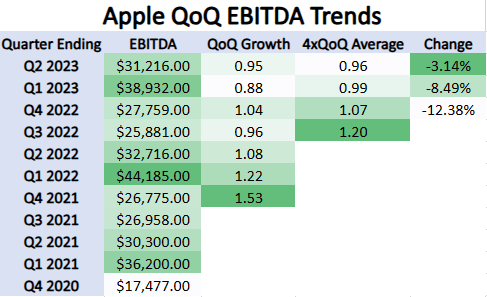
At first glance, it is evident that in 3 out of the last 4 quarters, EBITDA has decreased. This supports the stalled growth in forward EPS estimates already discussed. Smoothing out the data with a running average of four quarterly growth rates reveals that the decrease in EBITDA is slowing. It’s quite possible that the percent change could turn back to positive next quarter and that would likely be accompanied by an increase in earnings revisions. However, I don’t think it’s enough to fill the gap in share price premium over current forward EPS estimates.
Conclusion
I’m somewhat torn on what rating to provide for Apple given my mean reversion model suggests the stock is a buy but the current valuation suggests it is a sell. In addition, the conclusions drawn from another article I wrote comparing market cap to equal-weighted S&P 500 performance also suggest a possible cooling off of mega-cap names. I suppose it’s appropriate to settle on a hold as it’s really difficult to bet against such a historically great stock. Those looking to get into Apple at current levels should exercise caution as better buying opportunities might be just around the corner. Those long-time holders sitting on big gains but wanting short-term insurance could consider buying the August 18 expiration 190 put option at ~$4.35. This would add downside protection through the next earnings release for a 2.25% premium cost.
Read the full article here