


Overview
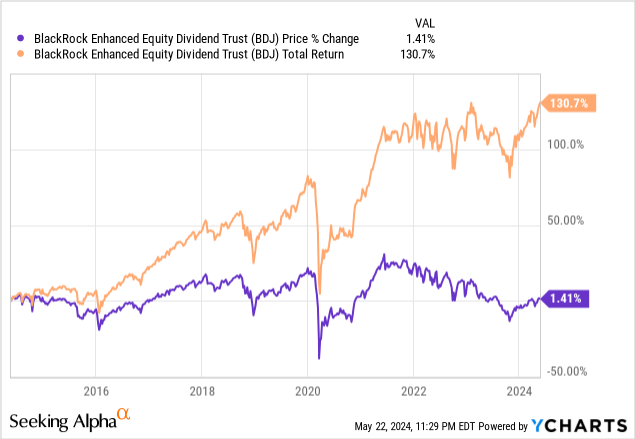
I am always intrigued by closed end funds that can offer a high level of income while also having a solid history of total returns year after year. BlackRock Enhanced Equity Dividend Trust (NYSE:BDJ) operates as a closed end fund that has the primary objective to generate cash flows to support current income. It does this by investing in dividend paying stocks while also implementing option strategies to amplify the returns when possible. We can see that BDJ’s price has not delivered any meaningful growth over the last decade, however the total return still sits above 130% over the same time period through the continuous high distributions.
The current dividend yield of BDJ sits around 8.7% and the distributions are issued out on a monthly basis. This makes BDJ an attractive CEF to help support investors that are at or nearing retirement age and depend on the income generated from their investments to fund their lifestyle expenses. However, there may be better alternative funds out there that provide both high income and capital appreciation, which I will also cover.
When it comes to these high yielding vehicles like closed end funds, I believe that when you buy has a large impact on what your total return looks like. Since BDJ operates as a closed end fund, the price can trade at different valuations from the actual net asset value of the fund. At the moment, the price trades at a higher discount than the last three year average. This could indicate that it’s a great time to start a position. Before we go into those details, let’s first take a look at the fund’s strategy, holdings, and vulnerabilities.
Holdings & Strategy
BDJ has a market cap of approximately $1.73B and was launched towards the latter half of 2005. Under normal market conditions the fund’s strategy is to invest almost all of its assets into stocks that pay a dividend. However, BDJ may occasionally invest up to 20% of its assets into stocks that do not pay a dividend if there’s an opportunity to capture some upside price appreciation. The fund prioritizes investments into equities that have a market cap greater than $10B, accounting for over 95% of their portfolio make up.
The fund has a management fee of 0.80% and the gross expense ratio is 0.86%, according to the most recent fact sheet. What makes BDJ unique is the inclusion of an option writing strategy to help boost potential returns. Their strategy is to write options against 30% to 40% of the fund’s net assets. These option income received can help make up the distribution coverage on years when the fund may not earn enough net investment income or capital gains.
Taking a look at the holding strategy of BDJ, the fund leans a little more heavily on the financial and health care sectors as these make up the largest percentage of the portfolio. Additionally, the fund has a primary focus on investments based within the US, making up 83.1% of the exposure. However, there is some slight exposure to international markets including the UK, France, Japan, Canada, and Germany for example. Financials account for 27.65% and healthcare accounts for 18.04%. In addition, the fund does have some small exposure to the real estate sector which may help boost yields throughout the portfolio.
Taking a look at the top ten holdings, we can see a diverse range of top tier companies. There are approximately 98 different holdings within the portfolio. These top ten holdings make up nearly 27% of the total net asset value of the portfolio.
| Top 10 Holdings | % of Total |
|---|---|
| Wells Fargo & Co (WFC) | 3.57% |
| Citigroup (C)(CITI:CA) | 3.45% |
| American International Group (AIG) | 3.09% |
| General Motors (GM) | 2.59% |
| Micron Technology (MU) | 2.50% |
| Fidelity National Information Services (FIS) | 2.39% |
| First Citizens (FCNCA) | 2.39% |
| BP (BP) | 2.34% |
| Kraft Heinz (KHC) | 2.24% |
| L3Harris Technologies (LHX) | 2.16% |
Weakness – Performance Comparison
While the portfolio remains diverse in nature, I dislike the fact that there is a lack of technology exposure. The tech sector accounts for only 6.95% of the total portfolio and I believe this means that BDJ is leaving a lot of potential growth through capital appreciation unaccounted for. Granted, this is understandable as the tech sector isn’t typically known for their ability to pay sizeable dividends over time. For instance, take a look at the price movement comparison between BDJ and similar fund, BlackRock Science and Technology Trust (BST) which does have a primary focus on tech holdings while simultaneously offering a dividend yield that’s similar.
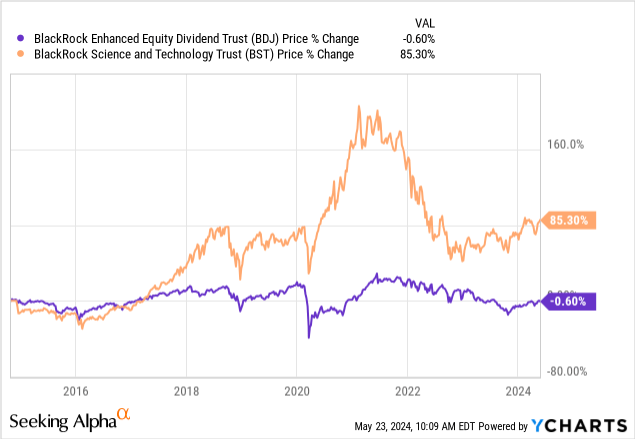
BST has been able to better capitalize on price growth through its exposure to heavy hitters within the tech sector. This includes exposure to companies like Nvidia (NVDA)(NVDA:CA), Microsoft (MSFT)(MSFT:CA), Apple (AAPL)(AAPL:CA), and Broadcom (AVGO)(AVGO:CA). This is a major weakness for BDJ because BST’s yield is quite similar at 8.15%.
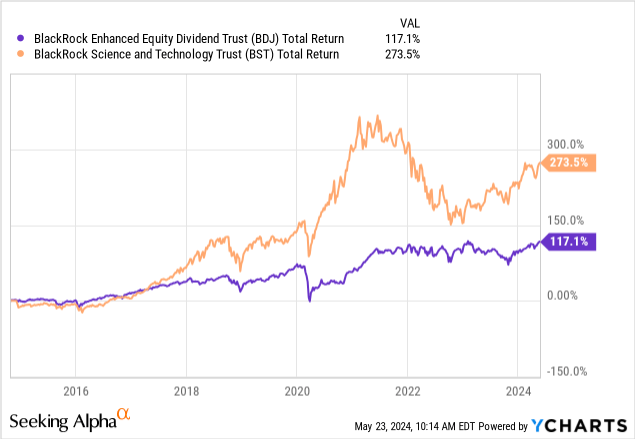
I imagine that it would be an easy choice between the two funds: a slighter higher yield with BDJ but less total returns? Or do you want higher total returns with a slightly lower yield that’s almost similar? Over a decade time frame, BST has provided a much higher total return compared to BDJ. However to BDJ’s credit, it has offered a much less volatile holding experience. These are things to consider here but it looks like BST has severely outperformed BDJ since 2017.
If you’re interested in learning more about BST, I put together an analysis that was published in early May. I go into more detail of the fund specifics such as the strategy, dividend yield, holdings, and valuation. When holding a fund like BDJ, you have to consider what your main objective is. Are you focusing on income? Or do you want total return? If you want income, then perhaps it may be a good fit but if total return is what you’re after, you may be better off with a fund that has a solid history of growing in price and distribution year after year.
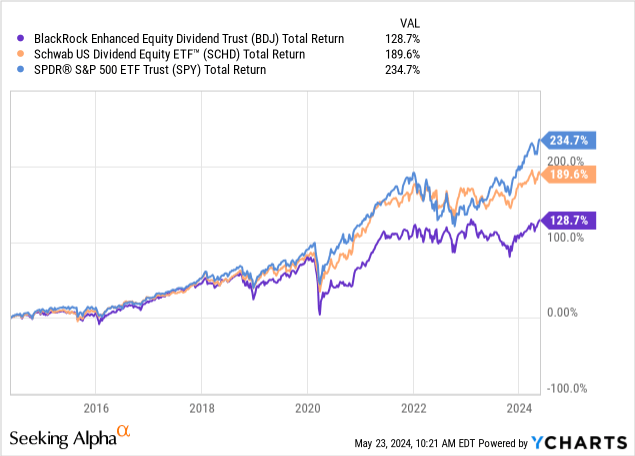
BDJ would be best utilized by the investor that is already using or prepping to use the income created from their investments. The higher yield grants you instant access to a larger stream of dividend income. However, if you are still an accumulator that doesn’t have much of a focus on income, you can focus on alternatives that offer better price appreciation, such as Schwab’s US Dividend Equity ETF (SCHD), which outperforms BDJ over a ten year time frame.
Financials & Dividends
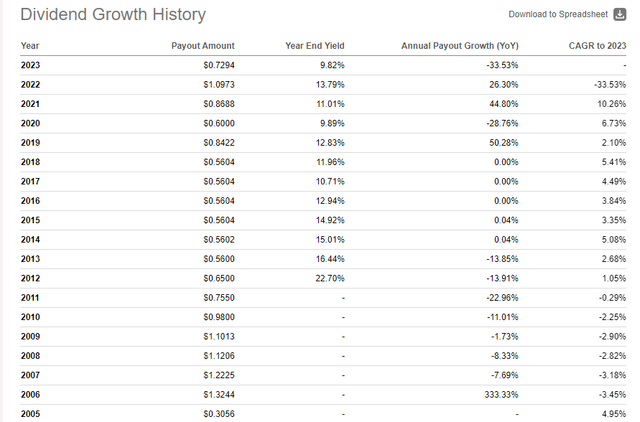
As of the latest declared monthly dividend of $0.0562 per share, the current dividend yield sits at 8.7%. While the dividend yield remains attractive, the growth history is a bit sporadic. Taking a look at the annual payouts throughout its history, we can see that the totals shift according to the fund’s performance in that year and whether or not there was a special dividend issued.
The special dividends can be a bit unpredictable since they are based on the fund’s performance of holdings, option writing, and capital gains. However, I can say that the payouts have been trending upward as the dividend has increased at a CAGR (compound annual growth rate) of 5.41% over the last five year period. This kind of dividend growth is always appreciated when the starting dividend yield is already high.
Seeking Alpha
Something to keep in mind with these dividends, is that they are not tax efficient. Most of the distributions received are classified as ‘ordinary dividends’ which are taxed at higher rates than qualified dividends. This is likely due to the inclusion of the option writing and sector exposure to real estate. Since the dividend yield is higher, a reinvestment of these dividends can essentially create a snowball effect of higher income over time.
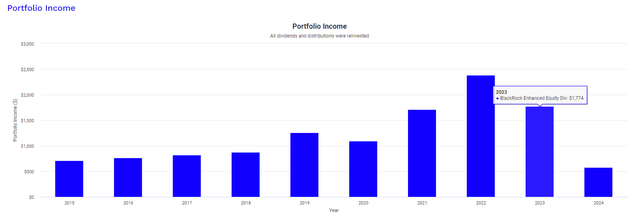
Using Portfolio Visualizer, we can see how an original investment of $10,000 would have resulted in dividend income growth. This visual assumes that all dividends were reinvested but no additional capital was ever deployed on top of the initial position. In 2015 your dividend income would have totaled $713 annually. This total would have now grown to $1,774 for the full year of 2023 but as you can see, the growth trajectory isn’t consistent year over year.
Portfolio Visualizer
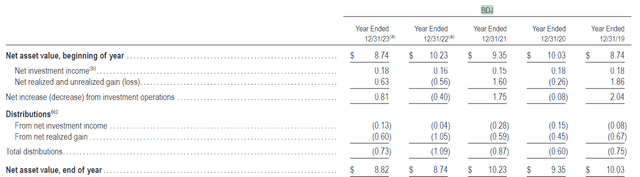
Even though BDJ has the compounding power to grow your income, let’s also review the breakdown of these distributions. Taking a look at page 153 of the 2023 annual report, we can see the breakdown of the distribution in greater detail. We can see that distributions are mostly made up of net investment income and net realized gains. For 2023, NII (net investment income) totaled $0.18 per share, while net realized gains equaled $0.63 per share. This fully covered the distribution of $0.73 per share for the year and, as a result, we saw NAV (net asset value) increased from $8.74 up to $8.82 at the end of the year.
BDJ 2023 Annual Report
While it seems like BDJ doesn’t have any return of capital listed here as part of the distribution, it does seem like the distribution is pulled directly from excess of prior years when performance cannot support the distribution. For example, in 2022 NII per share came in at $0.16 while net realized losses amounted to $0.56 per share. This results in a net decrease from investment operations of $0.40 per share, which was not enough to cover the full year distribution totaling $1.09 per share. However, net realized gains in 2021 were strong, so there was excess that was stored aside for instances like this to make up the difference.
Lastly, I wanted to mention the recently discount management program that BlackRock has implemented. BlackRock has announced at the start of May that they will now be offering to repurchase a portfolio of its shares at a discount of NAV. You can learn more about this in the latest communication.
If a Fund’s common shares trade at an average daily discount to net asset value (“NAV”) of more than 7.50% during a 3-month measurement period (each, a “Measurement Period”), the Fund intends to offer to repurchase 2.5% of its outstanding common shares at a price equal to 98% of the Fund’s NAV, as determined on the trading day after the tender offer expires, as soon as practicable following the Measurement Period end date.
Valuation
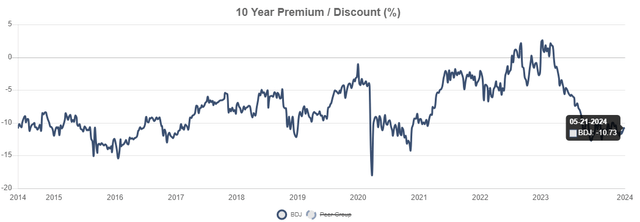
The price of BDJ still trades below its pre-pandemic range, despite the current NAV of $8.74 per share perfectly aligning with the NAV of $8.74 per share at the end of 2019. NAV at the end of 2022 came in at $8.74 per share, which means that the value has slightly increased since then. Despite this, the price trades at a discount to NAV of 10.73%. For reference, the price has traded at an average discount to NAV of only 4.77% over the last three year period. I believe this means we have the opportunity for an attractive entry point as NAV has slightly grown.
CEF Data
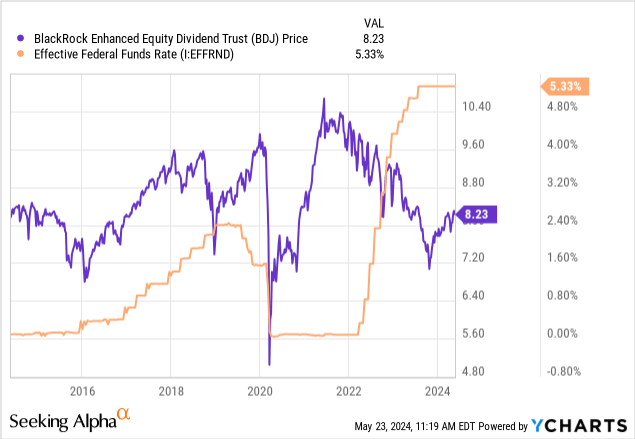
Additionally, I believe that we may have the opportunity to see the price appreciate to the upside with future interest rate cuts. When rates were near zero in 2020, the price of BDJ appreciated to the upside very rapidly. However, when interest rates started to rapidly rise around the mid-point of 2022, we saw the price of BDJ fall and eventually stabilize around the current range. As interest rates remain elevated, I believe that we are seeing suppressed valuation as debt becomes more expensive to obtain.
Plenty of large cap companies depend on access to cheaper debt to fund growth initiatives, research and development of new products, or expansion of operations. Right now we are experiencing many companies play it conservatively and focus more on capital preservation and cost cutting. Morgan Stanley analysts estimate that interest rates may have a chance to start getting cut around September of 2024. If this happens, we may see the price begin to move to the upside as holdings within start to grow. I tend to align with the analysts as inflation should continue to cool over the next quarter.
Takeaway
BlackRock Enhanced Equity Dividend Fund offers a way to capture a high yield while maintaining exposure to a diverse set of industries and companies. The fund has the inclusion of an option strategy to help amplify returns when markets are volatile and to assist with earnings when net investment income and realized gains may not be as strong. The fund has been able to grow the distribution over time but at a less consistent rate, which makes it a bit more sporadic of an income holding. The price remains at an attractive entry point as it trades at a discount to NAV over 10%. However, I can’t help but think that BDJ gets overshadowed by BlackRock’s other tech focused closed end fund, BST. BST has tech exposure so it tends to capture more upside price movement while also offering a similar dividend yield. If you are okay with sacrificing a bit of total return in exchange for higher income, BDJ may be a good fit for you.
Read the full article here