


The VanEck BDC Income ETF (NYSEARCA:BIZD) is a specifically constructed ETF to track the performance of the overall publicly traded business development companies [BDC] segment.
Let’s now take a look at the underlying structure of BIZD.
The first thing that we have to consider is that while BIZD is an ETF, there seems to be not that great diversification embedded in the Fund.
VanEck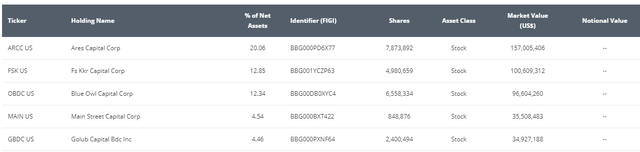
For example, there are only 26 companies, which are tracked by BIZD. Plus, Top 5 holdings account for roughly 50% of the total AuM with the Top 2 explaining circa 32%.
This is rather atypical for ETF vehicles, which tend to carry a large pool of companies in order to mitigate the liquidity and concentration risk as well as to better reflect the dynamics of a specific market, which, in this case, is a BDC segment.
If we zoom deeper into the list of 26 holdings, we will notice that almost the entire universe of the U.S. publicly traded BDCs is included in the portfolio.
Yet, again, due to a heavy skew towards the largest holdings, other popular and well-structured BDCs such as Blackstone Secured Lending Fund (NYSE:BXSL) and Oaktree Specialty Lending (NASDAQ:OCSL) do not play a major role in the overall risk and return profile of BIZD.
The fee figure is not that straightforward. The total expense ratio of BIZD stands at 11.17%, which optically seems astronomical. However, the lion’s share of this number is driven by the corresponding interest costs that are associated with external leverage assumed by the underlying holdings.
Adjusted for this component, the management fee lands at 0.4%, which is totally acceptable given the relatively risky and complex asset class that BIZD tracks.
VanEck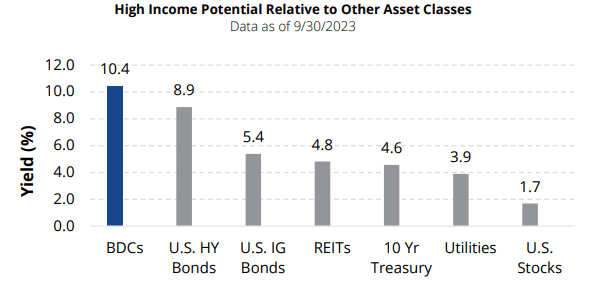
Finally, it should not come as a surprise that the yield offered by BIZD is quite attractive. Compared to other fixed income alternatives (including the junk bond segment), BIZD is able to deliver way more attractive streams of current income. This is only logical given the business model of BDCs, which provide credit in private market space to companies, which struggle to access financing via conventional means and do so on a leveraged basis.
Thesis
All and all, in my opinion, the idea of having exposure towards inherently risky asset classes through diversified vehicles makes perfect sense.
This way investors, such as those of BIZD, can avoid the assumption of additional idiosyncratic risks (e.g., company-specific and unfavorable concentration) on top of the already risky systematic position in the BDC segment. Plus, if this can be achieved at only 0.4% of the cost in the form of the annual management fee, exploring ETF structure to introduce BDC’s exposure in the portfolio is a sound idea.
With that being said, I have some issues with BIZD.
Looking at the total return performance of BIZD and contrasting it to the S&P 500, the results look acceptable.
YCharts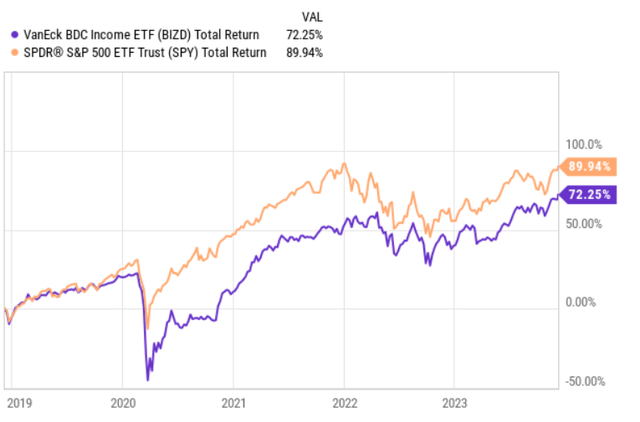
Nevertheless, if we zoom further back in history, it is clear that there has existed and still (despite major tailwinds for BDCs) exists an inherent pattern of underperformance.
YCharts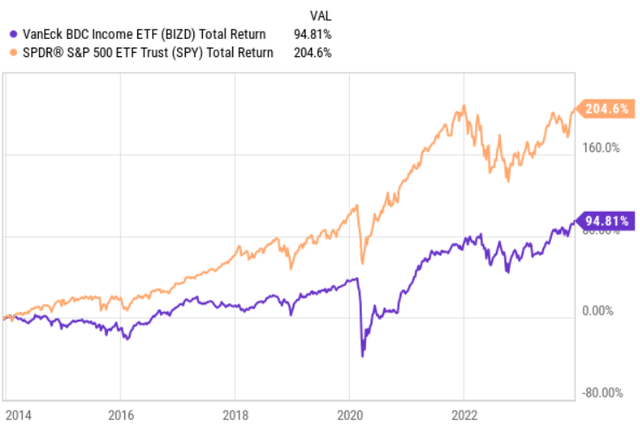
So, this comes down to the conclusion that in order to capture outsized returns, investors have to cherry-pick specific names, which embody the right fundamental dynamics in specific macroeconomic environments.
For instance, going into the monetary tightening cycle those BDCs with more leverage and a pure play exposure towards floating rate loans (in their asset portfolio) have benefited way more than the average BDC segment or other peers, which have to some extent also lent fixed rate debt and carried more defensive funding profiles.
YCharts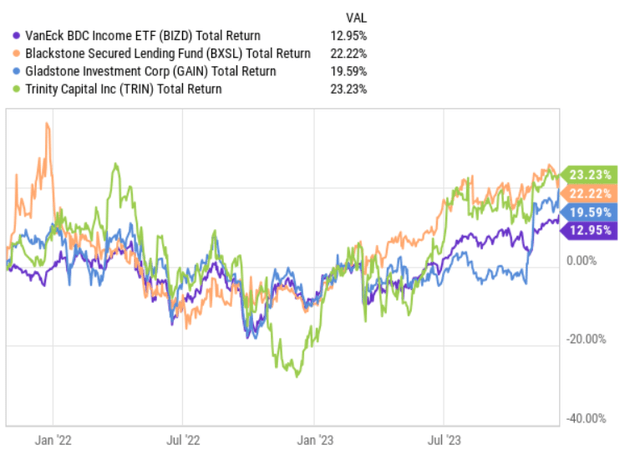
Now, however, when the odds are stacked very much in favour of decreasing interest rates already in 2024, BDCs, which have lent only floating rate debt instruments and have rather aggressive funding profiles (i.e., the balance sheet side of BDC) should perform worse compared to those names, which delivered relatively subpar results starting from early 2022.
Finally, while in the chart above it was highlighted that BDC’s yield is quite attractive and as of now it yields ~ 10.6%, compared to the overall BDC peer landscape, this level falls in the lower end. For example, Barings BDC Inc (NYSE:BBDC), Trinity Capital Inc. (NASDAQ:TRIN), and CION Investment (NYSE:CION) yield well above 12%.
The bottom line
BIZD is an inherently interesting ETF, which allows to track the overall BDC space in a more diversified manner and also helps avoid the assumption of additional idiosyncratic risks on top of the already risky nature of BDC business.
However, looking deeper into BIZD, we can quickly notice that the level of diversification is nowhere near what we can typically observe in ETF vehicles. Plus, the provided yield is not as attractive as other BDC peers are currently offering (on average).
In a nutshell, the choice on whether to invest in BIZD or not boils down to the investors’ willingness to take a more active approach and open specific BDC exposures that are more in line with the prevailing market conditions such as gravitating towards higher duration BDCs when the interest rates seem to gradually come down. If, however, do not feel comfortable in monitoring the market and adjusting their BDC holdings, BIZD offers an improved way to track the overall performance of the BDC segment (albeit, not fully optimal due to still a material concentration risk in the top holdings).
Read the full article here