


The stock performance of Blackstone Inc. (NYSE:BX) has been similar to the S&P 500 and BlackRock, Inc. (BLK) over the past six months, but inferior to that of names such as KKR & Co. Inc. (KKR) and Evercore Inc. (EVR). With more than a trillion assets under management and a market cap of $172.5 billion, Blackstone is not only the most valued alternative manager but also the most valued asset manager of all types, surpassing the valuation of BlackRock by approximately $41 billion.
Seeking Alpha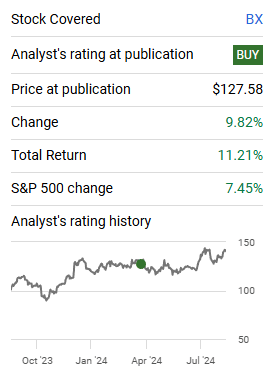
Since my last buy rating in April, the stock has gained 11.21% and outperformed the market by a few percentage points, but in this analysis, I will explain why their rise in distributable earnings and fee-related earnings valuations now makes me opt for a hold rating on the stock.
Blackstone: The First Alternative to Hit 1 Trillion in AUM
For those of you who aren’t familiar with Blackstone, they are an asset-light asset manager (meaning that they do not have their balance sheet heavily loaded with proprietary investments), that trades at 14.93x book value. Their revenue stream comes from charging management fees based on AUM or committed capital of the alternative funds they manage and from performance fees based on the success of the realized investments. From there, their largest expense is their personnel, which in times of great performance increases due to bonuses paid to fund managers. These bonus structures are implemented to align the objectives of employees, clients, and the firm. Benefitting all of them when things go right.
GuruFocus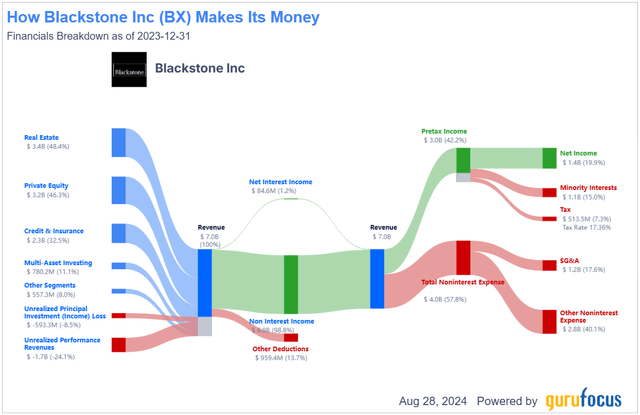
Blackstone’s operating segments are divided into Real Estate, Private Equity, Credit & Insurance, and Multi-Asset Investing. Out of that, the total AUM distribution is approximately evenly split among all segments ex Multi-Asset, with $330 billion in each segment. Nonetheless, Real Estate is the segment with the most fee-earning AUM and the one that currently generates most of the distributable earnings.
Blackstone’s Earnings, Inflows, and AUM Evolution
Fee-related Earnings
FinChat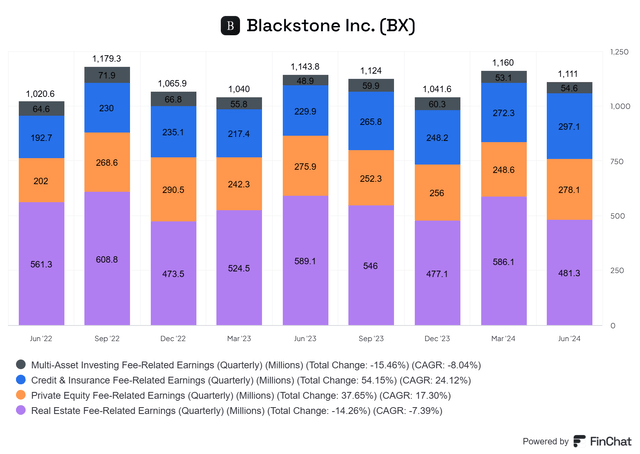
Over the quarters of the last two years, Blackstone’s fee-related earnings have fluctuated within a given range, demonstrating low growth and stability on a segment-consolidated basis. From there, Real Estate has been the main reason why FRE has only been rising at a CAGR of 4.33%. This is due to
- The Real Estate segment is approximately half of BX’s FRE.
- In a two-year timeframe, the segment had a lower FRE of -14.26%.
Nevertheless, in terms of base management fees, since Q2 ’22, the RE segment has achieved a gain of $74 million. Yet, the declining fee-related performance revenue is what explains the overall drop in the segment.
All of these declines in RE have been countered by the stunning gain from Credit & Insurance, which similar to the industry, has obtained FRE growth of 54.15% and also by the growth of the Private Equity segment at 37.65%. Multi-asset also saw declines, but its contribution is too minimal to make a material effect.
Distributable earnings
FinChat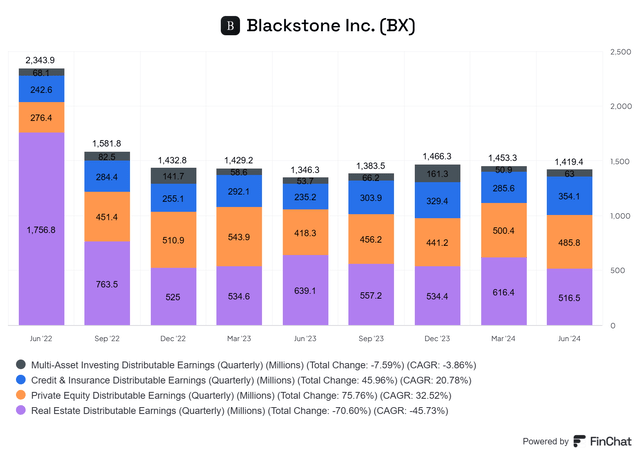
For Blackstone, carrying interest could be a large component of its distributable earnings. This is different from firms such as Blue Owl Capital Inc. (OWL) which mainly charge clients based on recurring management fees. In the case of BX, they maintain classical alternative funds structures of management fees plus performance fees above a hurdle rate that could be either soft or hard. As seen in the graph above, Blackstone’s consolidated distributable earnings are far from the level achieved two years ago. This -39.44% drop was caused by lower net realizations in Real Estate, Private Equity, and Multi Asset. Partially countered by the strong performance of Credit and Insurance in both fee-related earnings and net realizations.
Ultimately, the net realization component of an alternative asset manager is highly cyclical, and that is why the bottom line hardly grows steeply. Even more now, when Blackstone gets affected by the law of large numbers due to its size, yet, in favorable years, performance revenues could be considerably higher than base management fees. For example, in Q2 ’22, management fees were $1.497 billion, whereas performance fees stood at $2.207 billion.
Inflows and AUM
If there is something that Blackstone excels at, it is attracting new funds. The proof of that is their fast-growing AUM over the past decade. By the end of 2013, the firm was managing approximately $266 billion, and now it’s considerably a larger amount at $1.076 trillion.
Over the past two years, inflows to Real Estate have drastically contracted as investors have decreased their new contributions to that sector, to the point that Q2 ’24 was the quarter with the lowest contributions at $5.9 billion. Nonetheless, Credit & Insurance, again, has done the opposite with quarterly inflows that have remained at elevated levels over the past few quarters. And Private Equity has seen a recovery of 40.1% compared to the inflows last year.
| $ Billions | Q2 ’22 | Q3 ’22 | Q4 ’22 | Q1 ’23 | Q2 ’23 | Q3 ’23 | Q4 ’23 | Q1 ’24 | Q2 ’24 |
| Total AUM (t-1) | 915 | 941 | 951 | 975 | 991 | 1,001 | 1,007 | 1,040 | 1,061 |
| Inflows | 88 | 45 | 43 | 40 | 30 | 25 | 53 | 34 | 39 |
| Inflows / AUM (t-1) | 9.64% | 4.77% | 4.53% | 4.14% | 3.04% | 2.53% | 5.23% | 3.27% | 3.71% |
Source: Author’s Compilation | Data: BX’s Q2 Supplemental Data
On a relative basis, the quarterly inflow to AUM ratio remains far away from the unrealistic figure experienced in Q2 ’22 of 9.64%. If Blackstone was able to grow their AUM at that level each quarter, it would probably be close to the AUM of BlackRock, Inc. (BLK), but this is not the case. Yet, their current figure of approximately 3.71% is a solid ratio taking into account the Real Estate backdrop that once normalized would most likely rise again to higher levels.
During the earnings call, COO Jon Gray answered a question from Alex Blostein from Goldman Sachs about RE fundraising recovery expectations, which he answered.
“I think it is an area that’s probably a little more muted for a period of time, just because of investor caution, but we’ve seen this before. If you go back to the financial crisis, people wait for the numbers to get better, to feel better about a sector, and then they start to jump in.
I will say the tenor of the conversations around real estate has improved. I think people are recognizing that prices have reset and that it’s an interesting time to get back in. And I think one of the really important things is the differentiation of our performance.”
BX: Notably Overvalued in Key Multiples
| Q2’22 | Q3’22 | Q4’22 | Q1’23 | Q2 ’23 | Q3 ’23 | Q4 ’23 | Q1’24 | Q2 ’24 | Med. | |
| TTM FRE | 3.96 | 4.29 | 3.65 | 3.56 | 3.66 | 3.60 | 3.58 | 3.67 | 3.64 | |
| TTM DE | 6.03 | 5.81 | 5.17 | 4.59 | 4.03 | 3.91 | 3.95 | 3.96 | 3.99 | |
| Price | 83.7 | 74.19 | 87.84 | 92.97 | 107.14 | 130.92 | 131.37 | 123.8 | 140.14 | |
| Price-FRE | 21.1x | 17.3x | 24.1x | 26.1x | 29.3x | 36.4x | 36.7x | 33.7x | 38.5x | 29.3x |
| Price-DE | 13.9x | 12.8x | 17.0x | 20.3x | 26.6x | 33.5x | 33.3x | 31.3x | 35.1x | 26.6x |
Source: Author’s Compilation | Data: Seeking Alpha, BX’s Presentations
The valuation of Blackstone is without a doubt overvalued. Lower performance fees have affected the numerator of the price-to-distributable earnings ratio. Two years ago, trailing DE per share was at $6.03, now they are still lower at $3.99, but the stock price has appreciated by approximately 67.5%. Although performance fees are highly cyclical, from a fee-related earnings perspective, they are also overvalued. On a per-share basis, FRE is still lower than two years ago. Combining everything provides a current price-to-FRE at 38.5x and price-to-distributable earnings of 35.1x. Both of these are notably far away from their two-year median suggesting a 32% overvaluation on the two metrics.
Also, the current multiples are not only far away from the median, but they are the highest multiples recorded over the last two years. This coupled with a stock price that is just 7% away from hitting all-time highs, makes the multiple expansion appear to be more limited.
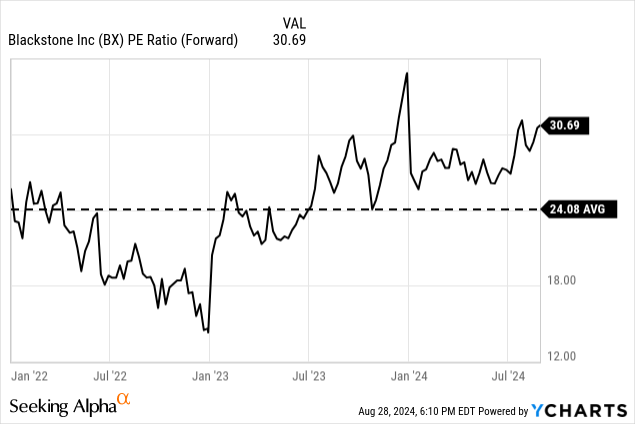
Furthermore, the forward P/E ratio of BX also stands elevated from its historical average of 24x at 31x, implying a 27.4% difference that suggests an overvaluation of the stock price.
Takeaway and Justification For a Hold Rating
Although the overall fee-related earnings of Blackstone had low growth rates over the past two years, this is mainly explained by the lackluster performance of the Real Estate segment which has been struggling to attract new inflows at the same levels as in the past. Since RE is the major component of Blackstone, it mutes the strong performance from their Credit & Insurance segment, which, as many other alternative asset managers are experiencing, is seeing tailwinds from being a less regulated industry than banks when it comes to lending.
Even though the outlook is for the Real Estate segment to normalize, their current expensive valuation at record multiples of price-to-FRE and price-to-DE limits the upside of a potential RE recovery. Blackstone is a well-run company still managed by its founder, Stephen A. Schwarzman, who founded the company 39 years ago. So, betting against them would be a losing game. Therefore, at this valuation, I will downgrade them and give them a hold rating.
Also, something to consider is that based on Blackstone’s dividend policy, they intend to pay as a dividend 85% of their distributable earnings. Based on the low net realizations currently being encountered, and based on the expected normalization of realizations, it could be anticipated that the dividend could rise sharply over the next quarters. Currently, their 2.40% dividend yield is considerably below their five-year average of 3.61%. Nonetheless, this is not enough to reiterate a buy rating.
Read the full article here