


Thesis
Broadcom Inc. (NASDAQ:AVGO) has witnessed a significant 26% rally since December 6, attributed to its better-than-expected fiscal Q4 earnings report. In this analysis, I will elucidate the factors supporting Broadcom’s potential for further growth. According to two discounted cash flow [DCF] models, the upside potential could reach as high as 34.8%, with anticipated annual returns of 17.1% over the next six years.
Upon closer examination, the second, more conservative estimate indicates a fair stock price of $1,146.98. This suggests that the current market value of $1,129.74 may already align with fair valuation. Consequently, based on these considerations, I advocate for a “buy” recommendation on Broadcom.
Overview
Business
Broadcom is a specialized company focusing on the design of semiconductors, primarily centered around CMOS and analog III-V technologies. Their market extends to selling these semiconductor-based products to companies engaged in diverse sectors, including broadband, networking, wireless, storage, and more. Despite the varied applications, the core focus remains on network and storage solutions, albeit tailored to meet the demands of numerous markets.
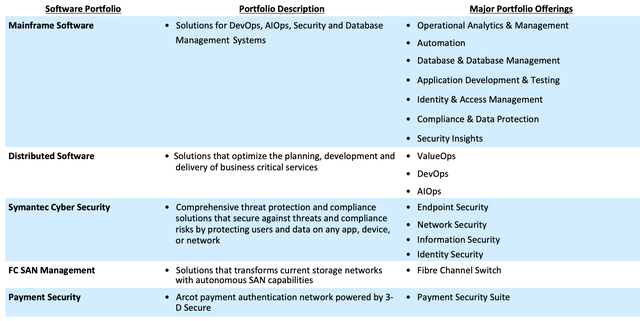
Segments (Broadcom 2022 10-K ) Segments 2 (Broadcom 2022 10-K )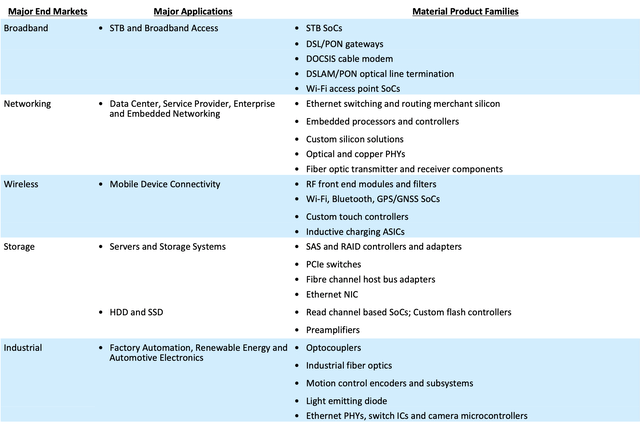
Market
Broadband
This sector requires minimal elucidation; broadband denotes a high-capacity data transport network, deployable in both residential and commercial settings. Projections indicate that the Global Broadband market is poised for a revenue growth rate of 2.28% up to the year 2028.
Worldwide Broadband Market Revenue Estimates (Statista)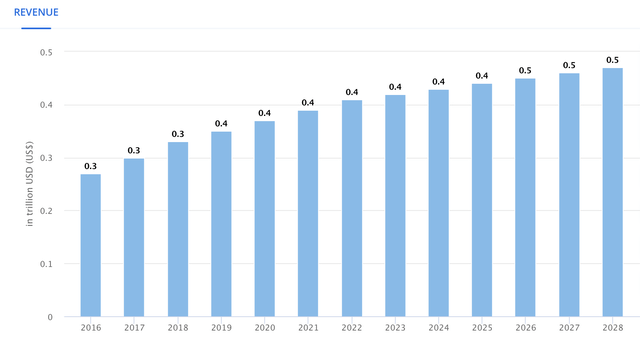
Networking
Networking involves the connection of numerous users to servers. Broadcom categorizes its networking segment into enterprise and embedded. The latter pertains to the equipment essential for constructing an enterprise network, which serves as the platform through which employees connect to access company data or programs. Notably, the “Networking Infrastructure” within the data center market is anticipated to experience a Compound Annual Growth Rate [CAGR] of approximately 6.87% until the year 2028.
Worldwide Data Center Market Revenue Estimates (Statista)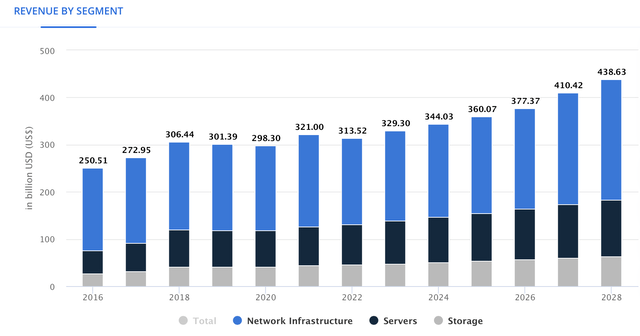
Wireless
Wireless infrastructure encompasses the telecommunication towers responsible for distributing mobile data and signals, a complexity that extends beyond surface-level observation due to the utilization of intricate components.
Forecasts indicate that the wireless infrastructure market is poised for robust growth, with an anticipated rate of 9.23% extending through the year 2032.
Precedence Research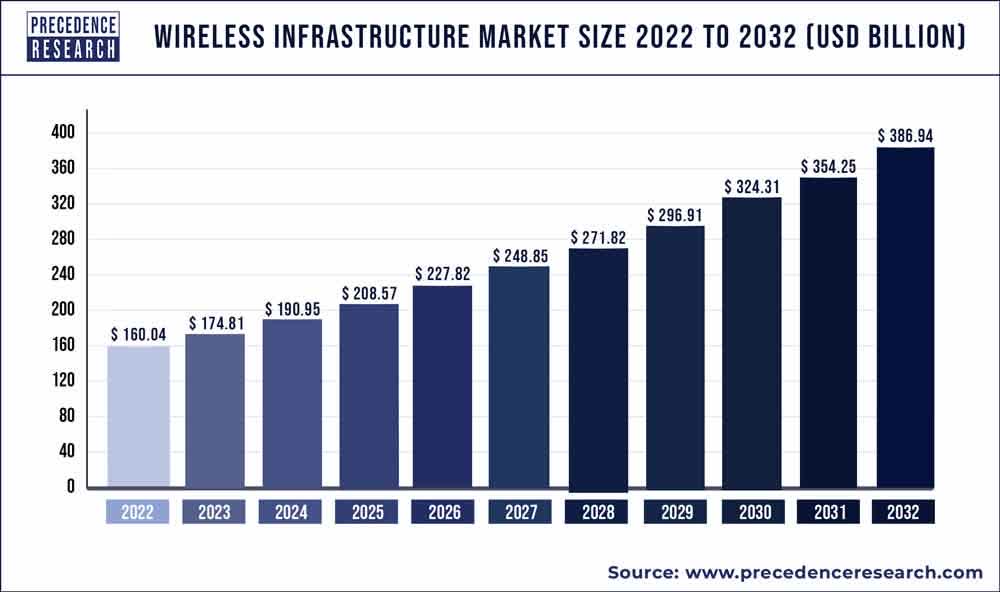
Storage
As highlighted in the table at the outset of this section, Broadcom provides both cloud-based solutions through servers and non-cloud solutions utilizing SSDs and HDDs.
Projections indicate that the global storage market is set to experience revenue growth at a rate of 5.46%.
Worldwide Storage Market Revenue Estimates (Statista)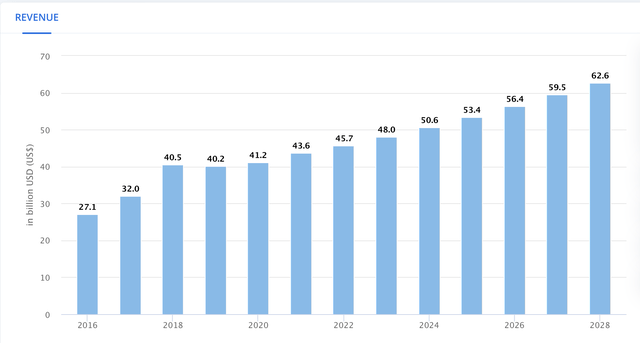
Mainframe Software & Distributed Software
Mainframe refers to data servers with the capability to process an extensive number of operations per second. This functionality is fundamental to online gaming, where the server processes not only the inputs from an individual player but also manages the information from all other players, facilitating the seamless play of online games.
Distributed software, on the other hand, represents programs that connect to multiple computers and communicate across a network. It is often categorized into back-end (servers) and front-end (software interacting with users).
Projections for the global software market anticipate a growth rate of 6.04% through the year 2028.
Author’s Calculations based on Statista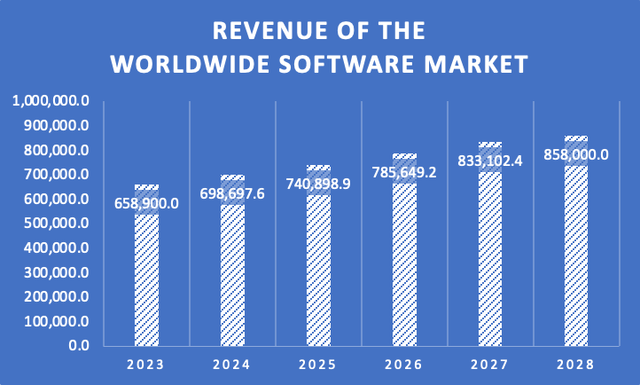
Systemic Cyber Security
The cybersecurity market is poised to witness significant growth, projected at an overall rate of 10.48%. It is essential to note that this growth can be segmented into two distinct categories: cyber solutions and security services. Among these, cyber solutions take the lead with an expected Compound Annual Growth Rate [CAGR) of 17.16% through 2028.
Worldwide Cybersecurity Market Revenue Projections (Statista)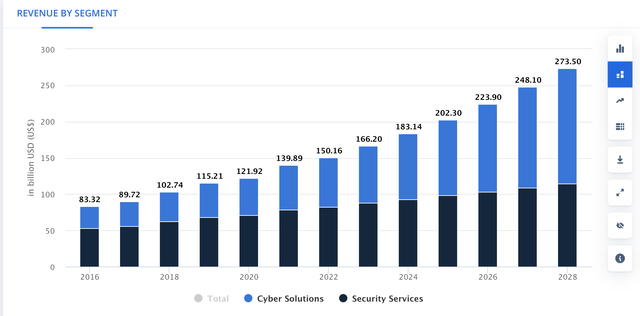
FC SAN
A Storage Area Network (SAN), as implied by its name, constitutes a network of storage devices designed for servers, facilitating access to a centralized pool of data. Broadcom’s expertise lies in fiber channels, the infrastructure that enables PCs to connect to the Storage Area Network.
Conversely, another segment of the market, Internet Small Computer Interface (iSCSI), allows for the transmission of block storage to client computers not directly connected to the SAN.
Forecasts for the SAN market as a whole project an impressive growth rate of 23.5% spanning the period from 2023 to 2029.
Payment Security
The focus of this market, as indicated by its name, centers on ensuring the security of electronic payments. In this realm, Broadcom specializes in payment authentication solutions. The anticipated growth rate for this market stands at an impressive Compound Annual Growth Rate [CAGR] of 15.44%.
Payment Security Market Size (Author’s Calculation based on Mordor Intelligence)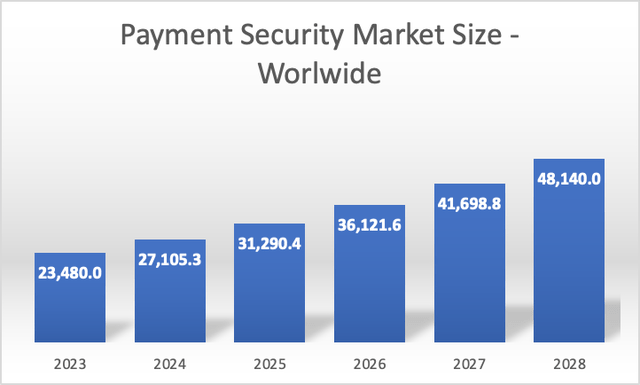
Financials
Broadcom has demonstrated robust revenue growth over the seven-year period spanning from 2017 to 2023, boasting an annual growth rate of 17.2%. The upswing in operating income is even more remarkable, averaging an impressive 85.3% annually. Notably, net income has exhibited the most formidable growth, surging at an impressive 122.1% annually. Broadcom’s margins are among the most robust in my analysis, with an operating margin of 45.94% and a net income margin of 39.32%.
Author’s Calculations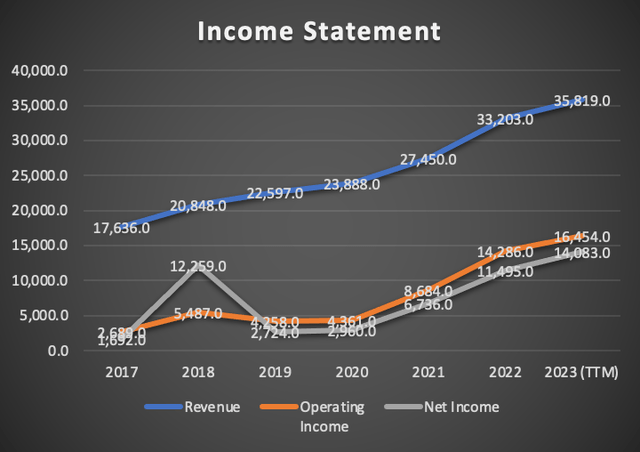
Author’s Calculations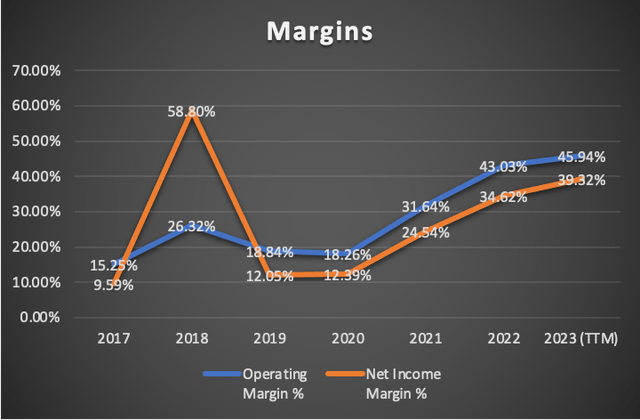
However, a less favorable aspect lies in the balance sheet, which carries $37.61 billion in long-term debt and $2 billion in short-term debt, juxtaposed against $14.18 billion in cash reserves. While this isn’t alarming, it is certainly respectable. Nonetheless, there are other companies boasting substantial cash reserves and minimal or no debt.
Author’s Calculations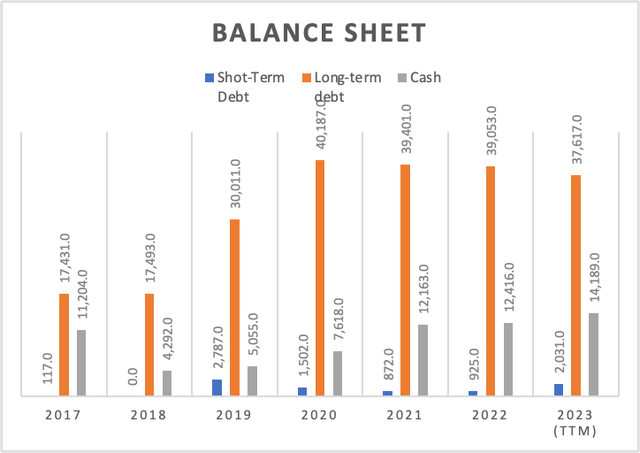
Turning to a crucial facet of any company—the free cash flow—Broadcom has seen a commendable annual growth rate of 34.9%. Remarkably, among all the companies scrutinized, Broadcom claims the highest free cash flow margin, hovering around 50.9%. It’s worth noting, however, that the pinnacle was reached in 2018 at 81.3%, attributed to a tax benefit of $8.08 billion.
Author’s Calculations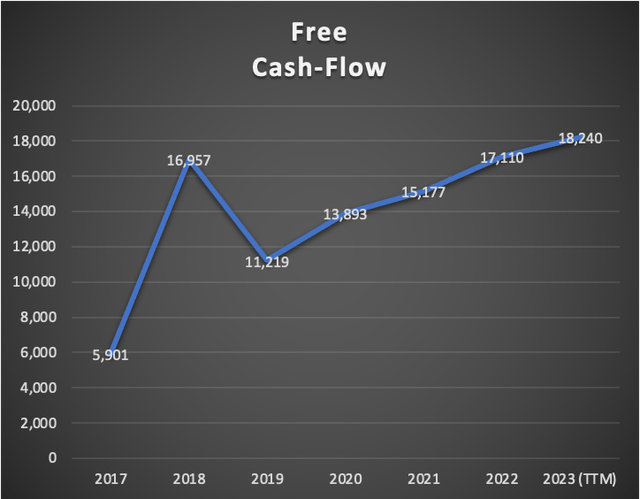
Author’s Calculations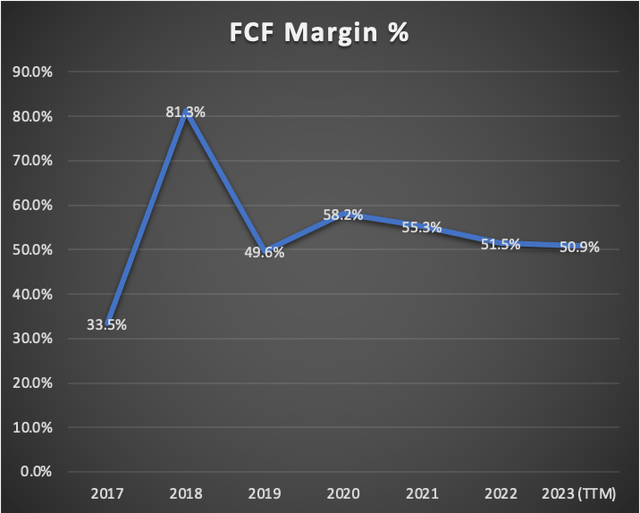
Author’s Calculations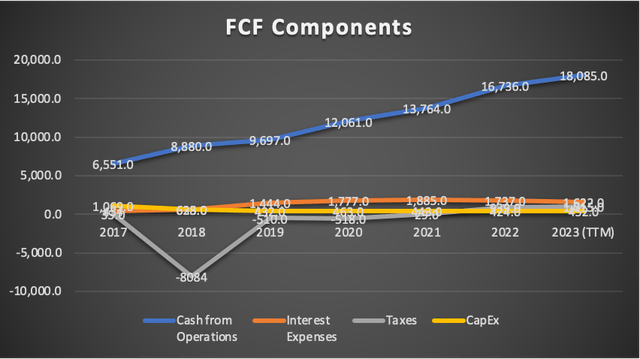
Valuation
In this valuation analysis, I will employ two Discounted Cash Flow [DCF] models to gauge Broadcom’s intrinsic value. The first model integrates Analysts’ estimates for revenue and EPS in FY2023 and FY2024, alongside forward revenue growth and the 3 to 5-year long-term EPS growth rate.
The second DCF model is rooted in the anticipated market revenue projections for each of Broadcom’s operating segments.
The provided table encapsulates all current data pertinent to Broadcom. Using this data, I will calculate the Weighted Average Cost of Capital [WACC] by factoring in Equity value, Debt value, and Cost of debt. Additionally, Depreciation and Amortization (D&A), Interest, and Capital Expenditures [CapEx] will be computed based on margins linked to revenue growth. This method ensures that as Broadcom’s revenue expands, these expenses will also increase, providing a more pragmatic and coherent projection.
| TABLE OF ASSUMPTIONS | |
| (Current data) | |
| Assumptions Part 1 | |
| Equity Value | 23,988.00 |
| Debt Value | 39,648.00 |
| Cost of Debt | 4.09% |
| Tax Rate | 6.72% |
| 10y Treasury | 3.90% |
| Beta | 1.33 |
| Market Return | 10.50% |
| Cost of Equity | 12.68% |
| Assumptions Part 2 | |
| CapEx | 452.00 |
| Capex Margin | 1.26% |
| Net Income | 14,083.00 |
| Interest | 1,622.00 |
| Tax | 1,015.00 |
| D&A | 588.00 |
| Ebitda | 17,308.00 |
| D&A Margin | 1.64% |
| Interest Expense Margin | 4.53% |
| Revenue | 35,819.0 |
Analysts’ Estimates
In this preliminary model, I will evaluate Broadcom based on current analyst estimates. Commencing with revenue, FY2023 projections indicate an expected figure of $49.7 billion, with analysts anticipating a subsequent increase to $53.64 billion for FY2024.
Revenue Estimates (Seeking Alpha)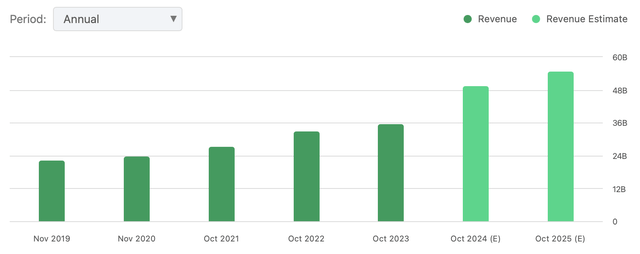
For EPS, forecasts are set at $47.02 for FY2023 and $55.79 for FY2024. When multiplied by the total number of shares outstanding, these estimates result in net incomes of $19.46B and $22.57B, respectively. This trajectory signals a significant upside of 18.65% from FY2023 to FY2024, reflecting robust double-digit growth.
EPS Estimates (Seeking Alpha)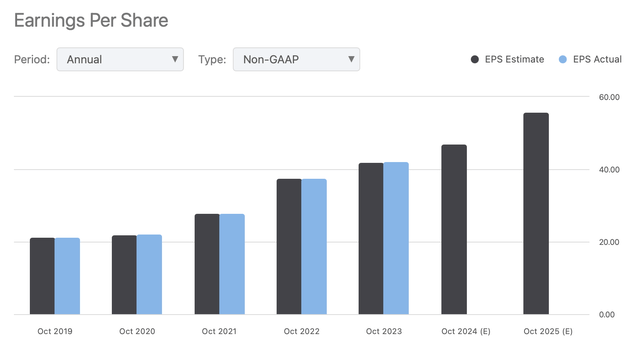
Analysts also project a forward revenue growth of 18.23%, which will serve as the basis for projecting revenues beyond FY2026. Additionally, a 3 to 5-year EPS growth rate of 14.58% is expected, providing a foundation for projecting net income in the model.
Growth (Seeking Alpha)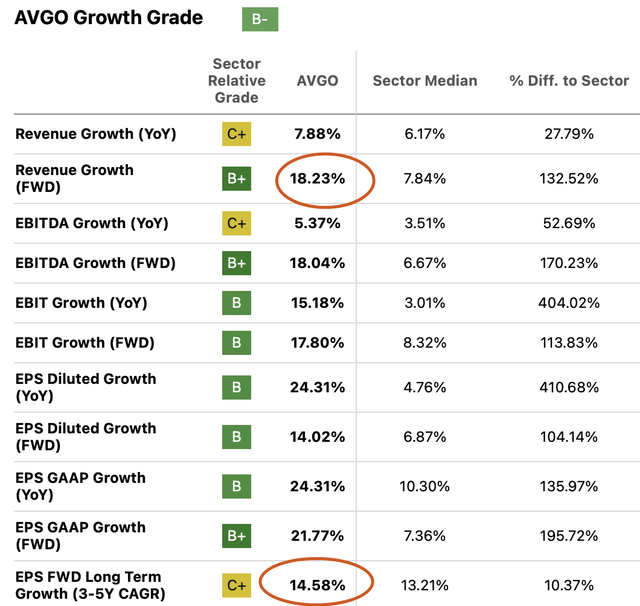
| Revenue | Net Income | Plus Taxes | Plus D&A | Plus Interest | |
| FY2024 | $49,700.0 | $19,466.28 | $20,774.95 | $21,590.82 | $23,841.39 |
| FY2025 | $54,870.0 | $23,097.06 | $24,649.82 | $25,550.56 | $28,035.25 |
| FY2026 | $64,872.8 | $26,464.61 | $28,243.76 | $29,308.70 | $32,246.35 |
| FY2027 | $76,699.1 | $30,323.15 | $32,361.70 | $33,620.78 | $37,093.97 |
| FY2028 | $90,681.4 | $34,744.27 | $37,080.04 | $38,568.65 | $42,674.99 |
| FY2029 | $107,212.6 | $39,809.98 | $42,486.30 | $44,246.29 | $49,101.22 |
| ^Final EBITA^ |
Author’s Calculations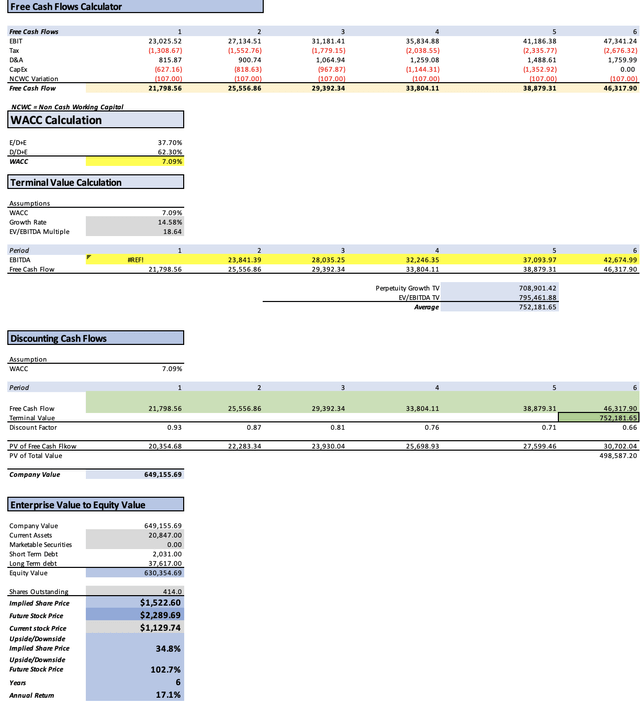
As evident, if Broadcom aligns with analysts’ estimates, it would be deemed fairly valued at $1,522.60, marking a 34.8% upside from the current stock price of $1,129.74. By 2028, when all projections have materialized, the stock is anticipated to be valued at $2,289.69, translating into annual returns of 17.1%.
My Estimates
As mentioned earlier, in this second valuation model, I will project each of Broadcom’s segments based on their respective market growth rates. Specifically, Broadband is anticipated to grow at 2.28%, Networking at 6.87%, Wireless at 9.23%, Storage at 5.46%, Mainframe software and distributed software at 6.04%, Symantec Cybersecurity at 10.48%, FC San at 23.50%, and Payment Security at 15.44%.
Unfortunately, I couldn’t find reliable estimates for the Industrial segment. Given its relatively small contribution to Broadcom’s revenue, any growth rate wouldn’t significantly impact the valuation, estimated at around a 0.1% impact.
Revenue Projection by Segment (Author’s Calculations)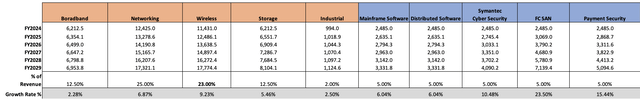
Now, with these projections in hand, I will apply a net income margin. For this purpose, I will utilize the net income margins derived from analysts’ expectations, which are as follows:
| Net Income Margin Expected By analysts | |
| FY2024 | 39.17% |
| FY2025 | 42.09% |
| FY2026 | 40.79% |
| FY2027 | 39.54% |
| FY2028 | 38.31% |
| FY2029 | 37.13% |
| Revenue | Net Income | Plus Taxes | Plus D&A | Plus Interest | |
| FY 2024 | $49,700.0 | $19,467.49 | $20,776.24 | $21,592.11 | $23,842.68 |
| FY 2025 | $53,642.7 | $22,578.19 | $24,096.07 | $24,911.93 | $27,162.51 |
| FY 2026 | $58,005.6 | $23,660.48 | $25,251.12 | $26,203.33 | $28,830.01 |
| FY 2027 | $62,848.3 | $24,850.22 | $26,520.84 | $27,552.55 | $30,398.52 |
| FY 2028 | $68,240.8 | $26,143.04 | $27,900.57 | $29,020.81 | $32,110.97 |
| FY 2029 | $74,265.7 | $27,574.84 | $29,428.62 | $30,647.76 | $34,010.75 |
| ^Final EBITA^ |
Author’s Calculations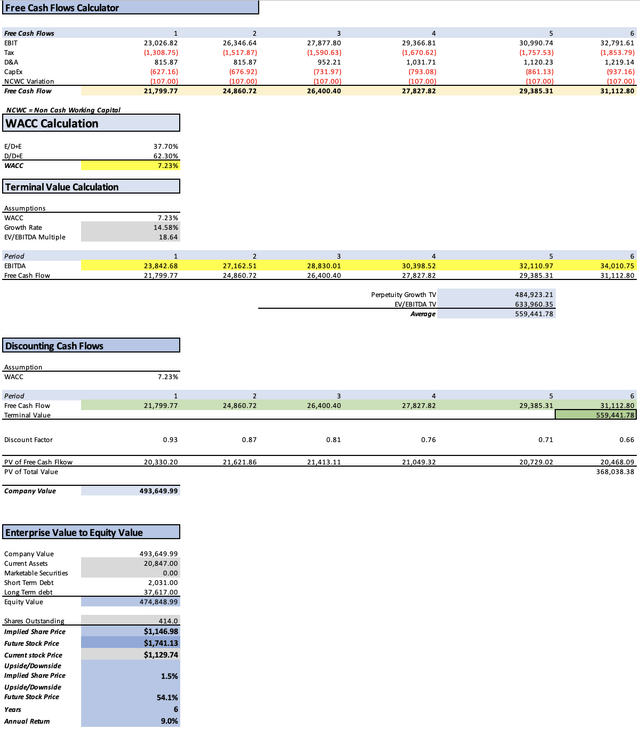
According to my estimations, Broadcom appears to be fairly valued, with a projected fair price of $1,146.96, just 1.5% higher than the current stock price of $1,129.74. The model also suggests a future price of $1,741.13, translating into annual returns of 9%.
While this model leans towards a “Hold” recommendation, considering analysts’ estimates shifts the perspective towards a “Buy.” Analysts propose a potential 34.8% jump and annual returns of 17.1%, indicating limited downside risk for Broadcom.
Risks to Thesis
The first risk factor to consider is the substantial 26% increase in Broadcom’s stock since December 6. This surge suggests a potential near-term downside as investors may opt to capitalize on profits, creating a possible more favorable entry point.
The second risk is associated with market growth projections. A significant variance exists between my estimates and analysts’ projections. If the market experiences a slowdown, the modest upside presented in my estimates for Broadcom could dissipate, raising uncertainties about the company’s ability to meet analysts’ forecasts.
The third and final risk pertains to Broadcom’s financials. Unlike companies with substantial cash reserves and minimal debt, Broadcom follows a different pattern. This financial structure may pose challenges, especially if the company intends to pursue growth through mergers and acquisitions (M&As). The absence of significant cash reserves coupled with existing debt could potentially limit Broadcom’s flexibility in undertaking strategic expansion efforts.
Conclusion
In conclusion, my comprehensive analysis of Broadcom unveils a company with impressive growth potential, underpinned by robust financial performance and strategic market positioning. The first valuation model, incorporating analysts’ estimates, indicates a fair value of $1,522.60, presenting a compelling 34.8% upside from the current stock price of $1,129.74. Moreover, the projection for 2028 foresees a stock price of $2,289.69, translating into noteworthy annual returns of 17.1%. The second model, factoring in segment-wise growth rates and utilizing net income margins from analysts’ expectations, suggests a fair price of $1,146.96, representing a modest 1.5% premium over the current stock price. While this model leans toward a “Hold” recommendation, however the thesis becomes a “Buy,” particularly considering the limited downside risk implied by my estimates and the substantial growth prospects outlined in analysts’ estimates valuation models.
Read the full article here