

Executive Summary
BYD Company Limited (OTCPK:BYDDF) (OTCPK:BYDDY) stocks are currently trading above their fair market price.
We expect BYD to significantly expand its market share in the foreseeable future, more than tripling its revenues compared to 2023 levels, poised by the aggressive price strategy, subsidised by the Chinese government, and overseas expansion despite the headwinds of Western tariffs.
Sales expansion is expected to come at the expense of the firm’s profitability, with operating margins remaining below industry levels as a consequence of low prices.
Despite the great working capital management shown in the past years, which led to reduced reinvestment needs and positive free cash flow generation, due to low profitability, in the long term we expect FCFF margins to decline considerably towards the industry average.
At current prices, our assumptions suggest that BYD’s risk-reward profile has the potential to generate a negative return (alpha 10.3%).
Source – Analyst’s compilation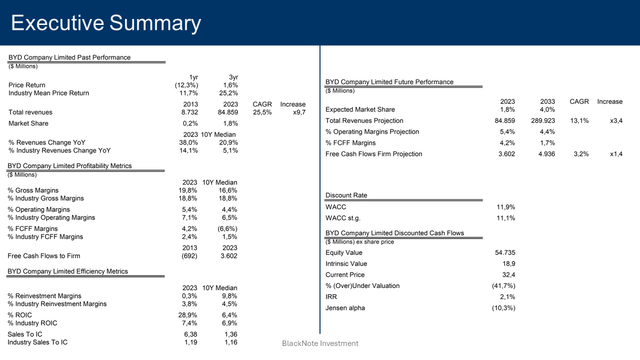
Before deep diving into the valuation, it’s worth mentioning that the Sell rating we express is NOT, and NEVER will be, an invitation to short-sell companies.
Rather, if you are not yet invested, it would be a suggestion to not buy the company at the current prices, or, if you are already invested, an invitation to re-evaluate your position in the company to check whether or not might it be worth it to cash in the profits and look for better investment opportunities.
Business Model Analysis
BYD is a Chinese manufacturing company primarily operating in the automobile industry.
BYD owes its fame – at least in Western countries – to its Automotive segment. Despite being a Chinese legacy automaker for the past two decades, the turning point for the automotive segment happened in 2022 when BYD completely shut down the production of internal combustion engine vehicles (ICEs) to solely focus on new energy vehicles (NEVs).
Nowadays, BYD’s bet has paid off, as the company become the largest manufacturer of NEVs in the world, with a product portfolio of plug-in hybrid and fully electric vehicles covering the whole spectrum of price tags, from low-end models starting at 10 thousand dollars to high-end luxury sport vehicles well above 200 thousand dollars.
However, BYD would be better described as an industrial conglomerate rather than just an automaker.
Its main operations also include battery manufacturing, as BYD is one of the leading suppliers of batteries with a customer portfolio including many of its automaker competitors like Tesla, and electronic instruments manufacturing for other original equipment manufacturers (OEM), under the BYD Electronics subsidiary.
The company is also active in the photovoltaics business and the rail and urban new energy transportation segment, developing and manufacturing dedicated means of transportation like the SkyRail and SkyShuttle to tackle the sustainable development of Chinese urban transportation.
Segment Analysis
As of the end of 2023, BYD’s total revenues stood to $84.9 billion. The Automotive and Batteries segment accounts for $68.1 billion or 80.3% of total revenues, with the remaining part coming from the Electronics segment, contributing $16.7 billion or 19.7%.
Source – TIKR Terminal
The Automotive and Batteries segment, thanks to the introduction of NEVs, strongly grew its relevance in the past few years, as back in 2019 it accounted for only 57% of total revenues.
Geographically, in 2023 revenues were derived from China by 73.4% and from overseas for the remaining 26.6%. Overseas revenues increased greatly in the past five years, as in 2019 were equal to just 16%.
Geopolitical Risks
The sluggish Chinese economy of the past years – as a result of the aftermath of the COVID pandemic and the real-estate market bubble burst – forced Chinese manufacturers to export their products to overseas markets to try to reduce the rising inventories, and BYD wasn’t an exception.
To help Chinese manufacturers overcome the severe economic downturn, the Chinese government has bestowed upon the industrial sector, including the electric vehicle segment, massive support measures.
This support comes in many forms, from subsidised loans to tax incentives, with the results being pouring money into Chinese manufacturers’ pockets, lowering production costs, and enabling them to sell goods at lower prices to attract more customers.
Ultimately, this flow of seemingly free money significantly increased the competition in the Chinese automotive market, driving down prices. However, due to the poor internal demand, Chinese automakers like BYD have seen fit to sell their low-priced goods overseas, especially targeting Europe, raising concerns of unfair competition and national security threats among Western governments.
EU’s response didn’t take long to arrive, as it imposed tariffs on Chinese imported vehicles ranging from 17.4% to 38.1% – depending on the degree of cooperation shown by Chinese automakers in admitting unfair state support – which would add to the already existing tariff of 10% on cars imported into the EU, bringing the maximum tariff to a whopping 48%.
BYD will face a tariff of 17.4%, plus the already existing 10% tax, equal to a total tariff of 27.4% on imported vehicles. It implies that a vehicle costing $30.000, after the tariff, will actually cost $38.220 to the final customers.
Although the EU aims to discourage Chinese automakers from importing their subsidised vehicles into Europe, hence protecting Western automakers’ market share, any retaliation from the Chinese government on Western-imported vehicles will negatively influence the sales of European legacy automakers in China – as China plays a crucial role in driving sales of new cars – ultimately deteriorating their market share and favouring Chinese automakers resulting in a zero-sum game.
Revenue Analysis
In 2023 BYD’s total revenues increased by 38%, a much better performance when compared to the already good y-o-y industry growth rate of 14.1%.
Over the past decade, the company’s median revenue growth rate was equal to 20.9%, again higher than the industry median growth rate of 5.1% for the same period.
Source – TIKR Terminal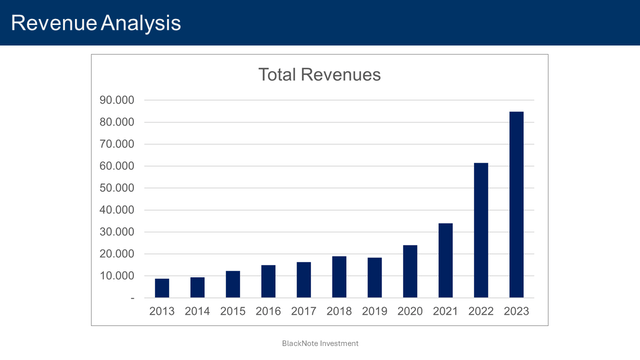
Profitability Metrics
The BYD’s operating margin was 5.4%, lower than the 2023 industry median value of 7.1%. The total operating profit was $4.6 billion, registering an increase of 49.6% y-o-y.
Source – TIKR Terminal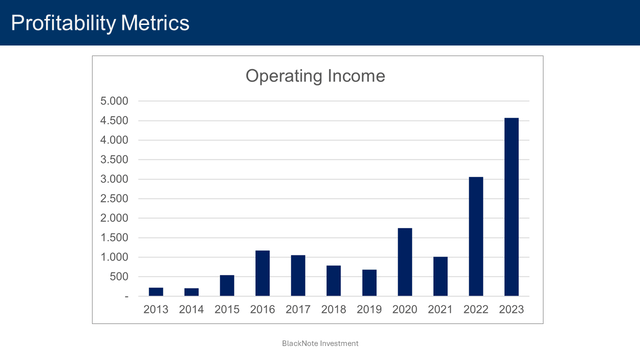
Despite a good 2023, the median operating margin is equal to 4.4%, lower than the industry median value of 6.5% registered over the past decade.
Source – TIKR Terminal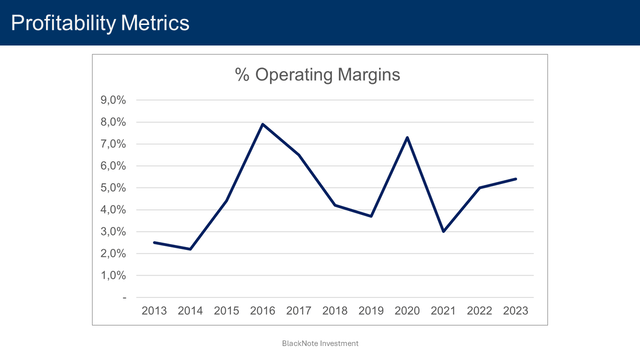
BYD’s greatest advantage, or better, the first thing customers think of when referring to the firm, is its low prices.
Although a low-price strategy – state-subsidized or not – allowed BYD to significantly increase its market dominance in the NEVs segment, in the long run, it’s unlikely to be sustainable from a profitability standpoint.
Whether BYD will be able to maintain low prices thanks to government aid, or in the occurrence of no government support, will it be forced to sell its products at lower margins to keep prices well below competitors’ levels, BYD’s operating margins are likely to remain below the industry average.
To overcome such problems, the firm will have to increase NEVs prices, but that will quickly deteriorate its main – and in the eyes of overseas customers only – competitive advantage, low prices.
Until BYD doesn’t increase the perceived value of its NEVs – similar to what Tesla and NIO are doing with their unique EV technologies – the firm’s profitability won’t witness any significant improvement.
For such reason, BYD’s operating margin is expected to remain around historical levels of 4.4% by 2033.
Looking at other measures of profitability, in 2023 the gross margin sat at 19.8%, better than the median value of 16.6%, while the free cash flow margin was 4.2% – better than the past decade’s median value of negative (6.6%).
Since 2020, BYD’s Free cash flows to the firm (FCFF) have turned positive, sitting at $3.6 billion in 2023, a significant improvement considering that from 2013 to 2020 BYD’s FCFF repeatedly registered negative values.
Source – TIKR Terminal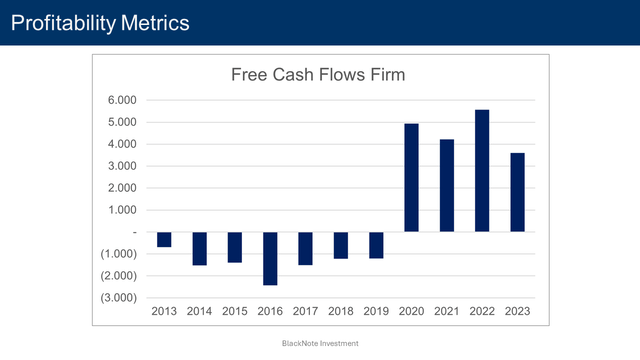
Certainly, the increase in sales and operating income registered from 2020 onwards played its part in pushing the firm toward positive cash flow generation, however, the main reason why BYD was able to turn its FCFF positive resides in significant improvement in working capital management.
In the past four years, BYD effectively reduced its cash conversion cycle (CCC), a ratio that measures the length of time it takes a firm to turn inventory investments into cash. By leveraging on longer account payable periods, it shortened its CCC reducing the reinvestment needs in working capital, which ultimately enabled the firm to maintain high net positive cash flow generation.
Source – TIKR Terminal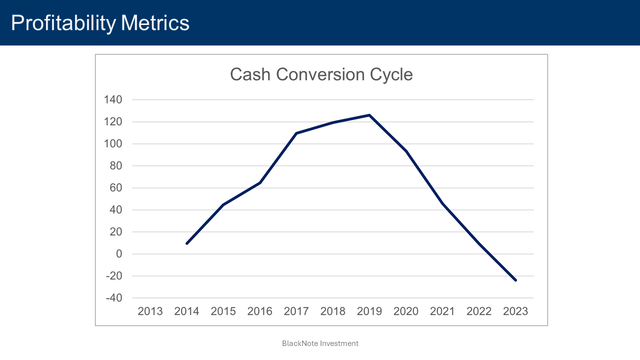
BYD went far beyond reducing its CCC, in 2023, its cash conversion cycle was actually negative, meaning that its operations were entirely financed by its suppliers, granting it longer payment periods than the period it takes for BYD to sell finished vehicles and collect cash from customers.
However, a negative CCC is unlikely sustainable in the long run, and we can reasonably expect BYD’s ability to collect cash to pivot towards the industry median value of 27.3 days.
Reinvestments & Efficiency Ratios
Despite the lower reinvestment needs of recent times, over the past decade, the median reinvestment margin of BYD stands at 9.8%, comprising net capital expenditures, acquisitions, and changes in working capital. When treating R&D expenses as capital expenditures due to their long-term value generation, this figure adjusts to 12.7%.
Source – TIKR Terminal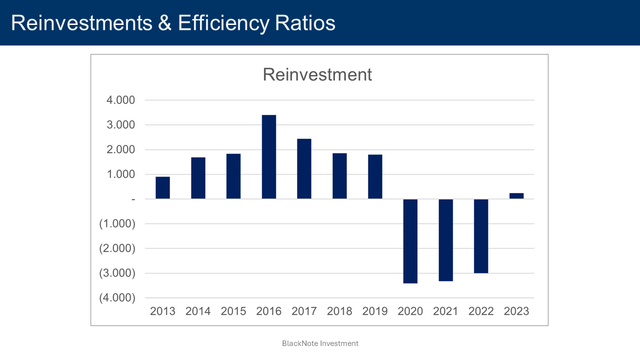
In terms of efficiency, during the period 2013-2023, BYD boasts a median ROIC of 6.4% – compared to an industry median value of 6.9% – and a sales to invested capital ratio of 1.36, higher than the industry median value of 1.16.
Source – TIKR Terminal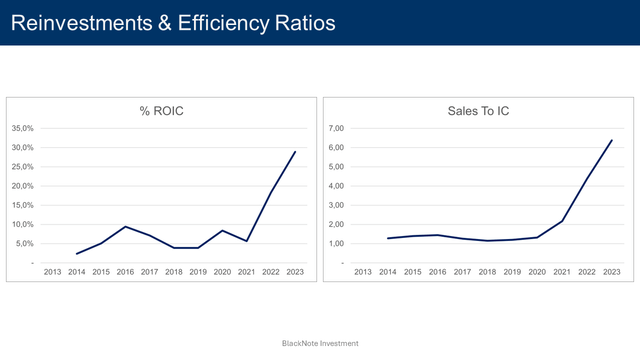
Financial Ratios
Briefly dwelling on financial ratios, as of the most recent reporting period, the net cash position registers a positive value of $4.8 billion.
Source – TIKR Terminal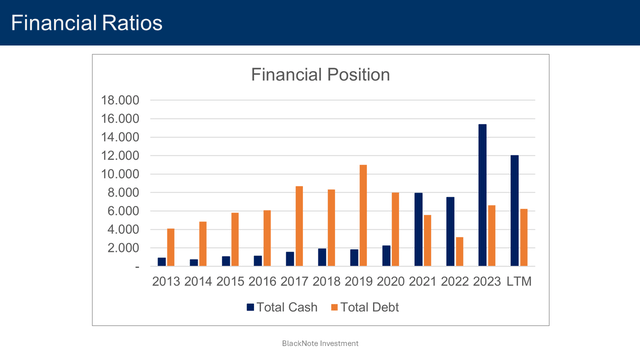
The interest coverage ratio improved from a median value of 2.9 to 15.1 as of the LTM. The current ratio and the debt-to-equity ratio instead are sitting at 0.66 and 0.29, respectively – 2013-2023 median values 0.97 and 0.94, respectively.
Market Share and Competitors Analysis
BYD, with its $68 billion in revenues derived from the automotive segment, has established a good presence in the automobile industry, considering its competitiveness, representing 1.8% of the industry’s total revenues of $3.86 trillion.
The automobile industry is highly competitive. Looking at the industry in its entirety, primary players consist of Volkswagen with a 9.2% market share, Toyota with an 8% market share, and Ford with a 4.6% market share.
Source – Analyst’s compilation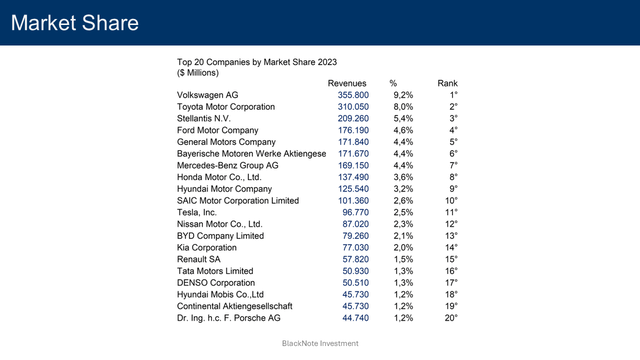
When looking at more direct competitors of BYD, it faces competition from SAIC Motor Company in the Chinese market, owing a 2.6% market share of the total automobile industry. In the EVs segment, it competes mainly with Tesla, scoring a 2.5% overall market share in the industry.
Industry Growth Forecasts
From 2013 to 2023, the industry’s revenues grew at a CAGR of 4.3%, increasing 1.53 times from $2.52 trillion to $3.87 trillion.
Source – Analyst’s compilation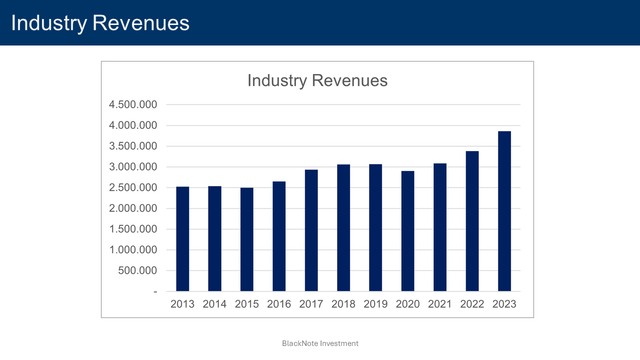
Despite lower-than-anticipated electric vehicle adoption rates, which have led legacy automakers to adjust spending, production, and product launches of new energy vehicles (NEVs), it’s clear that NEVs are the future of the automobile industry with automakers that, sooner or later, will be forced by legislators to cease the production of internal combustion engine (ICE) vehicles to promote more sustainable means of transportation.
Other than a secular switch in vehicles’ powering systems, which will boost the sale of new vehicles throughout the next decade, emerging economies – especially Asian ones like Thailand, India, Indonesia, Taiwan, and China for a lesser part – are expected to drive the demand for new cars.
To capitalize on such opportunities, over the past decade, collectively the industry registered a median reinvestment margin of 4.5%, which comprises investments made in capital expenditures, R&D, and acquisitions.
In terms of efficiency and return on investments, the automobile industry’s median sales to invested capital in the period 2013-2023 is equal to 1.16.
Combining both the reinvestments made through the past decade and the industry’s ability to generate revenues from the investments made, the 2024 expected revenue growth rate for the industry is 5.1%.
By 2033, the automobile industry revenues are expected to reach $6.07 trillion, increasing 1.57 times from the $3.87 trillion registered in 2023 at a CAGR of 4.6%. We projected the industry’s expected revenues 10 years from now, applying the expected growth rate of 5.1% and allowing it to slowly decline as the industry approaches the economy’s perpetual growth rate, represented in this case by the USD risk-free rate.
Source – Analyst’s compilation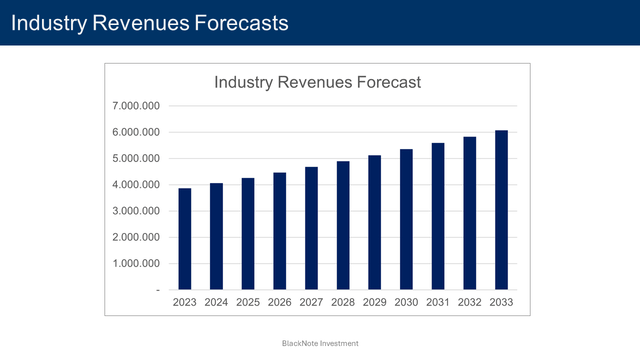
Company Growth Forecasts
Projecting BYD’s future market share, over the period 2013-2023, its revenues grew at a CAGR of 25.5% increasing 9.7 times from $8.7 billion to $84.9 billion, while its market share improved from 0.2% to 1.8%.
Source – Analyst’s compilation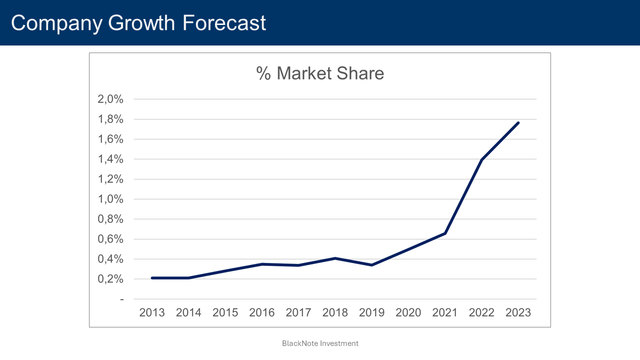
BYD’s potential catalysts for growth are to be found in its low prices, which make its new energy vehicles highly attractive to customers.
Despite the general slowdown in new energy vehicle adoption, it’s not a bold statement to say that electrification is the future of the automotive industry.
By completely ceasing the production of ICE vehicles back in 2022, BYD firmly positioned itself at the forefront of the new automotive era. As the current leader in the NEVs market, and thanks to its aggressive pricing strategies – backed by significant support from the Chinese government – we expect BYD to significantly improve its presence in the automobile industry.
The sluggish Chinese economy and the tariffs imposed by the Western economies might temporarily halt BYD’s advance into overseas markets, but it will ultimately break through, especially as the EU and US aren’t the only markets available.
Europe and the USA might be the most profitable markets, but cheap NEVs will be very attractive also to emerging Asian and South American economies, where BYD can expand.
With these assumptions, BYD’s market share is expected to reach 4% by 2033 with automotive revenues projected to reach $243 billion.
Source – Analyst’s compilation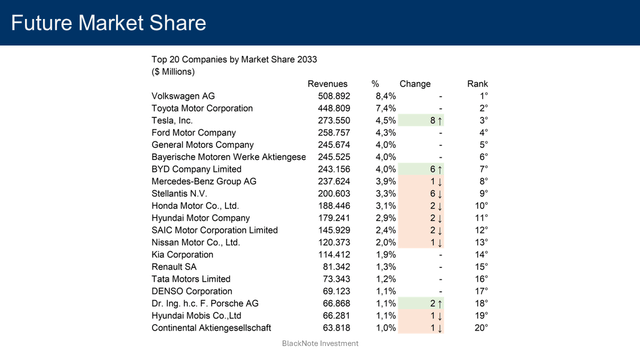
Assuming revenues from electronics manufacturing will decrease their relevance from 19.7% in 2023 to 16.1% by 2033, BYD’s total revenues are expected to sit at $289.9 billion ten years from now, representing an increase of 3.4 times from the 2023 revenues of $84.9 billion at a CAGR of 13.1%.
Free Cash Flows Forecasts
Moving on to projecting future cash flows, we expected BYD to maintain low FCFF margin in the coming years.
Despite the positive cash flow generation shown in the past four years – caused by aggressive working capital management – is unlikely that the company will be able to maintain a negative cash conversion cycle in perpetuity.
We expect BYD’s FCFF margin to approach the industry median value sitting at 1.7% by 2033, badly influenced by the lack of profitability generated by the low price strategy.
Synthesizing all underlying assumptions and strategic directions – $289 billion in revenues by 2033, 4.4% operating margin, and FCFF margin around 1.7% – BYD’s free cash flows to the firm are anticipated to swell to $4.9 billion by 2033.
Source – Analyst’s compilation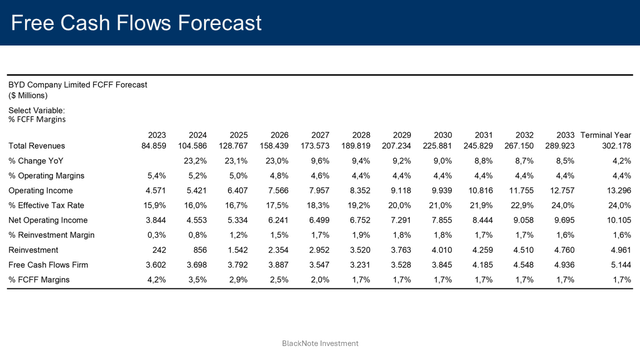
Valuation
Applying a discount rate of 11.9% for the next 10 years, and a discount rate of 11.1% in perpetuity, we obtain that the present value of these cash flows – after adjusting for debt and cash on hand – is equal to $54.7 billion or $18.9 per share.
Compared to the current prices, BYD stocks are overvalued by 41.7%.
To justify current stock prices, the implied rate of return would be equal to 2.1%.
It implies investing in BYD at the current prices would deliver a negative alpha of (10.3)% as it would generate lower returns compared to the actual return investors should expect given the assumption on cash flows and risk made so far, based on BYD’s cost of equity of 12.4%.
Source – Analyst’s compilation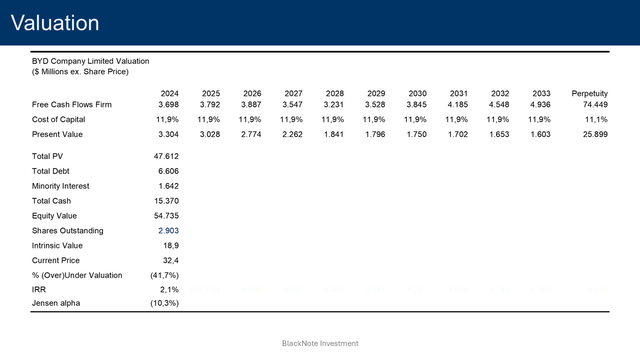
Potential Upside Catalysts
The street target for BYD – based on 30 different analyst expectations – is sitting at $36.9 per share, as of the 1st of July 2024, with 21 street recommendations expressing the rating “Buy”.
Seeking Alpha’s Quant Rating, instead, is a more conservative rating BYD as “Hold”.
The discrepancy between our valuation and Wall Street expectations is to be found in BYD’s expected profitability.
Based on the expectations published on TIKR Terminal, the street expects the company to maintain higher profitability compared to historical levels.
Source – TIKR Terminal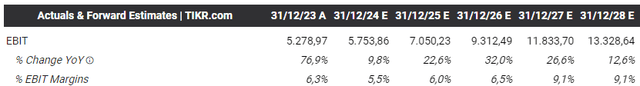
Hence, the catalyst that would potentially undermine our thesis relies on BYD’s ability to meet analysts’ expectations.
If the firm can deliver better-than-expected operating margins, BYD’s intrinsic value is likely to move upside.
Discount Rate
To determine the appropriate discount rate, we employ the WACC method, which considers both the cost of equity and the cost of debt.
The cost of equity – 12.4% – is derived using the Chinese equity risk premium of 10% – as of June 2024 – the current USD risk-free rate of 4.2%, and the company’s beta of 0.82. The company’s beta is based on the automobile industry’s unlevered beta of 0.65.
The cost of debt – 5.7% – represents the expected return demanded by debt holders and is influenced by the company’s specific risk profile and the broader market conditions. It is computed considering the current USD risk-free rate of 4.2%, the company’s default spread of 0.7%, and the China default spread of 0.8%.
With a current Equity to Enterprise Value of 93.7% and a Debt to Enterprise Value of 6.3%, BYD’s discount rate for the next 10 years is 11.9%.
As BYD enters the steady state, both the company’s beta and company default spread are expected to approach the industry’s median values of 0.82 and 0.7%, respectively.
Mature companies often have more predictable cash flows and may change their financing strategies. We anticipate BYD to adjust its Equity to Enterprise Value and Debt to Enterprise Value towards the industry median of 83.4% and 16.6%, respectively, reflecting a more typical capital structure for a stable company.
With these assumptions, the discount rate used to discount the cash flows in perpetuity is 11.1%.
Conclusion
Despite BYD is expected to more than triple its revenues in the foreseeable future, poised by the aggressive price strategy and the government subsidies, its expansion is expected to come at the expense of the firm’s profitability, which will inevitably badly affect BYD’s cash flow generation.
In conclusion, at current prices, our assumptions suggest that BYD’s risk-reward profile has the potential to generate a negative return, not representing a good investment opportunity.
BYD’s stocks will be more interesting, when and if the company shows tangible signs that its perceived value is not just low prices, but rather some unique features that will enable it to combine high growth and profitability.
However, as it is right now, only growth is not enough to justify current prices in the long term.
Editor’s Note: This article discusses one or more securities that do not trade on a major U.S. exchange. Please be aware of the risks associated with these stocks.
Read the full article here