


China stocks could be developing into one of the bigger opportunities in the market in the months to come.
I had previously written in late July “China Stocks Have Turned The Corner, Big Breakout Imminent (Technical Analysis)” that there were emerging signs of strength in the sector.
Now that the broad market has pulled back in the past few days, the relative strength in China stocks has stood out even more.
Before I dive into the technical charts, I would like to comment that being short China stocks is currently one of the most crowded trades amongst fund managers, as per the BofA Fund Manager Survey. Only the long big-tech trade is more crowded at the moment.
If China stocks were to truly take off, this could be a very painful trade for many institutional money managers, who will be forced to unwind their short bets on the sector.
Let us now review the technical charts and price action.
The KraneShares CSI China Internet ETF (NYSEARCA:KWEB) is holding firm despite the recent pullback in the broad market. The ETF is holding above its 10 day moving average, while US indices such as the S&P 500 (SPY), Nasdaq 100 (QQQ), Dow Jones Industrial Average (DIA), and Russell 2000 (IWM) have slipped below their respective ones. This is a sign of relative strength.
Daily Chart: KWEB
Tradingview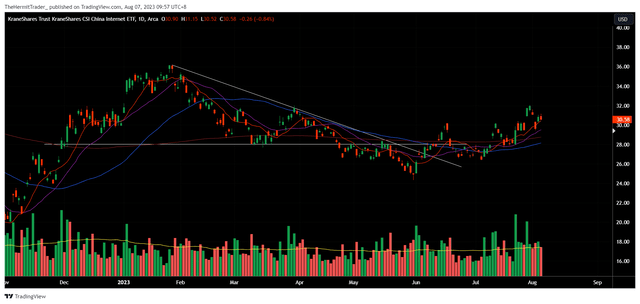
We can see that KWEB has also been building higher lows for the past 3 days, and since May in fact. Ultimately, the broader picture shows that the ETF has broken above its downtrend resistance back in June. Volume has also been increasing of late, coinciding with up-days. This likely reflects an increase in institutional buying activity, as retail is unlikely to move the dial that much. Follow the whales.
The stock that really kicked off the resurgence in the China tech sector is Alibaba (BABA), which rallied in July on news that the PBOC has decided to fine the company in response to alleged violations by Ant Financial Group. The market appears to be viewing this as a conclusion to the regulatory troubles that have plagued the company.
Daily Chart: BABA
Tradingview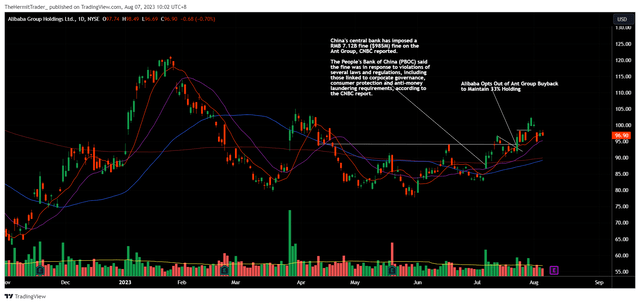
Another key bellwether is DiDi Global (OTCPK:DIDIY), which trades OTC. This stock has also been in the crosshairs of regulators, so if it has broken out of a major downtrend channel, and is now putting in a sequence of higher lows, then it is a big green flag for the sector.
Daily Chart: DIDIY
Tradingview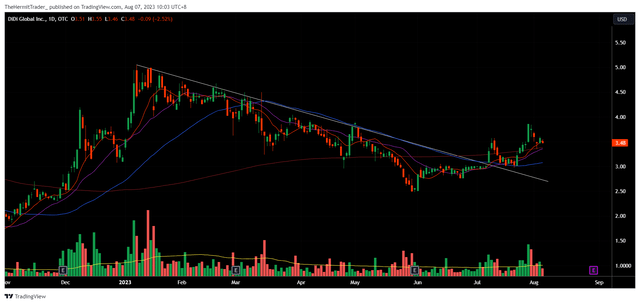
Ultimately, stocks that had run into regulatory trouble in China are now transitioning out of their downtrends. They are starting to trend higher, and I suspect the bigger explosive moves higher are around the corner.
I think a big catalyst that could support China stocks going forward is a U-turn in the regulators’ stance. Before, oversight on companies was strict, perhaps too strict. Now, there appears to be a change in heart.
Last week, the PBOC pledged more financial resources to support the private economy, leading to strength in real estate developers.
Two weeks ago, China’s Politburo meeting ended on a dovish note, with top leaders pledging to support a sluggish economy.
We may observe that bond yields in China have not risen in tandem with those in the US, Europe, Australia, Canada, etc. China’s comparatively loose monetary policy will help in supporting domestic risk assets.
Monthly Chart: China 2 Year Yield
Tradingview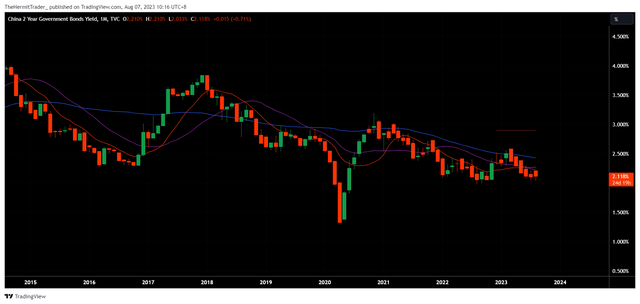
For those who would like to build exposure in China stocks, the KraneShares CSI China Internet ETF is an ideal vehicle. I covered the daily chart of the ETF earlier, and if we look at the longer-term weekly chart, we can see that KWEB is in the process of building a multi-year base. The key pivot to note is at $36, but I will be willing to enter earlier, on back of its recent relative strength.
Weekly Chart: KWEB
Tradingview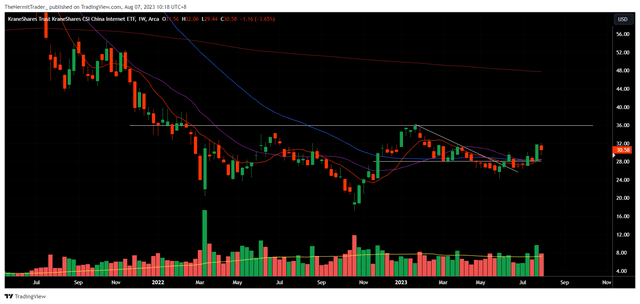
The ETF holds a diversified portfolio of technology stocks, such as Alibaba (BABA), Tencent (OTCPK:TCEHY), Meituan (OTCPK:MPNGF), Pinduoduo (PDD), and Baidu (BIDU). Some of these stocks are only listed in Hong Kong, so the ETF is a more convenient way to buy into them. My preferred sector is the technology sector, because they suffered the brunt of the regulatory oversight. Hence, they should outperform if regulations ease.
KraneShares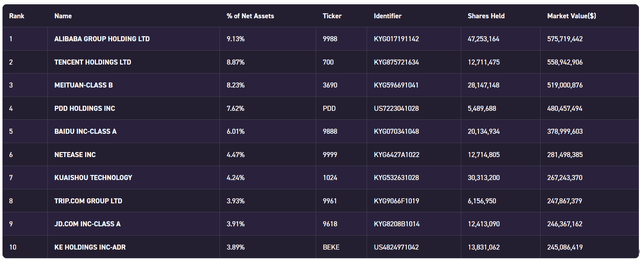
KWEB is also highly liquid, with AUM of $6.4 billion, and with 3 month average daily volume running at close to 20 million shares.
Performance wise, we may see that KWEB has suffered for the past 3-5 years, since the ETF topped in February 2021. It is now trading -70% below its highs, and there is certainly a lot of room for it to recover.
ETFdb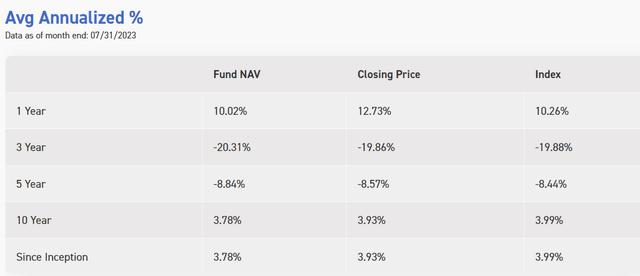
Overall, green shoots are starting to appear in the China space. The recent broad market pullback in the past few days have further illuminated the strength of the sector.
KWEB is my preferred vehicle to gain long exposure into the space, given its focus on technology stocks and high liquidity. It is in the process of building a multi-month base, and I am willing to build early exposure before it breaks the key $36 technical level. Price is likely to move much faster above the $36 pivot.
Editor’s Note: This article discusses one or more securities that do not trade on a major U.S. exchange. Please be aware of the risks associated with these stocks.
Read the full article here