

Editor’s note: Seeking Alpha is proud to welcome Brennan Basnicki as a new contributor. It’s easy to become a Seeking Alpha contributor and earn money for your best investment ideas. Active contributors also get free access to SA Premium. Click here to find out more »
After a two-year run of performance post the COVID 2020 lows, commodities broadly consolidated for over a year. However, there are renewed uptrends in agricultural and energy markets. Multiple macro drivers suggest these trends will persist and a commodity supercycle is emerging.
Given that the risk in any single commodity or sector tends to be high, the optimal way to participate in the upside of these trends is a broad-basket, diversified commodity ETF. On a risk-adjusted basis, the COM ETF outperforms available broad commodity ETFs making it potentially an ideal vehicle for participating in the commodity supercycle while protecting against downside volatility.
COM Overview
Direxion Auspice Broad Commodity Strategy Fund (NYSEARCA:COM) is a futures-backed ETF that operates under a 40-Act framework. It provides equal weighted, diversified exposure to 12 commodities, each of which can be held with either long or flat positions based on a rules-based assessment of current momentum and trend in each market. The COM ETF tracks the Auspice Broad Commodity Excess Return Index (“ABCERI”), a rules-based tactical trend following commodity index, with positioning published daily alongside performance available back to 2000.
COM has a dynamic approach to risk management. Intra-month position adjustments are made if volatility surpasses specific pre-defined risk thresholds. COM also benefits from contract roll optimization. A smart roll strategy targets adequate liquidity, minimal transaction costs and slippage, and optimal impact of contango/backwardation in futures positions. Combining these features has led to the top risk-adjusted performance (Sharpe) across multiple time frames.
COM ETF Strategy (Direxion)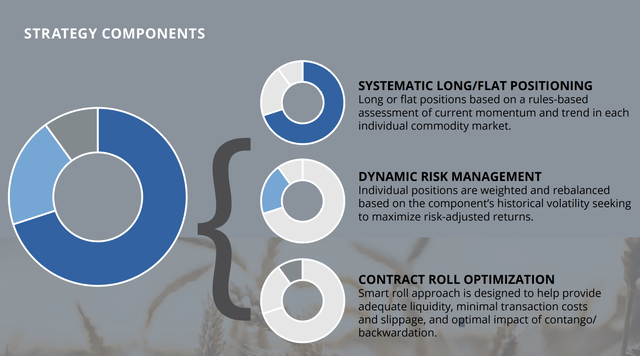
Portfolio Holdings
At the beginning of July, COM was long four of the twelve commodities the index is composed of. As per the Auspice trend-following index rules, the remaining eight commodities were not in uptrends. By avoiding the downtrends, particularly in energy, COM could sidestep the bulk of the losses other ETFs experienced in the last year.
Over the past month, five new positions have been added, which is significant for a tactical strategy that does not trade frequently. Cotton, Wheat, Gasoline, Heating Oil, and WTI Crude Oil have all been added given new uptrends in each market. Position updates can be found on Direxion’s “Daily fund Holdings” link on the product page, here.
Commodity ETF Performance Analysis
The largest broad commodity ETFs have been considered in this analysis. Excluded is any single commodity or sector-focused commodities in this analysis. Given the concentration risk, choosing any single commodity or single sector to invest can be risky. For example:
- Gold was popular post-COVID as an inflation hedge. It initially performed well as a risk-off trade in Q2 2020 but underperformed as inflation hit for the next two years.
- Copper was popular to play the green transition in H2 2020 but has been flat since.
- Energy markets were popular in 2021 and the beginning of 2022 but have traded down since the Russia/Ukraine highs in H1 2022.
I believe a broad-basket, diversified commodity ETF is a better solution for most investors, particularly since the risk in any single commodity or sector tends to be very high.
The primary metric considered here is Sharpe (risk-adjusted returns) given the high level of risk in many commodity ETFs (see Vol and Max DD in performance tables below). Higher risk can be beneficial when markets are rallying but can be challenging to hold through the down periods. Hence, particularly for commodities, Sharpe can be a useful metric.
Shaded in dark green are the top result in each metric, medium green the 2nd best, and light green 3rd. The COM ETF is the top performer in risk-adjusted returns (Sharpe) by a wide margin across time frames alongside lowest volatility and lowest maximum drawdown. FTGC and USCI have comparable returns albeit with 2-3x the risk as measured by volatility and maximum drawdown.
Commodity ETF Performance: 5-year
Three of the ETFs were launched in 2017, so five years is about the longest period that can be examined for commodity ETF performance. The COM ETF has the top metric in every category.
Top ETF Performance: 5-year July 22nd, 2018 – July 21st, 2023 (Bloomberg)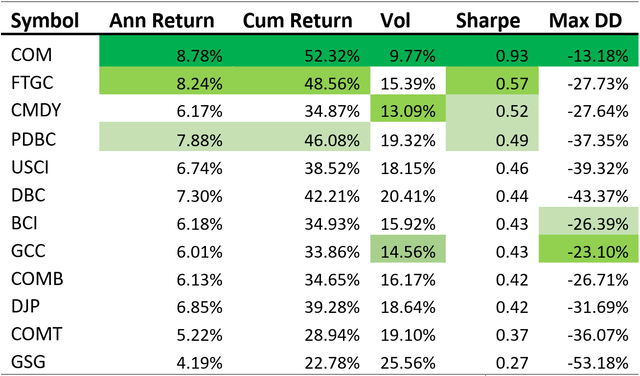
Commodity ETF Performance: Inflationary Regime (Since 2020)
In the QE environment ending 2019, where interest rates, volatility and inflation were compressed, most investors weren’t seeking commodities. In today’s inflationary environment, commodities are increasingly sought after as they are, historically, the best strategy in inflationary times. The COM ETF has achieved the top risk-adjusted performance (Sharpe) by a wide margin, the lowest risk as defined by volatility and maximum drawdown (“Max DD”), and second highest returns.
Top ETF performance: 2020s Inflationary Regime: 5-year Jan 1st 2020 – July 21st, 2023 (Bloomberg)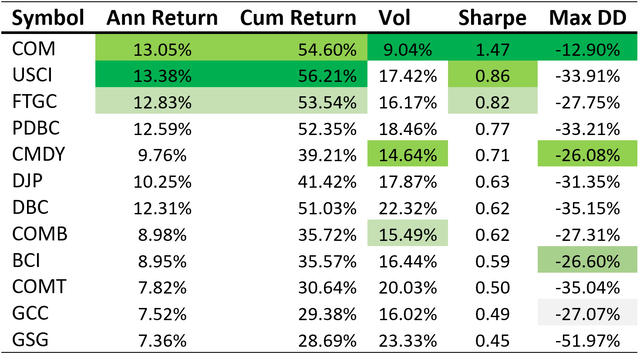
Underlying Index performance
Most commodity ETFs track an index with longer-term performance, with data available for most going back to 2000, if not longer. We can examine commodity index performance since 2000 for a longer-term comparison analysis:
- The index that the COM ETF tracks, the Auspice Broad Commodity Index, has the highest Sharpe, the second highest returns, and half of the maximum drawdown of most of the others.
- The index that USCI ETF tracks, the SummerHaven Dynamic Commodity Index, has higher returns but with 50% higher volatility and almost twice the maximum drawdown.
On the other hand, the commodity indexes the media tracks the most, the GSCI and the BCOM, the underlying of the GSG and COMB, DJP, BCI ETFs, have had rather dismal performance since 2000:
- The GSCI (“SPGSCITR” below) has returned less than 1% annualized with a maximum drawdown of almost 90%.
- The BCOM (“BCOMTR” below) has performed slightly better at 2.27% annualized, but this is still a rather dismal result, particularly when considering the high volatility and drawdown.
Underlying Index Performance: Jan 1st, 2020 – July 21st, 2023. You cannot invest directly in an index (Bloomberg)
Broad Commodity Index definitions of the above:
- ROGRTR: Rogers International Commodity Index Total Return
- SPGSCITR: S&P GSCI Total Return Index
- BCOMTR: Bloomberg Commodity Index Total Return
- SPDYCITR: S&P GSCI Dynamic Roll (USD) Total Return Index
- DBLCDBCT: DBIQ Optimum Yield Diversified Commodity Index Total Return
- SDCITR: SummerHaven Dynamic Commodity Total Return Index
- ABCTRI: Auspice Broad Commodity Index Total Return
It’s important to note that commodity indexes are published both in “excess return” and “total return,” the former not including the return on cash, and the latter including the return on cash. Some ETFs choose an excess return version to track, whereas others choose total return. The net result is unaffected because all futures-backed commodity ETFs will earn the “total return”; i.e. the index return plus the return on unencumbered cash, which is typically >90%.
In order to make an apples-to-apples comparison, the total return versions are used above for all. This is particularly relevant today because commodity futures-backed ETFs typically require a low margin to equity; the COM ETF historically is less than 10%. This means that over 90% of a COM ETF investment is invested in cash and earns a cash return on top of the commodity exposure from tracking the Auspice Broad Commodity Index (“ABCERI”).
This point cannot be understated. Today COM includes roughly a 5% additional return from cash. For the first time since the mid-2000s, prior to the global financial crisis, cash is not “trash”. Due to the cash efficiency of commodity futures, on average less than 10% of capital is required to put on the futures positions and the other 90% is typically invested in cash and cash-like instruments.
Said differently, if commodities were to just go sideways, COM would earn close to a 5% return.
Commodity Supercycle Fundamental Drivers
Many investors attribute the run up in commodities prior to the Global Financial Crisis to China and the large infrastructure investments that took place in the early 2000s. Whereas the 2000s commodity supercycle has largely been attributed to this one factor, today there arguably are many more drivers supporting an extended commodity supercycle.
Notably, after a decade of underinvestment in commodity infrastructure, COVID led to a generational demand shock driven by the Green Transition and decarbonization of the world’s economy.
Alongside further drivers noted below, as of 2023 India now has the world’s largest population and is the fastest-growing economy, having achieved 5.5% average gross domestic product growth over the past decade. India is expected to have consumption that is roughly three times larger than what China consumed in 2020 and the United Stated consumed in 2009.
Commodity Supercycle (Author)
Long-Term Commodity Returns
When most investors think of commodities, they may be influenced by recency bias and short-termism. Many of us may have experienced the commodity bear market of 2008-2019, but few were invested in the 40-year commodity bull market that preceded that. Long-term commodity returns since 1970 are quite similar to equity returns, albeit with higher volatility and drawdown. For this reason, the COM ETF is a standout as it is tactical and has minimized the high levels of risk and drawdown associated with long-only commodity indexes (see table below). COM may be more suited for long-term asset allocation, whereas the other ETFs may be more suitable as trading vehicles.
Long Term Returns: Commodities versus Equities (Bloomberg, as at July 21st, 2023)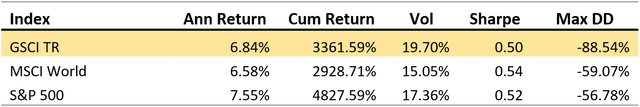
Timing & Adding Commodity Exposure
If you believe, as I do, that the commodity supercycle is in its early innings, the recent consolidation may be an attractive opportunity to add exposure. Commodities particularly, do not go straight up. The recent consolidation following two years of strong performance should be expected. If we look at the 1970s, the beginning of the last commodity supercycle, commodities returned +586.56% over the decade. Since the May 2020 bottom commodities have just returned +156.45%. See the performance comparison below.
Cycle Comparison: 1970s vs 2020s (Bloomberg, as at July 21st, 2023)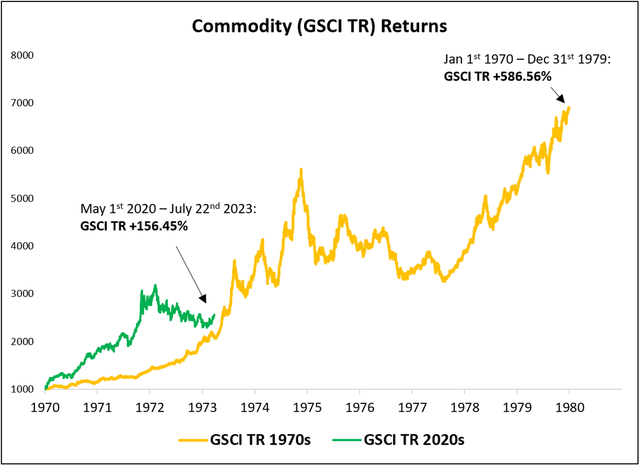
If we extend the time frame, 1970 to the peak of the last commodity supercycle at the end of 2007, we see that commodities outperformed equities for almost 40 years and did so by a wide margin.
Commodity Supercycle January 1st 1970 to December 31st 2007 (Bloomberg)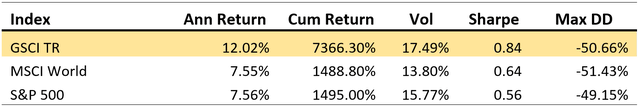
Diversified Commodity Exposure
The most followed mainstream commodity benchmark, the GSCI, can be misleading about the evolving opportunity set. This index arguably is an “economic” index versus an “investment index”. I say this because it is market-cap weighted and not really diversified, but rather heavily concentrated, particularly in energy markets (63% energy for example with 41% in WTI Crude Oil and Brent Crude Oil alone).
Some of the indexes and respective ETFs that track them offer much more diversified exposure with equal weighting to markets. Not surprisingly, those ETFs with more diversified exposure, such as COM, FTCG, and USCI, all have the highest risk-adjusted returns.
Commodity Diversification
At the risk of sounding generic, I’ll reiterate Nobel Prize-winning economist Harry Markowitz’s famous quote, “Diversification is the only free lunch in investing.” This certainly applies from a commodity ETF perspective: the concentrated GSG commodity ETF (tracks the GSCI index) has underperformed the more diversified commodity ETFs by a wide margin (see performance tables above)
Further, the diversification tenant applies to the broader investor portfolio. Most broad commodity ETFs have a very low correlation to equities and are highly diversifying. If you look at long-term returns, the GSCI has just a 0.16 monthly correlation to the S&P 500 since 1970 (source: Bloomberg). It’s hard to find investments with long track records with equity-like returns and almost a zero-equity correlation.
Particularly in this inflationary environment (which is actually much more typical than the previous QE environment), the stock/bond diversification is much lower. Those seeking stronger absolute and risk-adjusted portfolio returns could be wise to consider a broad commodity ETF, particularly given that futures-back broad commodity ETFs currently earn close to 5% from the large cash exposures alone.
Risks
COM tracks a trend-following index (ABCERI) which relies on market trends. Government intervention that artificially dampens market volatility, inflation, and interest rates, such as quantitative easing throughout the 2010s, could pose challenges for trend-following and active commodity strategies.
Although the fundamentals point to a bull market, if not a commodity supercycle, that does not mean the individual market constituents of COM will all go straight up, nor will they all go up straight up simultaneously.
As COM is diversified, at times it will underperform more concentrated commodity ETFs, such as single commodity and single sector ETFs. For long term investors, the historical performance of COM speaks for itself. But for investors who want to do their own active trading, COM may not be the best solution.
For a comprehensive overview of all risks associated with the fund, consult COM’s prospectus.
Conclusion
Commodities have had equity-like returns since 1970 but with higher risk. During the last commodity supercycle from 1970-2007, commodities outperformed equities by a wide margin.
A number of commodity indexes and ETFs have launched in the past two decades that have outperformed the headline GSCI & BCOM commodity indexes and commodity ETFs linked to them. COM has been a top performer across most metrics. Historically COM has produced the best risk-adjusted performance amongst broad commodity ETFs and may be the best ETF for long term asset allocation and exposure to the emerging commodity supercycle.
Sophisticated public pensions have begun making large allocations to commodities. Ontario Teachers’ Pension Plan (OTPP), for example, reported 12% of their portfolio in commodities in 2022 versus just 3% in 2017. Notably, this is direct commodity exposure, not resource equities such as energy and mining stocks. COM provides investors a low-cost method to gain access to similar exposure.
If you don’t have a meaningful allocation to commodities, now may be an opportune time to add exposure.
Read the full article here