


- The free cash flow focused ETF has underperformed the SP500 and selected peers.
- The strategy selects past FCF growth and does not look forward
- COWZ risks falling into value traps
Summary
The Pacer US Cash Cows (BATS:COWZ) strategy is designed to be active and limited to only 100 holdings. It focuses on the highest FCF yield stocks out of the Russell 1000. However, it has not performed better than the SP500 (SPX) and has been more volatile at times. It appears that the strategy doesn’t work as expected. I have analyzed the portfolio from the bottom-up perspective, looking at the top 50 holdings that make up 80% of the AUM.
Performance
I have compared the performance of COWZ with VanEck Morningstar Wide Moat ETF (MOAT), iShares Core Dividend Growth ETF (DGRO), and SPDR® S&P 500 ETF Trust (SPY), taking dividends into account. As you can see in the chart below, this cashflow strategy has underperformed its peers. It is worth noting that while MOAT is also a cashflow-focused strategy, DGRO is focused on dividend growth, which requires high FCF generation.
I have attached the links to MOAT and DGRO articles for reference.
MOAT: A Strategy That Generates Alpha
DGRO: Can Dividends Generate Alpha?
COWZ vs Selected Peers (Created by author with data from Capital IQ)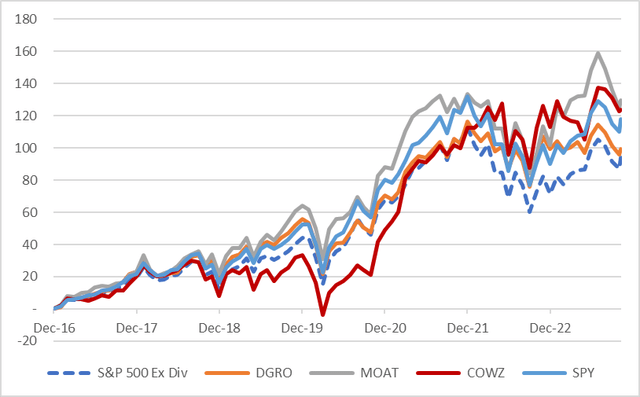
Investment Strategy
COWZ is an actively managed fund that selects the 100 largest FCF companies based on their 12-month trailing performance. The fund is rebalanced and reconstituted every quarter. High FCF yields, which is the ratio of FCF to Market Cap, are generally found in lower valuation stocks that are more mature businesses and do not spend more than their cash flow in capex or investment. This enables the companies to distribute the excess cash to shareholders.
I have analyzed several other funds with similar investment strategies such as UTG, DRGO, and MOAT. However, the primary negative of COWZ is that it selects stocks based on past performance.
COWZ Investment Strategy (Image by Pacer)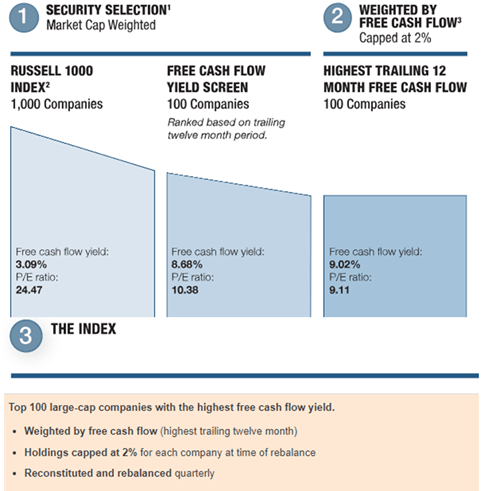
Portfolio Overview
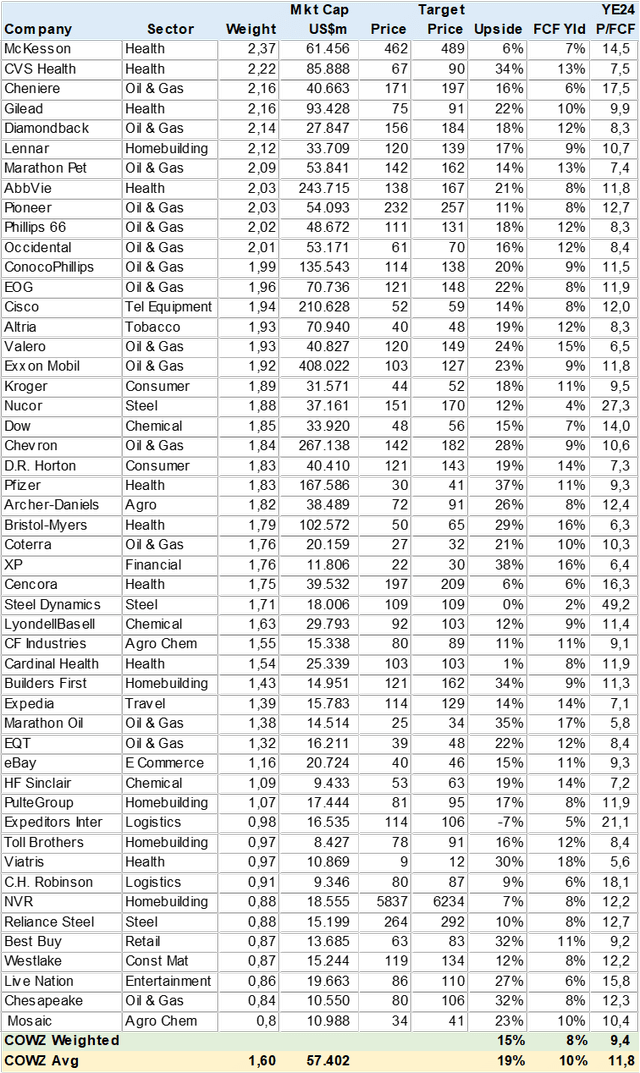
Based on the consensus price targets for the top 50 holdings that represent 80% of the ETF’s assets, I have calculated that there is a potential price upside of 15%. The forward FCF Yield is 8%, and it is valued at 9x PE YE24.
From a sector breakdown perspective, the Oil & Gas sector has the highest weight with 27%, followed by Health Care and Consumer sectors. It is interesting to note that the steel sector has a 5% FCF Yield and will likely be rotated out over the next year.
It is also evident that this strategy may invest in value stocks, but this is relative to EPS growth. However, I see a potential risk that the strategy may fall into value traps.
COWZ Sector Breakdown (Created by author with data from Capital IQ) COWZ Consensus Price Target (Created by author with data from Capital IQ)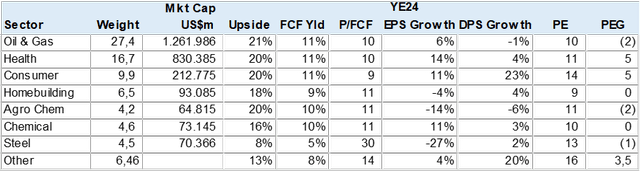
FCF Growth
I conducted an initial test to ensure that the forward FCF growth aligns with the strategic mandate. Based on the consensus estimates, I determined that the ETF has an FCF yield of 8%. However, FCF growth is volatile, ranging from -12% in YE23 to +27% in YE24 and 4% in YE25. Although the averages appear satisfactory, the current portfolio may experience market selling pressure as it approaches YE25 if the consensus is accurate.
COWZ Consensus FCF Growth (Created by author with data from Capital IQ)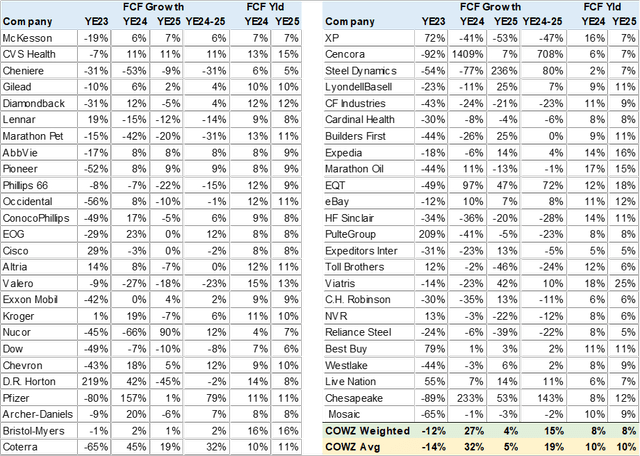
Net Debt Growth
After conducting an analysis, I have also reviewed the portfolio’s Net Debt progress over time. It is generally expected that companies generating high Free Cash Flow would not experience an increase in debt, and instead, a decrease. The consensus estimates for the portfolio confirm this, with Net Debt decreasing by 26% in YE23, remaining flat in YE24, and decreasing by 18% in YE25. Therefore, it can be concluded that the portfolio is on a path of deleveraging.
COWZ Consensus Net Debt Growth (Created by author with data from Capital IQ)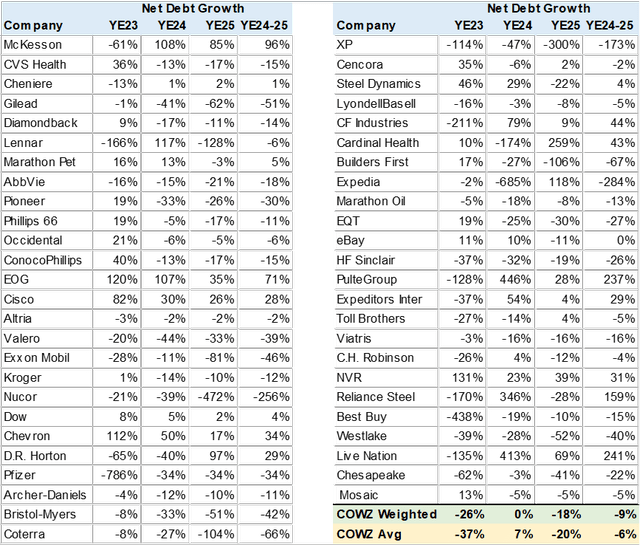
Dividend Growth
To validate the FCF generation, another test is to check the dividend growth rate and dividend yield. Although the fund does not aim for high dividends, it usually indicates companies that generate more cash than they reinvest. Based on my calculation, the portfolio has a good dividend growth rate of around 5% and a dividend yield of 2%.
COWZ Consensus Dividend Growth (Created by author with data from Capital IQ)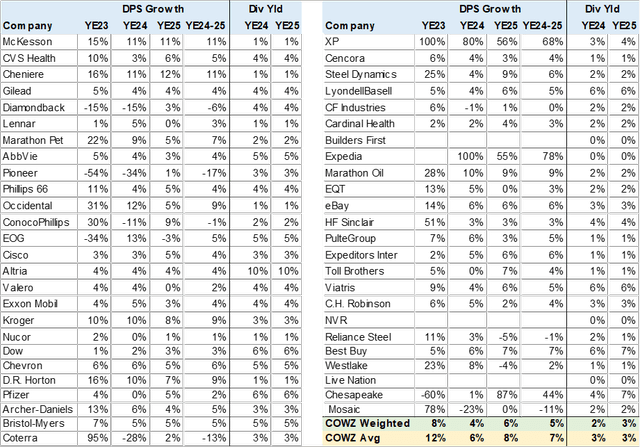
EPS Growth and Valuation
I conducted a thorough analysis of the fund’s EPS growth, calculated its PE valuation, and compared the two with a PEG (PE to EPS Growth) ratio. The primary objective was to ensure that the free cash flow yields lead to reasonable EPS growth, supported by a low valuation. This is because investing in value traps, i.e. stagnant stocks, could be detrimental to the fund’s performance.
Based on my analysis, I found that the EPS growth rate for the period of YE24-25 is only 4%, which is below average. However, the valuations are pricing this low growth at a 0.9 PEG, which provides some safety net for the portfolio.
COWZ Consensus EPS Growth (Created by author with data from Capital IQ)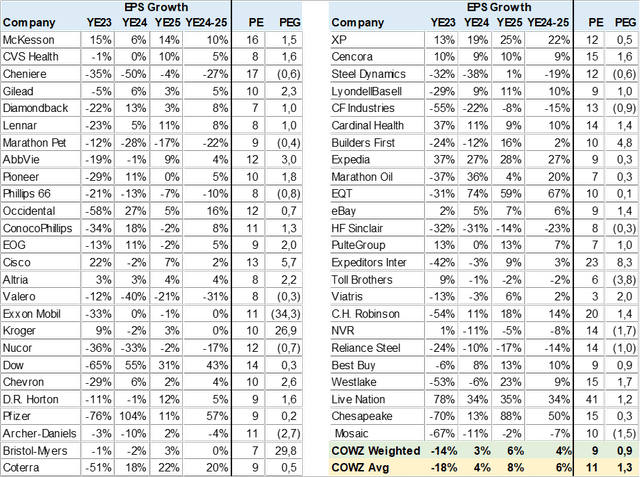
Conclusion
Based on my understanding, I do not recommend following the COWZ strategy. The reason behind this is that while the strategy focuses on investing in high free cash flow stocks, it solely relies on past performance, which may not necessarily indicate future performance. Moreover, the fund’s approach of investing only in stocks that meet certain value criteria can lead to investing in value traps. These are stocks that appear to generate free cash flow, but they do not grow, which can result in the market pricing them as mature and waiting for higher dividend payouts. Additionally, the fund has a significant concentration in the Oil and Gas sector, which presents considerable risk. However, the fund has the potential to change over time, albeit slowly, through quarterly rebalancing and reconstitution.
Read the full article here