

It has been almost a year since I covered the WisdomTree U.S. SmallCap Quality Dividend Growth Fund (NASDAQ:DGRS), with the previous note having an overall neutral tone as I appreciated its stronger performance compared to the iShares Core S&P 500 ETF (IVV) during the bear market, but quality, value, and total returns since its inception failed to impress.
Importantly, investors might suggest from its name that this vehicle focuses on dividend growth; this is not true as it instead prioritizes stocks with net profit growth prospects supported by the efficient use of capital.
Despite a rather ebullient start to 2023, with the ETF beating IVV by about 5.7% in January, it completely lost steam later, declining every single month from February to May. After a short-lived recovery in the summer, the decline continued in August-October. And while the ETF has been in the red since the previous note, the S&P 500 has delivered a healthy return.
Seeking Alpha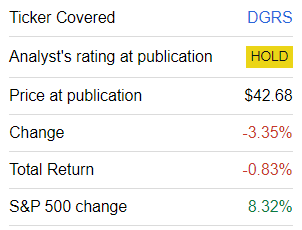
As a sizable share of the portfolio has been replaced, with the November 3 version having only a ~62% overlap with the basket I analyzed last year, I believe DGRS deserves a second look.
DGRS strategy: combining small-size, quality, and growth factors
According to the WisdomTree website, the fund’s investment mandate is to track the WisdomTree U.S. SmallCap Quality Dividend Growth Index. In a nutshell, the idea behind the benchmark is to represent the performance of small-size dividend-paying names demonstrating notable capital efficiency and having the potential to deliver earnings growth.
As described on the index webpage, the benchmark “is comprised of the top 50% of companies with the best combined rank of growth and quality factors,” taken from the WisdomTree U.S. SmallCap Dividend Index. To qualify, a company must satisfy both growth and quality criteria, namely score nicely against such parameters as “long-term earnings growth expectations” and “three year historical averages for return on equity and return on assets.” The weighting is unorthodox:
The Index is dividend weighted annually to reflect the proportionate share of the aggregate cash dividends each component company is projected to pay in the coming year, based on the most recently declared dividend per share.
The portfolio: mostly inexpensive mid-caps
As of November 3, DGRS had a portfolio of 282 stocks, mostly from the mid-cap echelon, as its weighted-average market cap of $2.28 billion illustrates (as per my calculations). The uppermost holding was CONSOL Energy (CEIX), with a 2.4% weight, partly as a consequence of the stock soaring almost 51% since the beginning of the year thanks to the record thermal coal prices.
I should say that the presence of CEIX in this portfolio is somewhat confusing, as the company does not pay a dividend at the moment as it has switched its focus to the buyback. To corroborate, let me quote the Q3 press release from October 31:
Consistent with the Company’s previously announced plan to return value to CEIX shareholders through repurchases of CEIX common stock rather than dividends, the Company is not declaring a quarterly dividend at this time.
Next, it is important to note that in order to analyze style factor exposures, I had to adjust the following tickers in the holdings dataset I downloaded from the WisdomTree website:
- I replaced Allient’s (ALNT) old ticker AMOT with the new one, which the stock has had since the corporate name change in August.
- Schnitzer Steel Industries (RDUS) has had a new ticker since September; according to the annual report, RDUS “will seek approval from its shareholders to change its legal name to Radius Recycling, Inc. at its January 2024 Annual Meeting of Shareholders.”
-
In June, World Fuel Services Corporation (WKC) changed its name to World Kinect Corporation, with the ticker INT replaced with WKC.
Below is the table compiling the chief metrics calculated using financial data from Seeking Alpha (as of November 4) and the holdings’ weights from the fund.
| Metric | 3-Nov |
| Market Cap | $2.28 billion |
| EY | 6.3% |
| P/S | 1.76 |
| EPS Fwd | 5.9% |
| Revenue Fwd | 3.6% |
| ROA | 7.1% |
| ROE | 25.1% |
| Quant Valuation B- or higher | 42.9% |
| Quant Valuation D+ or lower | 23.5% |
| Quant Profitability B- or higher | 53.5% |
| Quant Profitability D+ or lower | 11.6% |
- What we see inside this portfolio is mostly similar to its November 2022 version. At least, the mid-cap issue has not gone anywhere, with the fund’s performance still influenced predominantly by mid-cap names instead of their smaller-size counterparts, as vividly demonstrated by its weighted-average market cap. The problem, as I have a few times discussed in my articles, is omnipresent in the ‘small-cap’ ETF universe.
- The positive surprise is the earnings yield remains comfortable at 6.3%, on par with the EY of the iShares Core S&P Small-Cap ETF (IJR), which I have taken a closer look at just recently. The essential contributors are presented in the table below.
| Symbol | Weight | Sector | EY |
| Bread Financial Holdings (BFH) | 0.4% | Financials | 37.5% |
| Gray Television (GTN) | 0.2% | Communication | 36.7% |
| Arch Resources (ARCH) | 1.9% | Materials | 29.6% |
| Alpha Metallurgical Resources (AMR) | 0.5% | Materials | 26.3% |
- Exposure to stocks with strong value characteristics (B- Valuation grade or higher) is comparatively large, which is expected for a fundamentally weighted small/mid-cap mix.
Unfortunately, DGRS has a list of disadvantages investors will have to tolerate if they are thinking about buying into it at this juncture.
- There is no meaningful growth factor exposure, at all. Around 41% of the net assets are allocated to companies that are forecast to deliver smaller EPS going forward. For a fund paying attention to earnings growth, this is certainly far from optimal.
- A weighted-average forward EPS growth rate of 5.9% as a direct consequence of that is a disappointment, to say the least. And the revenue growth rate offers no solace.
- Importantly, quality is mostly adequate, but there is still something to criticize. DGRS does have overall strong capital efficiency portfolio-wise, but the share of the holdings with a B- Profitability grade or higher is too small; as I said in the previous article, I would prefer a figure in the 80s.
Dividend characteristics
DGRS is currently offering an almost 3% weighted-average dividend yield, with the top drivers shown below. I added their YTD performance to quickly elaborate on why their yields are so elevated.
| Stock | Weight | Yield TTM | YTD Return |
| Big 5 Sporting Goods (BGFV) | 0.08% | 17.67% | -35.9% |
| Camping World (CWH) | 0.57% | 10.45% | -14.3% |
| Kronos Worldwide (KRO) | 0.58% | 9.64% | -16.2% |
| SL Green Realty (SLG) | 1.60% | 9.56% | 2% |
| Medifast (MED) | 0.50% | 9.43% | -39.4% |
The fund itself has a 2.83% TTM yield.
Seeking Alpha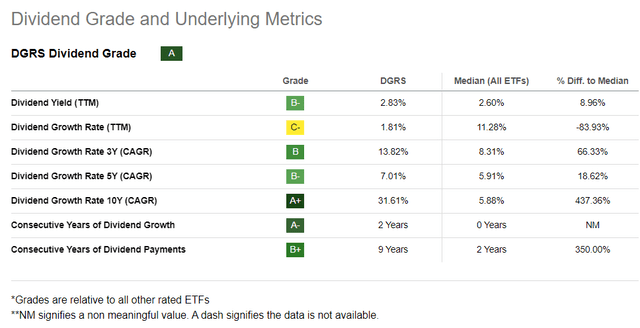
Regarding growth, the ETF also has something to offer, namely an 11.2% WA 3-year dividend CAGR, even though it does not directly target the strongest DPS growth stories.
| Metric | 3-Nov |
| Yield TTM | 2.99% |
| Div Growth 3Y | 11.2% |
| Div Growth 5Y | 5.9% |
The author’s calculations based on data from Seeking Alpha and DGRS
Smith & Wesson Brands (SWBI), a Massachusetts-based firearms manufacturer, is the key contributor, with an over 106% 3-year CAGR.
In the meantime, the 5-year rate is weaker because 1) about 9% of the holdings were reducing their dividends over that period, and 2) close to 18% have a shorter DPS history, thus their 5-year figures are zero.
Performance: nothing special
Investors seeking an ETF for steady total returns and not just income will likely be disappointed with DGRS.
| Portfolio | DGRS | IVV | DES | IJR |
| Initial Balance | $10,000 | $10,000 | $10,000 | $10,000 |
| Final Balance | $19,556 | $30,067 | $17,332 | $21,303 |
| CAGR | 6.76% | 11.34% | 5.51% | 7.66% |
| Stdev | 19.61% | 14.87% | 19.37% | 19.55% |
| Best Year | 30.79% | 31.25% | 31.39% | 26.61% |
| Worst Year | -13.12% | -18.16% | -12.83% | -16.19% |
| Max. Drawdown | -33.09% | -23.93% | -38.08% | -36.12% |
| Sharpe Ratio | 0.37 | 0.72 | 0.32 | 0.42 |
| Sortino Ratio | 0.56 | 1.11 | 0.46 | 0.61 |
| Market Correlation | 0.87 | 1 | 0.86 | 0.89 |
Data from Portfolio Visualizer. The period in focus is August 2013-October 2023 (DRGS was incepted in March 2013).
The problem here is that even though it did manage to outperform its less selective peer WisdomTree US SmallCap Dividend ETF (DES), it lagged both IVV and IJR, as well as delivered the highest standard deviation in the group.
Is it worth buying into DGRS’ dividend strategy?
In fact, deploying dividend growth strategies in the small/mid-cap universe is different from using the same approaches in the mega/large-cap league. Investors should understand that while such equity mixes might deliver dividend growth, they typically have meaningfully weaker quality and unpleasant surprises regarding volatility, let alone soft total returns. Also, distilling a pure-play small-cap basket is unachievable for most methodologies.
In sum, I reckon it is not worth upgrading the fund to a Buy today.
Read the full article here