

This article series aims at evaluating ETFs (exchange-traded funds) regarding past performance and portfolio metrics. Reviews with updated data are posted when necessary.
EDIV strategy and portfolio
SPDR® S&P Emerging Markets Dividend ETF (NYSEARCA:EDIV) started investing operations on 2/23/2011 and tracks the S&P Emerging Markets Dividend Opportunities Index. As of writing, it has 105 holdings, a distribution yield of 4.79% and a total expense ratio of 0.49%. Distributions are paid quarterly.
As described by S&P Dow Jones Indices, eligible stocks must have a minimum market cap of US$ 300 million, a 3-month median daily value traded of US$ 1 million or more, and have paid a dividend in each of the previous 2 years. The selection criteria include positive earnings-per-share (trailing 12 months), a positive 3-year dividend growth, a payout ratio below 100%, an above-median yield among eligible stocks.
Then, all selected stocks are sorted by Risk-Adjusted Yield, defined as annual dividend yield divided by volatility of monthly dividend yields over the prior 36-month period. The top 80 stocks are included in the index, and current constituents in the top 150 ranking are added by order of rank until reaching 100 constituents. If the target number is not reached, more stocks are added based on their overall rank. The index implements a modified market-cap weighting methodology, with a maximum of 3% by constituent, 25% by sector, 25% by country and 10% for all trusts. During the most recent fiscal year, the portfolio turnover rate was 71%.
The fund is mostly invested in large-cap companies (over 70% of asset value). The heaviest countries in the portfolio are Taiwan (30.5%) and China (29.1%): it represents a very large exposure to geopolitical and regulatory risks related to China. Other countries are below 11%. Compared to the emerging market benchmark iShares MSCI Emerging Markets ETF (EEM), EDIV significantly overweights Taiwan. It underweights India, Brazil, South Africa and ignores South Korea.
EDIV top countries ( chart: author; data: SSGA, iShares)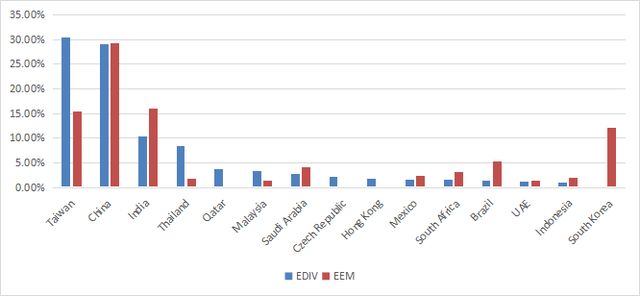
The heaviest sectors are financials (25.8%), technology (19.7%) and utilities (17.1%). Other sectors are below 11%. Compared to EEM, EDIV massively overweights utilities and real estate. It underweights mostly consumer discretionary, materials and healthcare.
EDIV sector breakdown (chart: author; data: SSGA, iShares)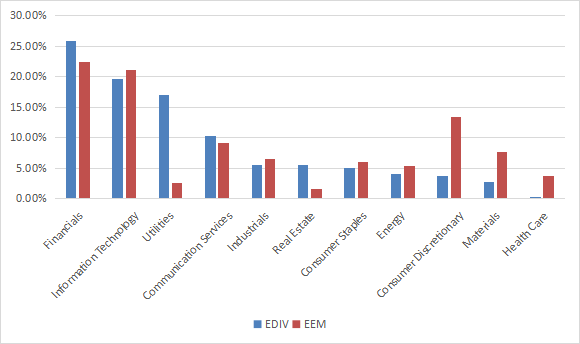
The current top 10 holdings are listed below. They represent 27.9% of asset value and the top name weighs 3.3%, so risks related to individual companies are quite low.
|
Name |
Local Ticker |
Local Currency |
Identifier |
Weight |
|
NTPC LTD |
NTPC |
INR |
B037HF900 |
3.29 |
|
POWER GRID CORP OF INDIA LTD |
PWGR |
INR |
B233HS907 |
3.28 |
|
PETROCHINA CO LTD H |
857 |
HKD |
622657906 |
3.26 |
|
HERO MOTOCORP LTD |
HMCL |
INR |
632732905 |
2.90 |
|
QUANTA COMPUTER INC |
2382 |
TWD |
614101905 |
2.88 |
|
ADVANCED INFO SERVICE NVDR |
ADVANC |
THB |
641260906 |
2.83 |
|
SAUDI TELECOM CO |
7010 |
SAR |
B12M7Q903 |
2.43 |
|
KUNLUN ENERGY CO LTD |
135 |
HKD |
634007900 |
2.42 |
|
TMBTHANACHART BANK PCL NVDR |
TTB |
THB |
636514903 |
2.37 |
|
CHINA CONSTRUCTION BANK H |
939 |
HKD |
B0LMTQ900 |
2.28 |
Past performance compared to competitors
The next chart compares 10-year total returns of EDIV, EEM, and three large-ap emerging market dividend funds:
- WisdomTree Emerging Markets High Dividend Fund (DEM),
- iShares Emerging Markets Dividend ETF (DVYE),
- Schwab Fundamental Emerging Markets Large Co. Index ETF (FNDE).
EDIV is second to last.
EDIV vs. Emerging Market ETFs since inception (Seeking Alpha)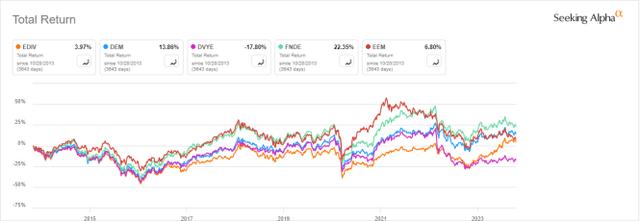
However, it has been the best performer in 2023 to date:
EDIV vs. Emerging Market ETFs, year-to-date. (Seeking Alpha)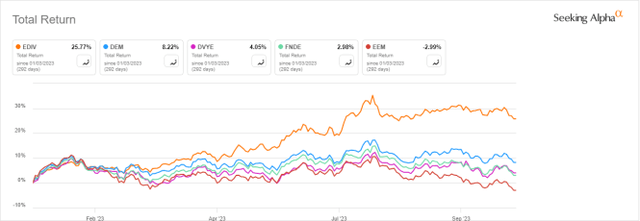
Excluding dividends, EDIV has suffered a decay of 43% since inception, as reported on the next chart.
EDIV share price (Seeking Alpha)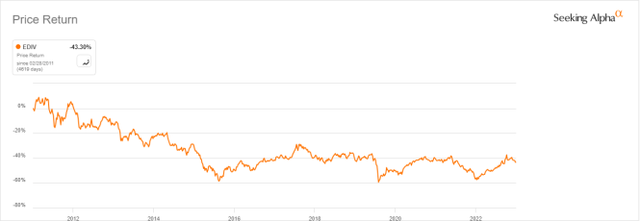
The sum of annual distributions has decreased by 53% in 10 years, from $2.53 per share in 2012 to $1.19 in 2022. To make it worse, the cumulative inflation has been about 29% in the same time, based on CPI.
EDIV distribution history (Seeking Alpha)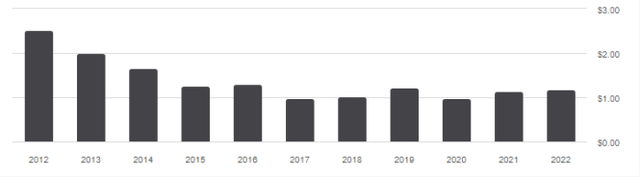
Takeaway
SPDR S&P Emerging Markets Dividend ETF (EDIV) holds about 100 dividend stocks from emerging markets. It is well-diversified across holdings and sectors, but it is overweight in Taiwan and China. Therefore, about 60% of asset value is directly exposed to geopolitical and regulatory risks related to China. Despite the profitability and stability criteria of the screening process, EDIV has underperformed its benchmark and several competitors in the last 10 years. Moreover, distributions have been cut by more than half in the same time, and the share price has lost 43% since inception. The only positive point is a good performance relative to peers in 2023.
Read the full article here