

In February this year, I wrote an article about Enterprise Products Partners (NYSE:EPD) and Enbridge (ENB) comparing these two midstream players side by side. While the conclusion was that both players are attractive investment choices for yield-seeking investors, EPD was my preferred choice.
There were three distinct reasons why I picked EPD over ENB:
- EPD had an upper investment grade credit rating (while in ENB’s case it was at BBB territory) and lower leverage profile.
- The growth CapEx ambition was more balanced for EPD sending a clear signal that the capital structure will remain robust going forward.
- EPD traded at better valuations (e.g., EV/EBITDA of 10.03x vs 13.4x for EPD and ENB, respectively).
Since the publication of this article, both ENB and EPD have managed to generate higher total returns than the MLP market.
Ycharts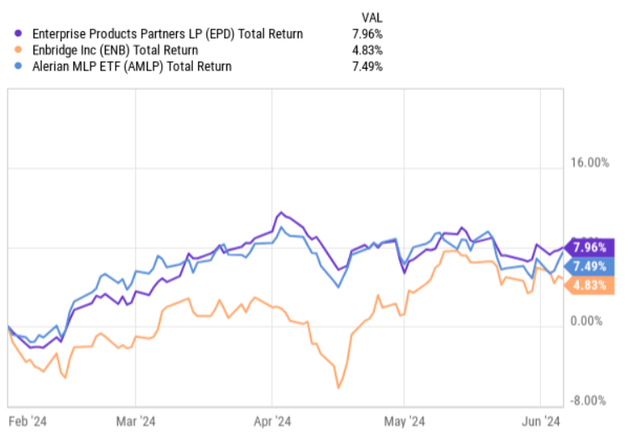
Last month I circulated a separate article on ENB – Enbridge Is Stepping Up Its Game, It’s Time To Invest – outlining my bullish view and elaborating on the Q1 dynamics that support the process of increasing allocations in ENB.
With that being said, looking at Q1, 2024 earnings report and the focus going forward, EPD still remains my favorite pick in the MLP / midstream space.
Let’s now dissect the recent financial dynamics of EPD and contextualize them with the overall bull case of EPD.
Thesis review
The Q1, 2024 resulted in a solid performance just as for most of the MLPs out there. The total gross operating margin increased by ~7% compared to the Q1, 2023. The increase in margin was driven by the accretive growth CapEx coming online as well as better spread capture.
Importantly, adjusted cash flow wise, EPD registered a growth of 6% over the comparable time period with the total quarterly cash generation (cash flow from operations before changes in working capital) now lading at $2.1 billion.
On a free cash flow basis, the rate of change dynamic was similar, where Q1, 2024 ended with just over $1 billion in FCF generation, which reflects the actual capital that is available for distributions, buybacks and balance sheet optimization after making the necessary CapEx.
In terms of the quarterly CapEx spend, EPD allocated $875 million in growth projects and $180 million in asset maintenance, which is a rather conservative figure in the context of the underlying earnings.
The positive thing here, which is also one of the key reasons why EPD is, in my opinion, one of the most defensive MLP players, is the communicated trajectory on the CapEx spend front. As we can see in the chart below, EPD expects the growth CapEx for 2024 and 2025 to be in the range of $3.25 billion to $3.75 billion. On top of this, the maintenance CapEx or sustaining CapEx is estimated at $550 million, which together add up to circa $4 billion in the total CapEx spend for this and the upcoming year.
EPD Q1, 2024 earnings supplemental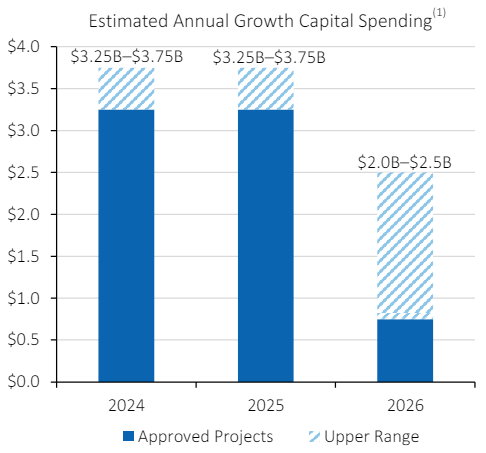
Assuming an annualized cash generation based on Q1 results, EPD’s CFO (before working capital adjustments) lands at ~$8.8 billion, which is more than enough to cover the investments and distribute the quarterly dividends. For example, looking the TTM payout ratio of adjusted cash flow from operations we arrive at 56% – i.e., a very conservative level.
Here it is also worth underscoring that after 2025, the CapEx plan is set to shrink reaching a range of $2.5 – $3 billion (including maintenance CapEx). Given this and the fact that a significant portion of EPD’s cash flows are indexed to periodic bumps (or escalators) and that there will be an incremental cash generation from the executed growth projects, it is rather inevitable that there will be an even higher volume of cash flows available for distributions.
Randy Fowler – Co-Chief Executive Officer – provided a nice color on this during the most recent earnings call:
So, I mean you have seen us do $200 million or $300 million here over the last few years. I mean if there was a market dislocation, we have got the flexibility to do more. And then certainly, here in 2024 and 2025, we are looking at growth CapEx $3.25 billion to $3.75 billion range. I think once you get back out to 2026 2027, and if we are in a more of what I would say normalized CapEx range $2 billion, $2.5 billion, then we will have a lot more flexibility to do buyback then as well.
With that being said, during Q1 EPD still did some tangible share buybacks, purchasing circa 1.4 million units in the market for $40 million, which now on a TTM basis results in $211 million of total buybacks.
Finally, even after executing the buybacks, channeling relatively sizeable capital into growth CapEx and servicing the quarterly distributions (which have now increased by 5.1% relative to Q1, 2023), EPD’s balance sheet still remains robust at a leverage ratio of 3.0x.
Furthermore, it is not only the leverage profile, which is rock-solid, but also the debt maturity profile is quite favorable, where EPD has no borrowing coming due this year and only $1.1 billion in 2025, which, theoretically, could be retired by using the underlying cash flows.
The bottom line
In a nutshell, EPD is an excellent investment choice for investors, who seek above average dividend yield that is underpinned by strong cash flows, where the risk of a dividend cut is extremely distant.
The key advantage of EPD remains intact, which is the Company’s strategy to grow in a sustainable and de-risked manner without sacrificing the quality of the balance sheet.
One might argue that the drawback from this is the potential opportunity costs related to maximized growth prospects. While this might be true, in my case, I am totally fine with foregoing part of the upside (via price appreciation or higher dividend increases) to receive enhanced income stability and predictability on an already high yielding dividend.
Given the aforementioned reasons Enterprise Products Partners remains a buy for me.
Read the full article here