


Written by Nick Ackerman, co-produced by Stanford Chemist
With the latest market volatility, Eaton Vance Tax-Advantaged Global Dividend Income Fund (NYSE:ETG) has seen some pressure, potentially making it look more enticing for a longer-term investor. This closed-end fund focuses on holding a mostly equity portfolio with a global tilt. The fund continues to trade at a deep and attractive discount.
With the recent market volatility, ETG took quite a meaningful dip as well. However, just like the market made a swift recovery, ETG followed. The fund’s total returns have been fairly attractive since our last update.
ETG Performance Since Prior Update (Seeking Alpha)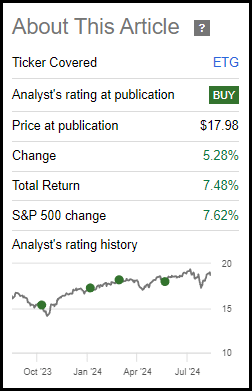
Being a leveraged fund, investors may take more caution if they are expecting this market volatility to turn into a deeper or more prolonged market sell-off. That said, I’m still comfortable with the valuation here and keeping ETG in my portfolio as a long-term position.
ETG Basics
- 1-Year Z-score: 1.08
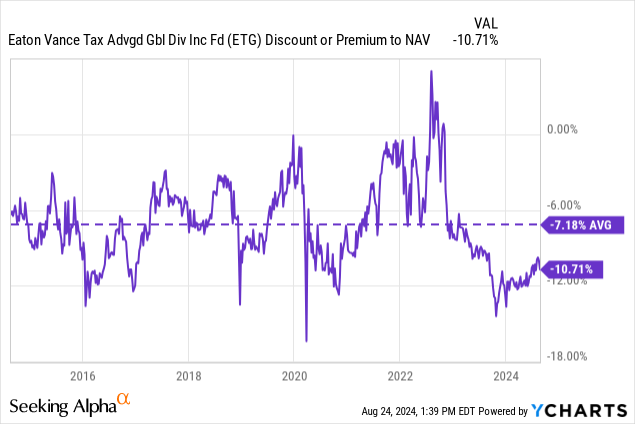
- Discount/Premium: -10.71%
- Distribution Yield: 8.20%
- Expense Ratio: 1.13%
- Leverage: 19.51%
- Managed Assets: $1.897 billion
- Structure: Perpetual
ETG invests “primarily in global dividend-paying common and preferred stocks and seeks to distribute a high level of dividend income that qualifies for favorable federal income tax treatment.”
More specifically, the investment strategy is:
Under normal market conditions, the Fund invests at least 80% of its total managed assets in dividend-paying common and preferred stocks of U.S. and foreign issuers that the Fund’s investment adviser believes at the time of investment are eligible to pay dividends that qualify for federal income taxation at rates applicable to long-term capital gains. The Fund may invest in preferred stocks that are rated below investment grade. The Fund may also invest a portion of its assets in stocks and other securities that generate fully taxable ordinary income, including up to 30% of its total assets in securities rated below investment grade.
Under normal market conditions, the Fund will invest (i) at least 25% of its total managed assets in the securities of U.S. issuers; (ii) at least 30% of its total managed assets in securities of non-U.S. issuers, including issuers located in emerging market countries; and (iii) in issuers located in at least five different countries (including the U.S.).
In the latest semi-annual report, the fund’s expense ratio came down a touch from the 1.18% we saw at the end of fiscal 2023. When including leverage costs, the fund’s total expense ratio came to 2.63%.
Discount Remains Attractive
ETG’s discount has narrowed some since our last update, even with some broader market volatility. Generally, when markets start to become more volatile, closed-end funds will move to wider discounts. For ETG, it seems that investors aren’t ready to push it to an even wider discount from its already attractive level.
In fact, the discount has narrowed a touch since our prior update. Over the long run, though, the fund’s discount is still looking wide historically, which is what I believe makes ETG a rather attractive choice.
I believe another attractive characteristic of the fund is that it offers some global exposure, which can help bring more diversification to an investor’s portfolio. Several of the top names are still the mega-cap tech names that most investors are familiar with, but North American exposure comprises ~58% of the fund.
For what seems like ‘forever’ now, U.S. equities have outpaced their global peers. Holding global equities in the last couple of decades would have been a drag on an investor’s portfolio. However, it might shock some investors to know that isn’t actually the case all the time, and it hasn’t really been forever. There have been several periods of time where it was the U.S. market that was the laggard.
U.S. Vs. International Outperformance (JPMorgan)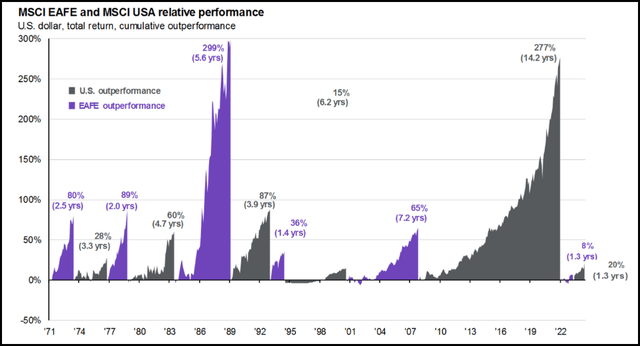
Of course, just because global equities have outperformed in the past doesn’t mean that they can do so again in the future. It could be possible that U.S. equities just continue to be the winning place to put dollars to work. On the other hand, one could consider that valuations outside the U.S. aren’t as stretched on a relative basis.
That could be a catalyst to see U.S. equities underperform, even if it is just seeing the historically high multiple come down and international equities move flat from here at current valuations.
U.S. Vs. International Valuations (JPMorgan)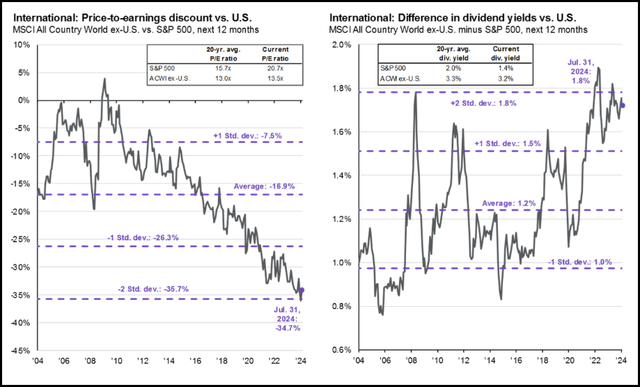
Like many closed-end funds, ETG is leveraged and with a higher rate environment, they’ve seen their borrowing costs rise. With the Fed looking like it’ll be cutting rates over the next year, that could help ease those pressures on this fund. During fiscal 2022 and 2021, the fund’s total expense ratio came to 1.58% and 1.27%, respectively. That can be compared with the 2.63% seen in the latest semi-annual report and the 2.7% seen in fiscal 2023.
The other side of this to consider is if they are cutting aggressively, it is likely because the economy is slowing faster than expected. Being primarily an equity fund, it is already susceptible to be quite volatile, but that leverage will add even further downside potential risks. So, that’s always another consideration for investors to be comfortable with before owning this fund.
Monthly Distribution
The last time we touched on the fund, we noted that the fund lifted its monthly payout earlier this year. That was after cutting it in late 2022 when broader equities were in a bear market. To be fair, though, it was also after the fund lifted its payout in 2021.
The latest distribution is still slightly below that high watermark we saw in 2022. It is also still down from where it was prior to the Global Financial Crisis. Eaton Vance typically isn’t too afraid to adjust its distribution for its funds when it seems necessary-which is unlike some other fund sponsors that tend to try to hold them steady for extended periods of time-even if it seems like cutting was the best course of action to preserve NAV.
ETG Distribution History (CEFConnect)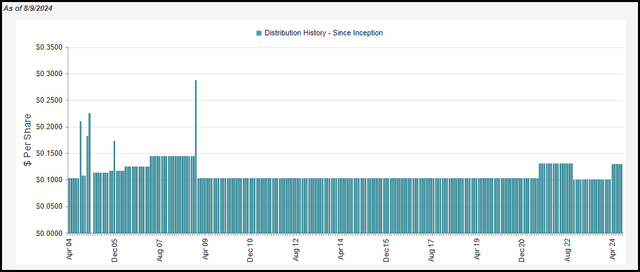
As a mostly equity fund, ETG will require capital gains in order to cover its monthly distribution to investors. The latest report shows us that net investment income in the first half of fiscal 2024 is on pace to come in quite similarly to last year’s NII.
Based on that figure, NII coverage was around 65%. However, with a now higher distribution, NII coverage based on that latest NII figure would come to around 52%. For a fund that is so heavily invested in equity positions, that’s actually fairly strong-likely being helped out because the fund does have a small fixed-income sleeve.
ETG Financial Metrics (Eaton Vance)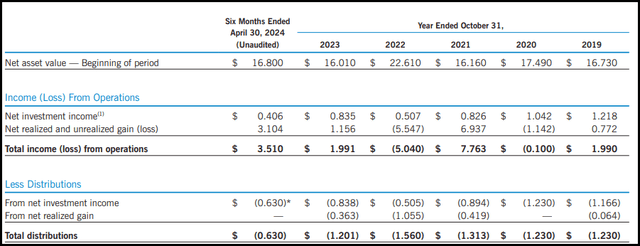
ETG’s Portfolio
With ETG, the fund can be quite active. The latest turnover rate came to 59%, and that was for a six-month period. That would put it on pace to eclipse last year’s 101% turnover figure, which was quite active on its own. Essentially, that means the management team flipped over the total value of their portfolio at least once. This wasn’t even the highest turnover the fund has reported either-in 2020, the fund had a portfolio turnover rate of 224%.
All this is to say, the fund here can change quite drastically and in relatively short periods of time. In this latest update, the fund asset allocation shifted to include a heavier weighting into equity positions. Previously, the equity sleeve accounted for 79.68% of assets. The fund also leaned even more heavily into foreign equity at a 46.98% weight and only 32.40% in the U.S. sleeve.
ETG Asset Allocation (Eaton Vance)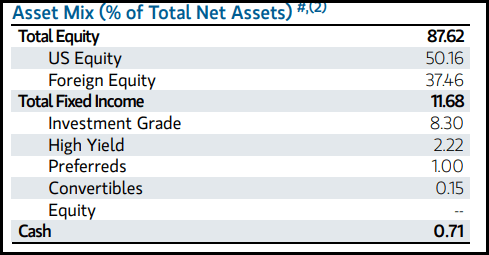
Another quite notable shift was that the fund had previously overweighted financials to a significant degree. It accounted for nearly 32% of the fund’s assets, and technology was 16.30%. They’ve now shifted into the tech sector being the largest sector, coming in at 24.29% over financial’s 19.73% sleeve.
ETG Sector Allocation (Eaton Vance)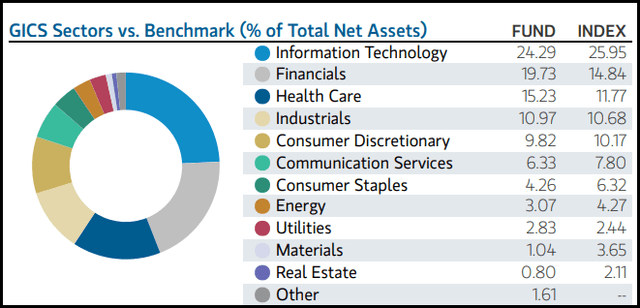
That shift happened from the end of March to now the end of June’s breakdown. In fact, it actually happened in an even shorter period of time as the fund’s semi-annual report still reflected financials at a 29.8% weighting. That was for the period ending April 30, 2024. So, this shift took place within a two-month span.
This is actually much more in line with the fund’s benchmark but is a change from how the fund had often been positioned. While there have been times when tech has become the largest weighting in the fund, it has generally been to a smaller degree at about 2 points or less. The fund’s benchmark is the MSCI World Index and the ICE BofA Fixed Rate Preferred Securities Index.
Given that tech has been performing so strongly, that’s certainly one of the reasons why the fund could see its weightings shift toward that sector. Here is the YTD U.S. equity sector performance breakdown through the end of June 2024-reflecting the same period end we see for the ETG sector breakdown above.
U.S. Sector Performance (Seeking Alpha)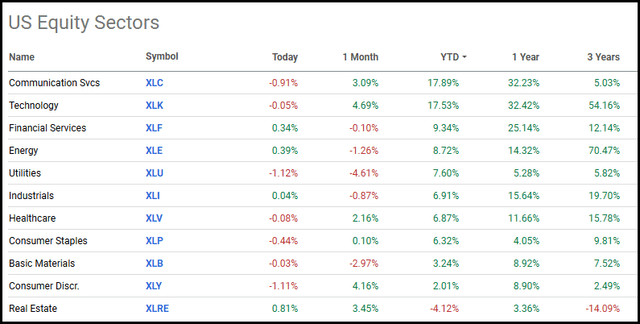
Looking toward the top ten holdings, we can start to see some of the reasons why tech weighting and equities have been growing in the fund. Overall, the top ten comprise 28.44% of the fund’s assets, which are all also equity positions. That compares with the top ten making up 19.41% previously.
ETG Top Ten Holdings (Eaton Vance)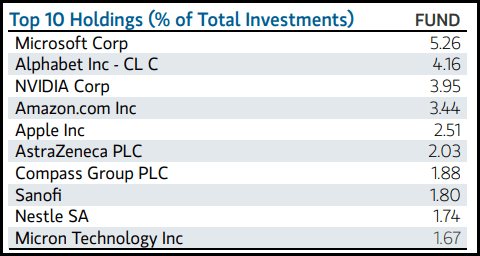
Microsoft (MSFT) has seen its weighting increase from 3.62% previously, along with NVIDIA (NVDA) previously being 2.17%. Apple (AAPL) has also seen its allocation increase from 1.49%, and Micron Technology (MU) is now in a top ten position while it wasn’t previously. All of these are companies identified as belonging to the information technology sector space.
Nordea Bank Abp (OTCQX:NRDBY) and Swedbank AB (OTCPK:SWDBF), being financial sector stocks, no longer make it into the top ten. They were still listed as positions at the end of April 30, 2024; however, it is unclear if they still are. (Eaton Vance generally provides a total holding list, but for ETG, the page to access it seems to be down currently.)
Conclusion
ETG remains an attractively discounted closed-end fund that can provide investors exposure to some global positioning. Global equities can provide some diversification for investors. We know historically, there have been periods where global equities have been able to outpace U.S. equities-even though most of the last couple of decades it’s been pretty one-sided, strongly favoring U.S. equities. Still, they remain attractively valued relative to their U.S. counterparts and one reason they could perform better going forward is due to this valuation difference.
Read the full article here