


Investment Thesis
Today’s article initiates my coverage of the First Trust S&P 500 Diversified Free Cash Flow ETF (NYSEARCA:FCFY), a relatively new and virtually unknown fund with just $1.14 million in assets under management. Honestly, I can’t see FCFY lasting long, given the competitiveness of the category and its high 0.60% expense ratio. However, FCFY brings something to the table its peers lack: guaranteed diversification at the sector level. As I will detail below, FCFY features superior free cash flow margins compared to more established funds like the Pacer US Cash Cows 100 ETF (COWZ) while matching the sector exposures of the SPDR S&P 500 ETF (SPY). I think the approach is reasonable, and I look forward to explaining how the strategy works in more detail below.
FCFY Overview
Strategy Discussion and Sector Exposures
FCFY tracks the S&P 500 Sector Neutral FCF Index, which selects 100 S&P 500 Index stocks (20%) with high free cash flow yields relative to other companies within the same GICS sector. The Index mirrors the sector exposures of the S&P 500 Index, weights based on free cash flow yield, constrains individual security weights to between 0.25% and 5.00%, and reconstitutes twice per year. Apart from an exception rule to limit exposure to companies with non-positive free cash flow yields, that’s the strategy. It’s easy to understand and replicate and, most importantly, provides investors with a different approach to free cash flow investing.
As shown below, COWZ, VFLO, FLOW, and COWS all have high exposure to energy stocks, leaving investors particularly vulnerable in an economic slowdown. In contrast, FCFY’s 3.53% exposure to this sector is aligned with the SPDR S&P 500 ETF (SPY) and might make investors more comfortable if a slowdown is on the horizon.
The Sunday Investor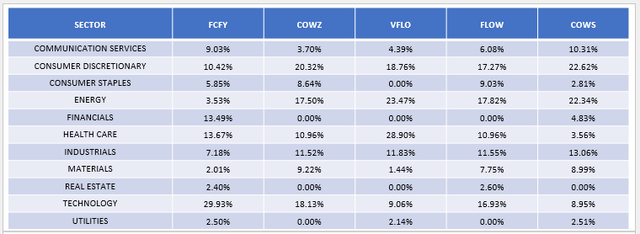
Another key difference is FCFY’s exposure to Financials. Stocks in this sector are outright excluded from COWZ, VFLO, and FLOW, while COWS offers exposure to just three stocks totaling 4.83% of its portfolio. However, FCFY’s Index incorporates changes in net working capital into the equation and also makes adjustments for Real Estate securities, as follows:
S&P Dow Jones Indices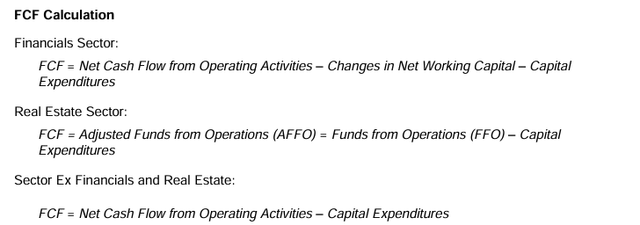
In addition, FCFY calculates free cash flow yield by dividing free cash flow by market cap and not enterprise value. I’m not too bothered by this, as I can easily assess valuation using more traditional ratios. More on that soon, but first, let’s define FCFY’s peer group and see how it compares on “basic” statistics such as assets under management, fees, and liquidity.
FCFY Peer Group
FCFY launched on August 22, 2023, so it hasn’t had much time to catch on with investors. Unfortunately, other providers launched their free cash flow funds quicker and have a better chance at piggybacking off the success of COWZ. This list includes the VictoryShares Free Cash Flow ETF (VFLO), the Global X U.S. Cash Flow Kings 100 ETF (FLOW), and the Amplify Cash Flow Dividend Leaders ETF (COWS). So far, VFLO has done quite well with $759 million in assets under management, FLOW has struggled with just $4 million, and COWS is doing slightly better at $16 million, mainly because Amplify ETFs has agreed to waive the 0.39% expense ratio until at least September 2024.
Seeking Alpha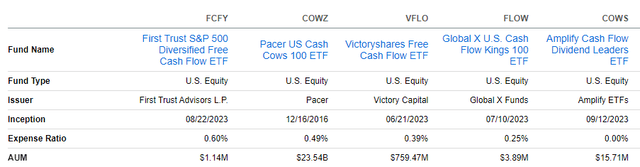
The inception dates highlight the sudden rush to be “second-to-market” behind COWZ, and it’s not coincidental. COWZ’s assets under management ballooned from $7.4 billion two years ago to $23.54 billion today after demonstrating top-quartile success from 2020-2022.
Morningstar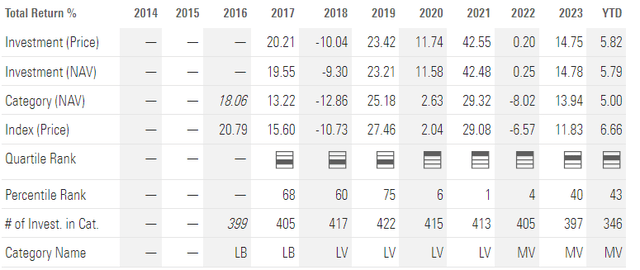
Performance has reverted back to about average since then, but its 17.50% exposure to Energy stocks remains a risk, and that’s something FCFY avoids by design with its sector-neutral approach.
FCFY Analysis
Performance Since Inception
Since September 2023, FCFY has delivered a 14.57% total return compared to 10.77% and 21.23% for COWZ and VFLO, respectively. One year isn’t much, and I strongly caution against using historical results to predict future returns.
Portfolio Visualizer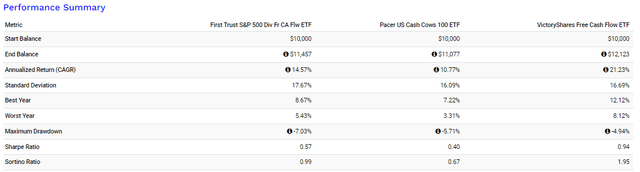
I think COWZ and VFLO are the best peers with which to compare FCFY, as they are established enough and unlikely to liquidate. I also want to look at the SPDR S&P Sector Neutral Dividend ETF (SPDG). Like FCFY, SPDG also takes a sector-neutral approach, and tracking these funds allows us to see whether free cash flow yield or dividends is the better approach. So far, it’s dividends, with SPDG outperforming FCFY by almost 5% since October 2023.
Portfolio Visualizer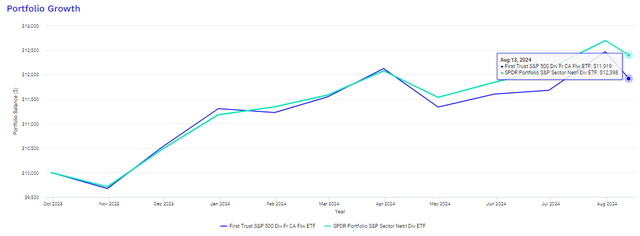
FCFY Fundamentals vs. COWZ, VFLO, SPDG
The following table highlights selected fundamental metrics for FCFY’s top 25 sub-industries, totaling 75.66% of the portfolio. Note that this concentration level is the best of the four ETFs listed.
The Sunday Investor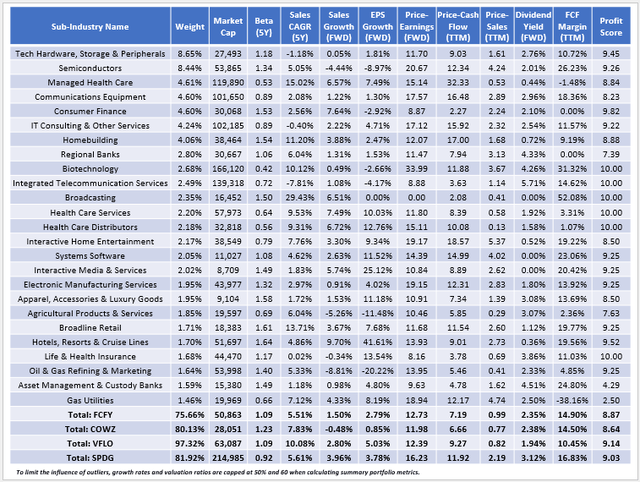
Here are four other observations to consider:
1. FCFY and VFLO have identical 1.09 five-year betas, indicating their slightly more volatile than the broader market. This feature is unusual for a large-cap value ETF, where the category average is 0.95, so the first takeaway is to accept that FCFY and its peers are not designed for defensive investors. If defense is your strategy, I suggest limiting exposure to free cash flow yield funds or opting for more traditional value and dividend funds. SPDG is one choice, with a 0.92 five-year beta.
2. FCFY’s free cash flow yield approach targets two factors simultaneously: quality and value. As such, I view it as a “quality-at-a-reasonable-price” fund, and we see that through FCFY’s weighted average 14.90% free cash flow margins and 12.73x forward P/E valuation. These metrics are competitive with COWZ and better than VFLO, whose free cash flow margins are only 10.45%. However, VFLO’s sector-adjusted profit score is the best at 9.14/10, which I believe is more valuable because it’s based on several profit metrics like EBITDA margins, return on equity, and of course, free cash flow margins.
3. While FCFY is value-oriented, it really doesn’t offer much growth potential, evidenced by 1.50% and 2.79% one-year estimated sales and earnings per share growth rates. In previous articles, I’ve hypothesized that many value ETFs fell below a “minimum growth” threshold where investors effectively ignore their strong value features. I think it’s tough to get behind a stock based on its valuation alone, and unfortunately, that’s the case for FCFY’s most prominent holdings. As shown below, FCFY’s top five holdings have 1/10 sector-adjusted growth scores, which corresponds to an “F” Seeking Alpha Growth Grade.
The Sunday Investor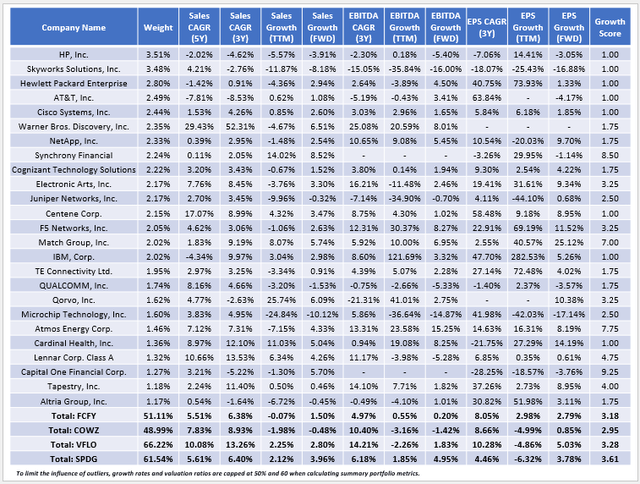
4. FCFY’s Index yield is 2.35%, but its 0.60% expense ratio means investors will net only 1.75% at current prices. Similarly, COWZ and VFLO have high expense ratios that make them less attractive to income investors, but SPDG and its 0.05% ER should result in a yield above 3% moving forward. This feature provides investors with an additional reason to invest if value stocks were to remain out of favor. To be sure, its valuation features aren’t quite as strong (16.23x forward P/E), but the quality is high, and its growth is good enough to avoid significant underperformance in growth-favored markets.
Investment Recommendation
FCFY is a sector-neutral ETF providing investors with exposure to 100 S&P 500 Index stocks selected for their free cash flow yield characteristics. The sector-neutral approach effectively guarantees high exposure to Technology stocks while limiting exposure to the difficult-to-forecast Energy sector, which may be beneficial if inflation keeps trending downward. To be safe, Technology stocks aren’t safe either, but FCFY’s selections are attractively valued and potentially not as prone to sharp selloffs.
Its valuation is competitive with COWZ, but I think readers are better off owning VFLO or SPDG. VFLO is more concentrated but offers more growth, while SPDG looks better prepared to handle an economic downturn due to its lower beta and superior dividend yield. Lastly, consider how FCFY might not be around for long. Its 0.60% expense ratio is too high, and the $7K in fees generated from its $1.14 million in AUM doesn’t come close to covering the costs of running an ETF. Given this, I wouldn’t touch it, but I think the strategy has some merit, and I look forward to discussing it further with you in the comments section below. Thank you for reading.
Read the full article here