


Indian markets may have suffered an initial setback in the wake of this year’s general election, but the subsequent rebound confirms, as I mentioned in FLIN: Ride This Ultra Low-Cost ETF Into India’s General Elections, that equities aren’t as aggressively priced as many think. To recap, Indian Prime Minister Narendra Modi’s ruling ‘Bharatiya Janata Party’ (or the ‘BJP’) surprisingly fell short of the 272 seats required to obtain a simple majority on its own. This means a slightly higher policy-making hurdle as, unlike in PM Modi’s previous terms (see India Today’s graphic below for comparison), the BJP now needs consensus within its NDA coalition. It also puts off more contentious factor reforms (land, labor, capital, etc) that would have accelerated India’s structural growth for the next five years.
India Today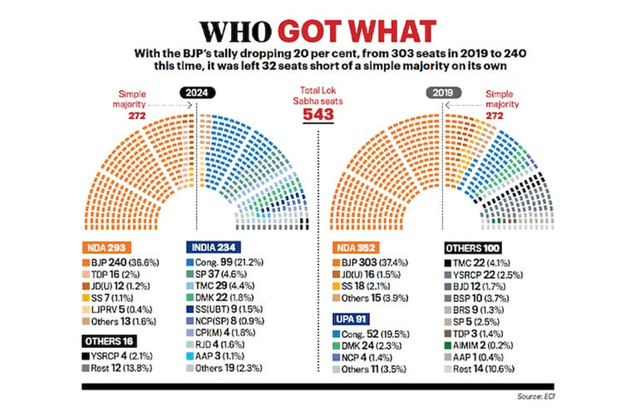
Still, it’s worth keeping in mind the big silver lining – that policy continuity is very much intact here, as the coalition government holds nearly 300 seats. And if ‘Modi 3.0’ is indeed an extension of ‘Modi 2.0’, India’s >10% nominal GDP growth pace should remain well-supported (think high-multiplier infrastructure buildout, continued formalization of the economy, and production-linked incentives to boost its manufacturing, among others). Timely as India unlocks the benefits of a massive demographic dividend on the path to its ‘Viksit Bharat’ goal (i.e., becoming a developed nation by 2047).
Emissary
As for Indian equities, they remain firmly in ‘growth at a reasonable price’ territory, with MSCI India’s current ~23x forward earnings well matched by expectations of high-teens % forward earnings growth through 2025 (+31% in 2023; +10% in 2024).
Yardeni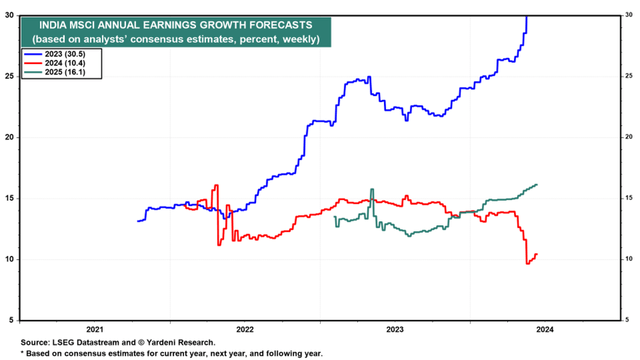
And on the technical side, record equity inflows from domestic investors (all-time high in May), as well as a foreign ‘put’ (note foreign equity investors have been net sellers to date, likely on valuation), should support large-caps in the post-election stretch. Though there might be some choppiness heading into the government’s first 100 days and the unveiling of this fiscal year’s Union Budget next month, Franklin Templeton’s well-diversified, ultra-low-cost FTSE India ETF (NYSEARCA:FLIN) remains a great vehicle to weather the upcoming shifts.
FLIN Overview – Size and Liquidity Improves; Cost Advantage Intact
The Franklin FTSE India ETF can’t yet match the premier US-listed India tracker fund, iShares’ MSCI India ETF (INDA), in terms of size or liquidity, but the gap is certainly narrowing. For context, FLIN currently manages a significantly larger asset base at ~$1.3bn (up from ~898m when I last covered the fund). As a result, the fund now offers a very competitive bid/ask spread of ~3bps –only one basis point behind INDA and ~6bps better than iShares’ other flagship tracker, the India 50 ETF (INDY).
Meanwhile, FLIN’s big fee advantage, in line with Franklin’s other international ETFs, remains intact. At a ~0.2% expense ratio, this remains the cheapest US-listed vehicle by far – by comparison, other large-cap trackers like INDA and INDY charge 0.65% and 0.89%, respectively. Hence, though FLIN doesn’t offer the tightest spreads or the best liquidity, it should rank right at the top on overall cost – especially for investors moving smaller volumes.
|
Net Expense Ratio |
Total Assets |
30-Day Median Bid/Ask Spread |
|
|
Franklin FTSE India ETF |
0.19% |
$1.3bn |
0.03% |
|
iShares MSCI India ETF |
0.65% |
$10.9bn |
0.02% |
|
iShares India 50 ETF |
0.89% |
$894m |
0.09% |
Source: Franklin Templeton, iShares
FLIN Portfolio – Maintaining the Status Quo
FLIN also continues to run the broadest portfolio out of all the US-listed large-cap tracker funds at 230 holdings (vs. 146 for INDA and 50 for INDY). Complementing this is a stricter weighting cap policy (<20% individual cap and cumulative 48% cap for all single-stock holdings over 4.5%), enforced via a semi-annual review and reconstitution, which keeps FLIN’s positions well spread out. The less top-heavy sector breakdown (top five sectors at 66.7% vs INDA at 68.3% and INDY at 76.1%) is a result of this policy. Otherwise, relative to last quarter, FLIN’s sector composition is broadly unchanged.
Franklin Templeton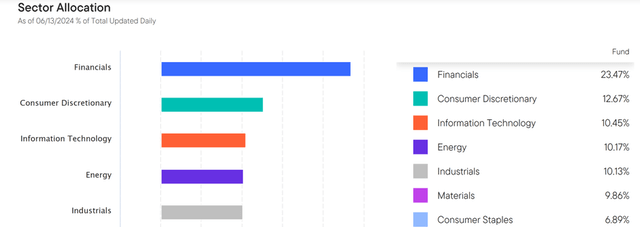
As for the single-stock profile, FLIN is largely unchanged as well. In line with last quarter, the top five holdings comprise Reliance Industries Limited (RLNIY) (7.3%), HDFC Bank (HDB) (6.5%), Infosys (INFY) (3.9%), Tata Consultancy Services (TTNQY) (3.0%), and Bharti Airtel (BHRQY) (2.4%). One minor change, on the other hand, is FLIN’s smaller net long equity exposure at ~101% (attributable to cash, derivatives, unsettled trades, etc), which, in bull markets, should add slightly to performance.
Franklin Templeton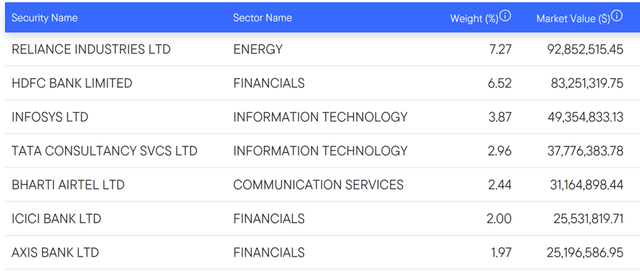
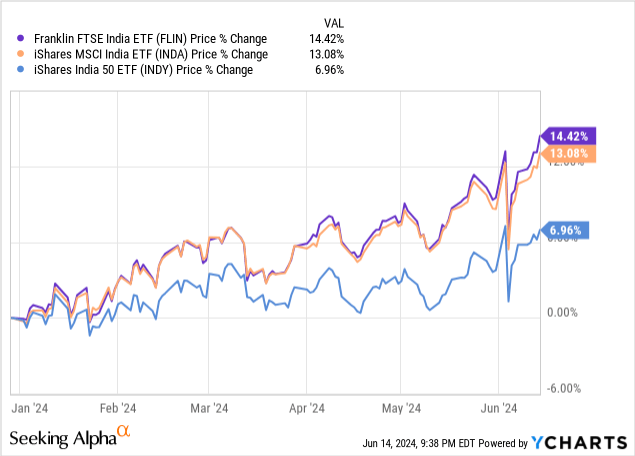
FLIN Performance – The Fastest Horse in the Indian Large-Cap ETF Race
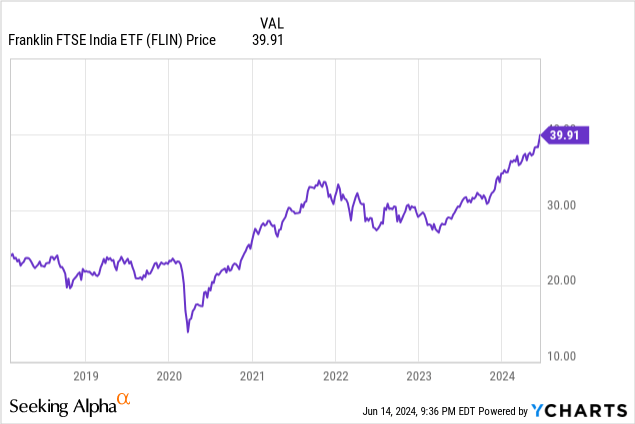
After a great run heading into election season, FLIN has only rallied further post-election, gaining a low-teens % year to date. Note that the fund is coming off a +20.7% year in 2023 (total one-year return of +30.6%) and an annualized three- and five-year track record of +10.1% and +11.3%, respectively. By comparison, both the other large-cap India trackers, INDA and INDY, have lagged – partly due to their higher fees but mainly because of their less diversified approach vs FLIN. Assuming this trend, which held true throughout PM Modi’s previous terms, continues, expect FLIN to remain the through-cycle large-cap ETF outperformer.
The catch with FLIN is that it doesn’t track its benchmark, the FTSE India Capped Index, particularly well in bull markets. Over the last year, for instance, FLIN investors gave up over five percentage points in tracking error (wider than both iShares’ large-cap India ETFs), while over longer timelines, the gap typically runs in the one or two percentage point range. The nature of how foreign capital is taxed and the various other complexities associated with investing in India means this will always be an issue, particularly in bull markets; still, FLIN’s much-improved tracking error this year is a very positive step.
Franklin Templeton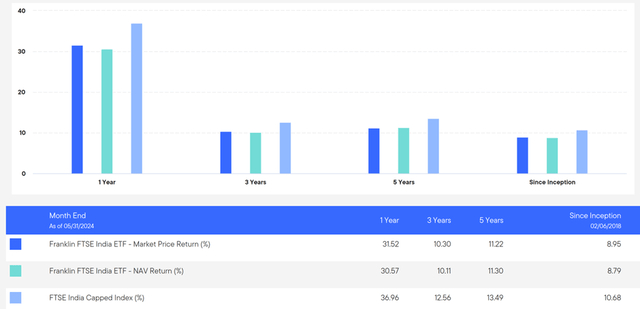
Plenty of Upside Left in India’s Post-Election Phase
Indian markets may not have got a blue-sky election outcome this time around but if ‘Modi 3.0’ is anything like ‘Modi 2.0’, this post-election rally may yet have legs. Even without PM Modi’s ‘big bang’ reforms, it’s worth keeping in mind that India remains the fastest-growing large economy in the world and just as importantly, the one with the longest runway – both for earnings and the broader economy. Heading into the upcoming budget and with foreign investors not yet participating in this large-cap rally, I’d stay long the lowest-cost single-country India ETF, FLIN.
Read the full article here