


I have been bullish on Indian equities for quite a while, as India seems poised to supplant China as the world’s growth engine with a youthful population and strong relationships with Western democracies (Figure 1).
Figure 1 – Demographic projections between India and China (UN.org)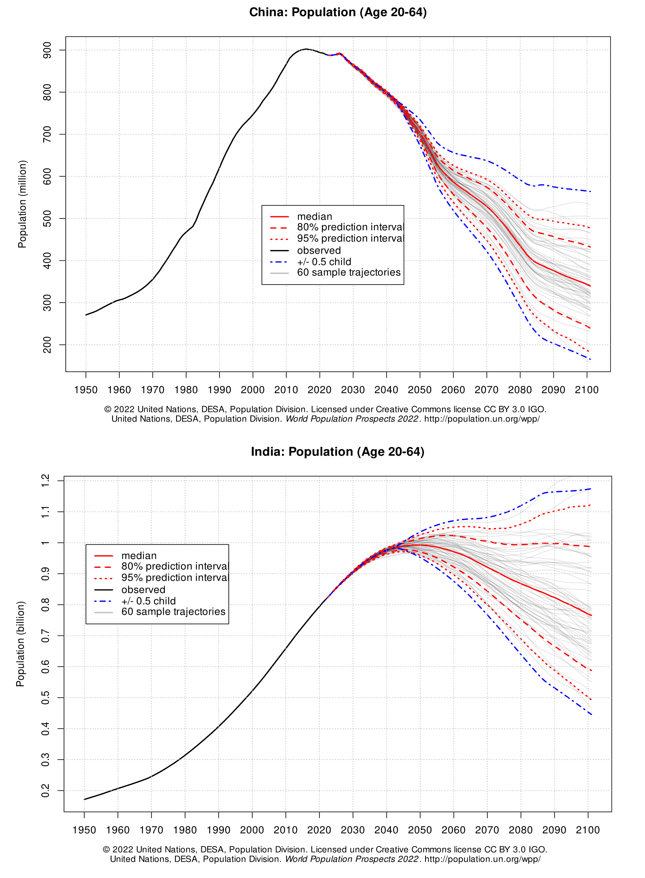
In the past, I have recommended the iShares MSCI India ETF (INDA) as a convenient way to gain exposure to Indian equities. Recently, I came across the Franklin FTSE India ETF (NYSEARCA:FLIN), another Indian equities-focused ETF. How does FLIN compare against INDA?
Historically, the FLIN ETF has outperformed the INDA ETF, despite both being broadly diversified funds. I believe this is because of FLIN’s index composition, which includes a greater number of mid-cap Indian companies that have been powering higher with the influx of foreign capital.
Looking forward, there are signs that Indian equity valuations may be reaching extremes, as the MSCI India Index is trading at a forward P/E of 23x. However, momentum is still on the side of the bulls for now as the smaller-cap FLIN continues to outperform the INDA.
For those bullish on Indian equities, I believe the FLIN ETF could be a solid complement or replacement for the INDA ETF, especially with its rock-bottom expense ratio of 0.19%. I rate FLIN a buy.
Fund Overview
The Franklin FTSE India ETF provides investors access to the Indian stock market with exposure to large- and mid-sized companies in India. The FLIN ETF passively tracks the FTSE India Capped Index, which measures the performance of Indian large- and mid-capitalization stocks. The index’s construction is relatively straightforward and is based on free float-adjusted market capitalizations, reviewed semi-annually.
The index has a single security maximum weight of 20% and the sum of the weights of all constituents representing more than 4.5% of the index is capped at 48% of the total.
The FLIN ETF is one of the larger ETFs targeting India, with $1.3 billion in assets, behind the leader INDA and the WisdomTree India Earnings Fund ETF (EPI) (Figure 2).
Figure 2 – FLIN vs. peer funds (Seeking Alpha)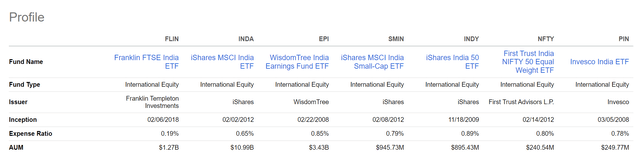
While not the largest, FLIN is definitely one of the cheapest Indian equities funds, with an expense ratio of 0.19%, much lower than peers at 0.65% to 0.89%.
Portfolio Holdings
The FLIN ETF currently has 230 holdings with a weighted average market capitalization of $57.6 billion (Figure 3). The average trailing P/E ratio of the fund is 28.2x and the stocks are trading at 4.5x P/B.
Figure 3 – FLIN portfolio overview (franklintempleton.com)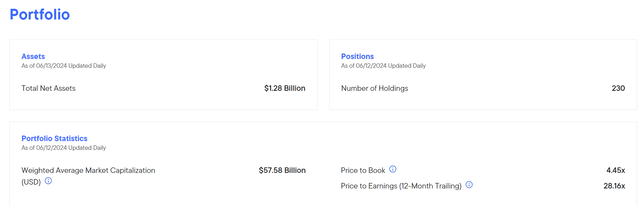
Figure 4 shows the sector allocation of the FLIN ETF. The fund’s largest sector weights are Financials at 23.5%, Consumer Discretionary at 12.7%, Technology at 10.5%, Energy at 10.2%, and Industrials at 10.1%.
Figure 4 – FLIN sector allocation (franklintempleton.com)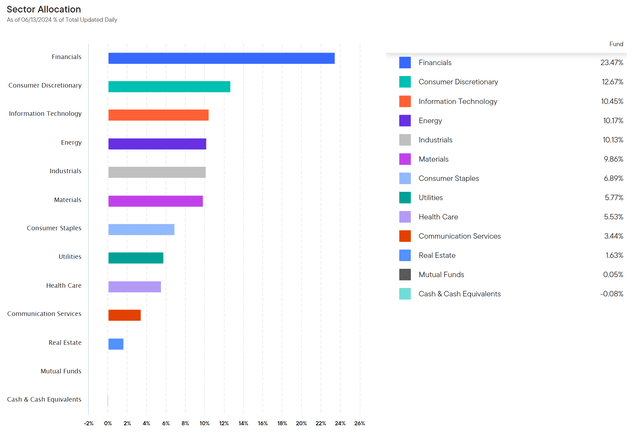
The FLIN ETF is modestly concentrated, with its top 10 holdings accounting for 32.5% of the fund (Figure 5). Reliance Industries, the Indian conglomerate, is the fund’s largest holding at 7.3%.
Figure 5 – FLIN top 10 holdings (franklintempleton.com)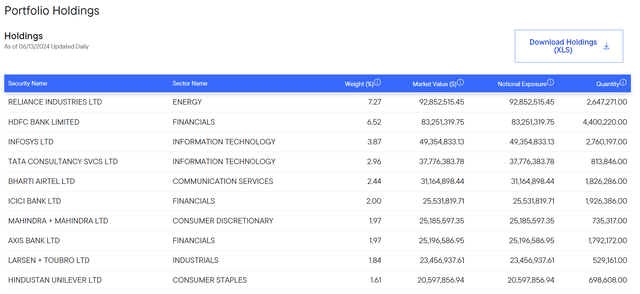
Returns
Recent historical performance for the FLIN ETF has been strong, with 1/3/5-year average annual returns of 30.6%/10.1%/11.3% respectively to May 31, 2024 (Figure 6).
Figure 6 – FLIN historical returns (morningstar.com)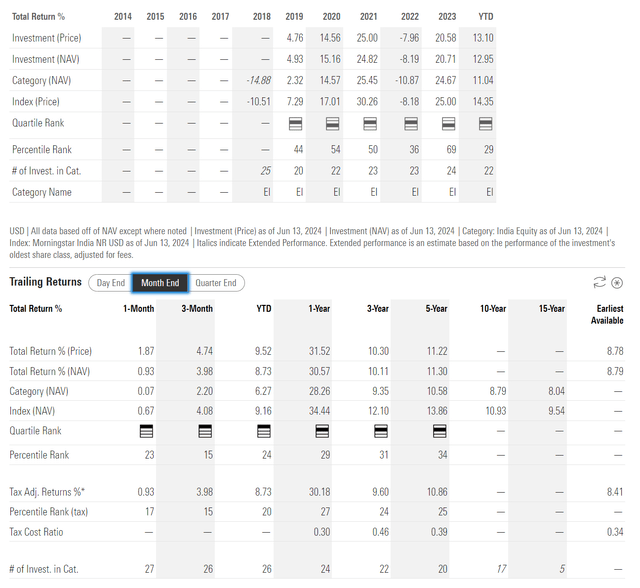
The FLIN ETF has shown outperformance against its peer group, the India Equity category on Morningstar, with the FLIN ETF ranking 2nd quartile in 1/3/5-yr average annual returns.
Measured against the INDA ETF that I have previously recommended, the FLIN ETF has outperformed, delivering a 3-year total return of 34.8% compared to 28.8% for the INDA ETF and 27.7% for the SPDR S&P 500 ETF Trust (SPY) (Figure 7).
Figure 7 – FLIN vs. INDA, 3 year returns (Seeking Alpha)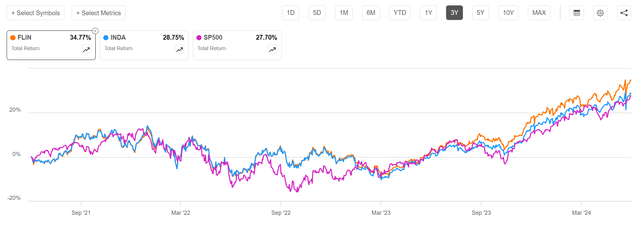
Why Has FLIN Outperformed INDA?
Both the FLIN and INDA ETFs are broadly diversified passive index funds providing similar exposures to large- and mid-cap Indian equities, so it is quite surprising to see such a large difference in their performances over the past 3 years.
Delving into the fund’s respective compositions, there is a relatively large overlap between INDA and FLIN (as expected, since they are both Indian equity funds), with 95% of INDA’s holdings also in the FLIN ETF (Figure 8).
Figure 8 – Overlap between FLIN and INDA (etfrc.com)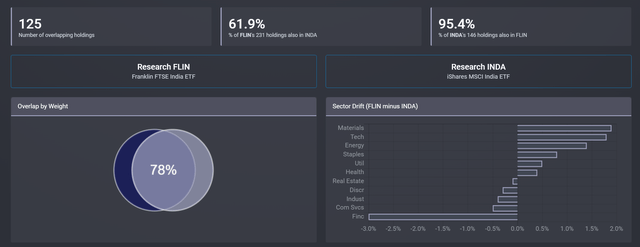
However, the opposite is not true, as the FLIN ETF has 230 holdings compared to INDA’s 146, so only 62% of FLIN’s holdings are included in INDA. Furthermore, there is only a 78% overlap between the two funds by position weights.
So while the top positions between FLIN and INDA are nearly identical (see top holdings of the INDA ETF in Figure 9 below), the proof is in the details; or more precisely in FLIN/INDA’s case, the outperformance has been driven by the smaller companies in FLIN’s portfolio that are not in INDA’s portfolio.
Figure 9 – INDA top holdings (ishares.com)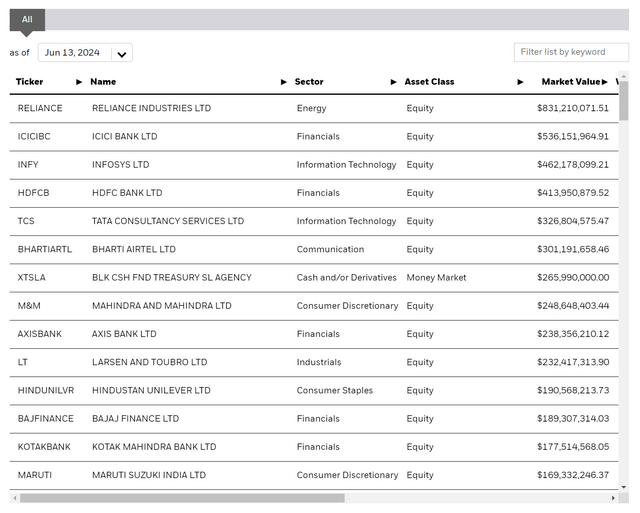
For example, while the smallest holding within the INDA ETF is Bandhan Bank at 0.13% of the INDA ETF, the FLIN ETF holds many positions in even smaller companies like Emami Ltd., which has done tremendously well in the past few years (Figure 10).
Figure 10 – Emami Ltd. stock performance (stockcharts.com)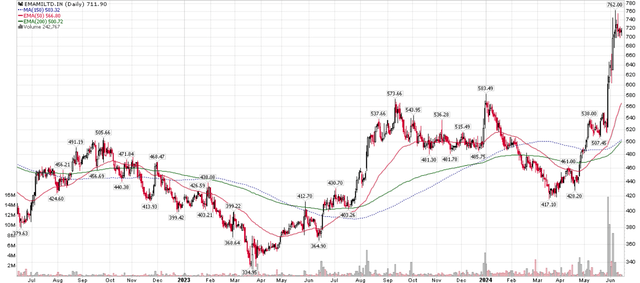
So although the individual positions are small in the FLIN ETF, in a strong bull market like India is currently experiencing, smaller companies tend to outperform and cumulatively add to FLIN’s performance.
Indian Elections Introduce Short-Term Volatility
Although Indian equities initially sold off hard after Narendra Modi’s ruling party failed to win a sweeping victory at the recent national elections, markets seem to have calmed down in recent days after investors came to their senses.
For Indian equities, a smaller mandate for Narendra Modi is actually a good result. Heading into the elections, Prime Minister Modi was campaigning on policies that promised welfare to millions of India’s unemployed youths. These policies could have potentially stressed India’s fiscal balance sheet and spurred inflation. India was also focused on becoming more assertive on the international stage as a counterbalance against China.
However, with Modi’s government now governing by coalition, he will have to bargain with regional powers and special interest groups in order to pass legislative policies. As we have seen in American politics, historically, stocks perform best when Congress is split. A divided government is good for business and stocks because it leads to more stability and is less likely to lead to extremes in any political direction.
Instead of global ambitions, Modi’s government will likely focus on spurring domestic growth and consumption, which should benefit Indian-centric stocks.
Risk
The biggest risk to Indian equities remains valuations. Looking at the FLIN ETF, the portfolio currently trades at trailing 28.2x P/E and 4.5x P/B, which is historically high.
Looking at the MSCI India Index (the index underlying the INDA ETF) as a reference, the current forward P/E on Indian equities is approaching historical extremes that have preceded sharp declines or consolidations (Figure 11).
Figure 11 – Indian equity valuations nearing extremes (yardeni.com)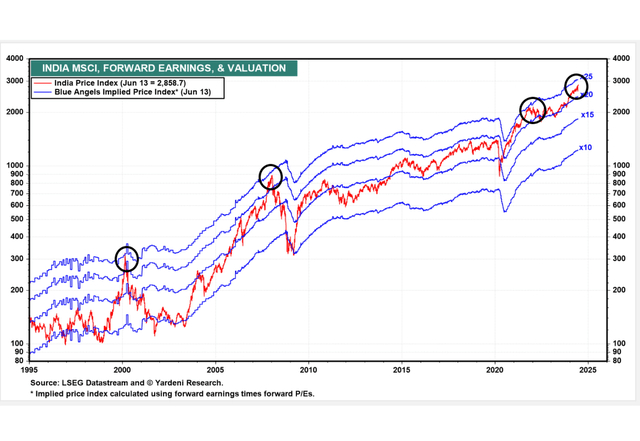
So while the macro fundamentals for Indian equities remain strong, investors should keep valuations in the back of their minds and invest with caution.
Technicals Still Supportive
For now, momentum still favors the smaller-cap stocks within the FLIN ETF, with the ratio of the FLIN ETF compared to the INDA ETF reaching new highs (Figure 12).
Figure 12 – FLIN/INDA ratio a useful measure for momentum (Author created using stockcharts.com)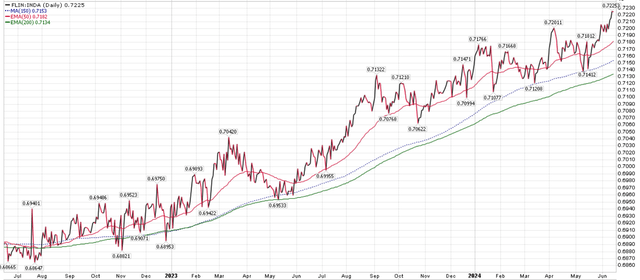
This suggests momentum still favors Indian equities and both the INDA and FLIN ETFs will likely continue powering higher.
Long investors in Indian equities should monitor the ratio between the FLIN and INDA ETFs for early warning signs that the multi-year rally in Indian equities is coming to an end.
Conclusion
Like the INDA ETF I have previously recommended, the FLIN ETF also provides exposure to large and mid-cap Indian equities. The key difference is the FLIN ETF includes a greater number of mid-cap companies that may perform better in a bull market.
Looking forward, there are signs that Indian equity valuations may be reaching extremes, as the MSCI India Index is trading at a forward P/E of 23x. However, momentum is still strong, as the smaller-cap FLIN ETF continues to outperform the INDA.
For those bullish on Indian equities, I believe the FLIN ETF could be a solid complement or replacement for the INDA ETF. I rate FLIN a buy.
Read the full article here