


Today I would like to add yet another multifactor exchange-traded fund to my coverage list with a review of the Fidelity Small-Mid Multifactor ETF (NYSEARCA:FSMD). After dissecting its portfolio, I can conclude that FSMD has a nicely balanced multifactor approach, mostly delivering on size, value, quality, low volatility, and momentum, though there are a few weaknesses that are worth addressing, which I am supposed to do today. However, despite the strategy being intricately calibrated, over its trading history of more than 5 years, the ETF was incapable of consistently outcompeting the mid-cap stocks represented in the S&P 400, let alone the market. And even though I am constructive on this vehicle partly because of its wafer-thin expense ratio of 15 bps, I believe a Buy rating is unjustified.
FSMD strategy: amalgamating four factors in a SMID portfolio
According to the FSMD website, the ETF tracks the Fidelity Small-Mid Multifactor Index. From the methodology document available on the Fidelity website, we know that this index
is designed to reflect the performance of stocks of mid- and small-capitalization U.S. companies with attractive valuations, high quality profiles, positive momentum signals, and lower volatility than the broader market.
The selection universe consists of the “top 3000 U.S. companies, excluding the largest 500 companies, based on float adjusted market cap.” The idea is to select the worthiest 600 stocks using the composite factor score, but this figure might go a bit higher or lower over time. As described in the methodology:
To determine the level of exposure each stock has to the targeted value, quality, momentum, and low volatility factors, a composite score is calculated. The composite score is a weighted-average score based on multiple measures of the four factors. Composite scores are calculated separately within each sector. Stocks are identified for inclusion in the index based on their composite factor score.
Performance: beating a few peers but lagging the market
First, investors who bought into FSMD shortly after it was listed in February 2019 have most likely been disappointed by its performance. The fact is, the ETF has trailed not only the iShares Core S&P 500 ETF (IVV) but also the iShares Core S&P Mid-Cap ETF (IJH) that tracks the S&P 400, which is a considerably more pressing issue than its inability to keep pace with the market.
To corroborate, below is the comparison of FSMD’s total returns and other performance metrics to those of IVV, IJH, and a peer, namely the John Hancock Multifactor Mid Cap ETF (JHMM). The period is March 2019–May 2024.
| Metric | FSMD | IVV | IJH | JHMM |
| Start Balance | $10,000 | $10,000 | $10,000 | $10,000 |
| End Balance | $16,424 | $20,667 | $16,947 | $16,852 |
| CAGR | 9.91% | 14.83% | 10.57% | 10.45% |
| Standard Deviation | 20.70% | 18.14% | 21.99% | 20.82% |
| Best Year | 25.74% | 28.76% | 24.71% | 24.53% |
| Worst Year | -11.52% | -18.16% | -13.10% | -15.30% |
| Maximum Drawdown | -29.26% | -23.93% | -29.70% | -27.45% |
| Sharpe Ratio | 0.46 | 0.74 | 0.47 | 0.48 |
| Sortino Ratio | 0.68 | 1.15 | 0.71 | 0.72 |
| Upside Capture | 87.90% | 100.88% | 97.01% | 94.17% |
| Downside Capture | 99.67% | 96.89% | 108.56% | 105.50% |
Data from Portfolio Visualizer
Here, FSMD’s returns look rather lackluster as it lagged all the selected ETFs.
The next period is July 2021–May 2024, shortened because I added another peer, the Invesco S&P MidCap 400 QVM Multi-factor ETF (QVMM), which was incepted in June 2021.
| Metric | FSMD | IVV | IJH | QVMM | JHMM |
| Start Balance | $10,000 | $10,000 | $10,000 | $10,000 | $10,000 |
| End Balance | $11,664 | $12,857 | $11,587 | $11,542 | $11,109 |
| CAGR | 5.42% | 9.00% | 5.18% | 5.04% | 3.67% |
| Standard Deviation | 18.95% | 18.13% | 20.74% | 20.67% | 19.88% |
| Best Year | 17.39% | 26.32% | 16.42% | 15.42% | 14.52% |
| Worst Year | -11.52% | -18.16% | -13.10% | -13.07% | -15.30% |
| Maximum Drawdown | -19.22% | -23.93% | -21.57% | -21.59% | -23.03% |
| Sharpe Ratio | 0.21 | 0.4 | 0.2 | 0.19 | 0.12 |
| Sortino Ratio | 0.33 | 0.6 | 0.31 | 0.3 | 0.19 |
| Upside Capture | 86.03% | 103.87% | 95.44% | 90.90% | 93.38% |
| Downside Capture | 91.14% | 96.47% | 101.50% | 102.35% | 99.97% |
Data from Portfolio Visualizer
Over that timeframe, FSMD looks much stronger, with a higher annualized return than both peers and IJH, plus it has the lowest downside capture ratio in the group. However, it still trailed IVV both in terms of the CAGR and the risk-adjusted returns (the Sharpe and Sortino ratios).
FSMD factor story: healthy dosage of value, quality, low volatility, and momentum
As of May 30, FSMD had 590 common stocks in its portfolio, with the major holding being EMCOR Group (EME), with a 46 bps weight. There are two important notes here, though.
- A Chess Depositary Interest (abbreviated as CDI) in Sydney-quoted GQG Partners Inc. (ASX ticker GQG) was also in the basket, accounting for 14 bps. It is labeled as a “unit stock.” However, since GQG does not have a U.S. listing (for instance, via an ADR), I excluded it from the analysis.
- The dataset also shows GCI Liberty Inc. Class A shares marked as “ESCROW.” GCI Liberty was acquired by Liberty Broadband (LBRDA) (LBRDK) in 2020, so I have obviously also ignored it.
All 11 GICS sectors are represented, with an emphasis put on industrials, financials, and consumer discretionary. As a reminder, FSMD’s underlying index adheres to the sector neutrality principle, so similarities between sector choices made by this ETF and IJH do not surprise me.
Created by the author using data from the ETFs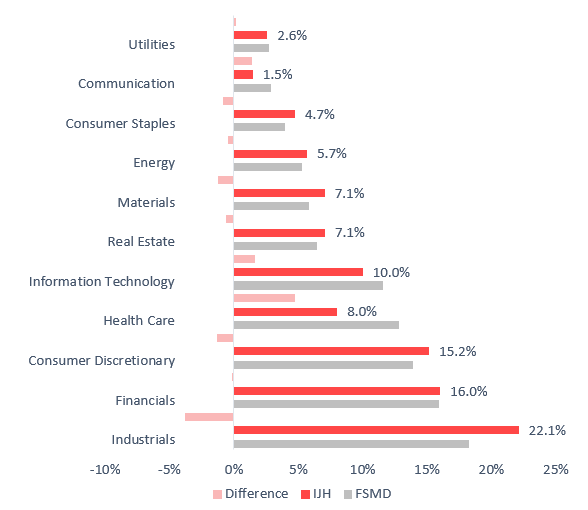
The size factor
My calculations show FSMD’s weighted-average market cap at $7 billion (as of June 1), which is definitely mid-cap territory. There is healthy exposure to small-caps as well, about 12%, and even a footprint in micro-caps, though microscopic (22 bps allocated to companies valued at less than $300 million). FSMD does have an approximately 23.1% allocation to large-caps (over $10 billion in market cap), but I believe this is adequate. For context, the Schwab U.S. Mid-Cap ETF (SCHM) had an over 39% allocation to large-caps when I analyzed it in October 2023. And the Franklin U.S. Mid Cap Multifactor Index ETF (FLQM), which I discussed in April 2024, back then had a weighted-average market cap of almost $24.5 billion, with its selection universe being the culprit.
Valuation
FSMD is not supposed to represent the cheapest SMID names. Instead, it is about balancing factors, where value has its due place. So here, we see a rather inexpensive portfolio, but without anything outstanding.
- The adjusted earnings yield of 5.85% is a healthy result for a mostly mid-cap portfolio. The main contributors are the financial and energy sectors, which tend to demonstrate lower P/Es. Please take notice that I removed the loss-making companies (8% of the net assets) from the calculations of the adjusted EY. For context, IJH’s website shows a P/E of 17.81x (translates into an EY of 5.6%).
- A 3.59x Price/Sales does not immediately signal significant undervaluation but it is not overstretched either. Adjusted for IDEAYA Biosciences (IDYA), which has a P/S of 151.4x, the figure falls to 3.4x.
- The debt-adjusted earnings yield (EBITDA/EV) of 7.3% also looks rather strong. However, I removed the four- and triple-digit EV/EBITDA figures from the calculations (1.3% of the net assets), as well as certain financial sector stocks, as the ratio is irrelevant for them.
- Finally, close to 31% of the holdings have a Quant Valuation grade of B- or higher, which is counterbalanced by about 43.7% allocated to those names with a B+ rating or worse.
Quality
FSMD has amalgamated numerous top capital efficiency stories, and there is a lot to appreciate when it comes to margins. However, this portfolio is not ideal.
- About 75% allocated to companies with a B- Quant Profitability grade or higher is an adequate result by SMID standards. However, there are much stronger mid-cap portfolios, with an excellent example being the Invesco S&P MidCap Quality ETF (XMHQ), which had an over 87% allocation to such names as of May 31.
- While almost a quarter of holdings have Return on Assets above 10%, the weighted-average figure is not impressive at just 6.9%. The adjusted Return on Equity is also just acceptable at 16.3%.
Low volatility and momentum
FSMD’s portfolio has a weighted-average 24-month beta of 0.99, as per my calculations, which means it is a little bit less volatile than the market. At the same time, about 65% of the net assets are allocated to companies with a B- Quant Momentum grade or higher.
Is FSMD worth buying into at this juncture?
FSMD might appeal to investors who are on the hunt for low-cost mid-caps-focused vehicles that do offer a bit more comfortable volatility than the S&P 400-tracking IJH. It is important to note that it has captured less downside than the S&P 400 ETF since its inception and delivered a less painful loss than IVV in 2022 (11.52% vs. 18.16%). Besides, FSMD does have a cost advantage over JHMM.
Seeking Alpha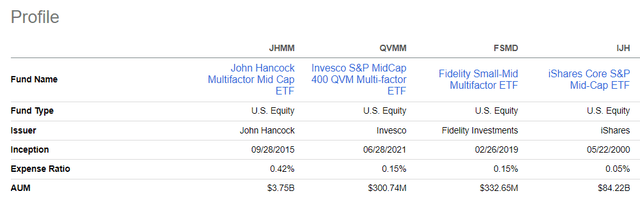
However, this is not sufficient for a bullish stance.
Read the full article here