


Recently, I wrote a positive article on the JPMorgan Nasdaq Equity Premium Income ETF (JEPQ), noting it was a solid buy-write ETF based on the Nasdaq 100 Index that I wouldn’t mind owning at the right price. This article looks at yet another buy-write ETF based on the Nasdaq 100 Index, the First Trust Nasdaq BuyWrite Income ETF (NASDAQ:FTQI).
Fund Overview
The First Trust Nasdaq BuyWrite Income ETF’s aim is to provide high current income from its portfolio of U.S.-listed stocks and a call writing strategy based on the Nasdaq 100 Index.
The FTQI ETF’s investment process starts with the universe of U.S.-listed equity securities and First Trust applies a mathematical optimization process based on trading liquidity, market capitalization, price level, sector classification, and contribution to risk and return to narrow down the universe (Figure 1).
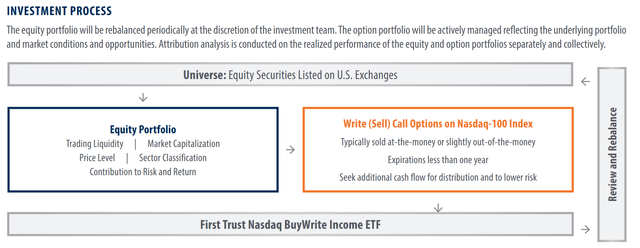
Figure 1 – FTQI strategy (FTQI investor guide)
The fund manager also writes at-the-money (“ATM”) or slightly out-of-the-money (“OTM”) call options on the Nasdaq 100 Index to generate premium income that are distributed to unitholders (Figure 2).
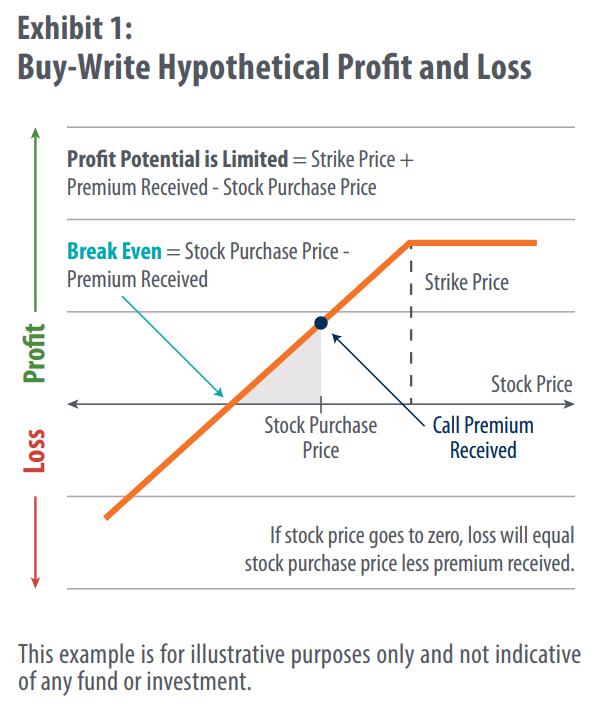
Figure 2 – Illustrative buy-write strategy (FTQI investor guide)
As with all buy-write strategies, the FTQI ETF trades off upside in exchange for premium income. The FTQI ETF has $58 million in assets and charges a 0.85% expense ratio.
Portfolio Holdings
Figure 3 shows the top 10 holdings of the FTQI ETF.
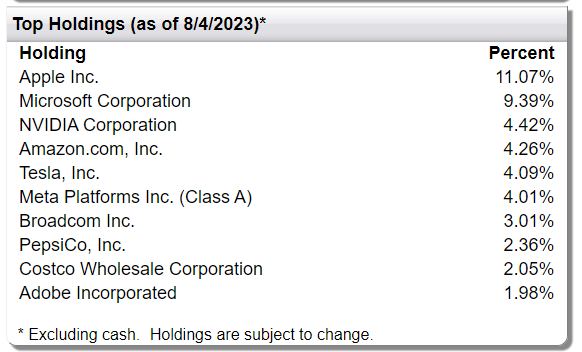
Figure 3 – FTQI top 10 holdings (ftportfolios.com)
The FTQI’s top holdings are very similar to the Nasdaq 100 Index, as modeled by the Invesco QQQ Trust ETF (QQQ), except for the notable absence of Alphabet Inc. from the top 10 holdings (Figure 4).
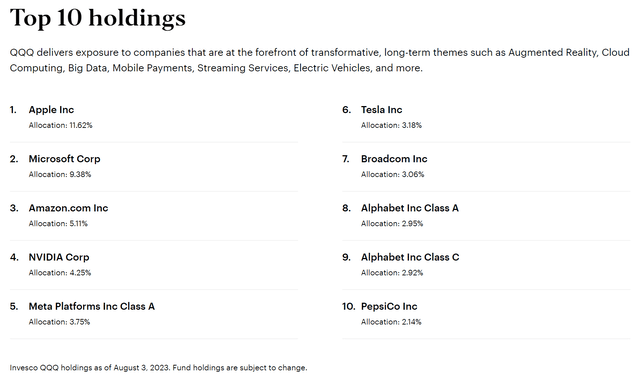
Figure 4 – QQQ top 10 holdings (invesco.com)
Figure 5 and 6 compares the sector allocation between the FTQI ETF and the QQQ ETF. The FTQI ETF is underweight Information Technology (49.4% vs. 57.1%) and Consumer Discretionary (10.3% vs. 18.7%) while overweight Communications (15.2% vs. 5.2%).
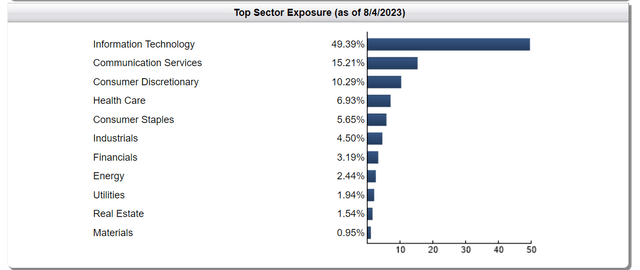
Figure 5 – FTQI sector allocation (ftportfolios.com)
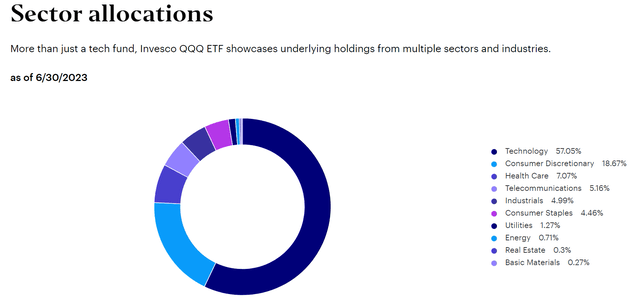
Figure 6 – QQQ sector allocation (invesco.com)
Returns
Historically, the FTQI ETF has delivered very modest returns, with 3 and 5Yr average annual returns of 6.0% and 2.7% respectively to July 31, 2023 (Figure 7).
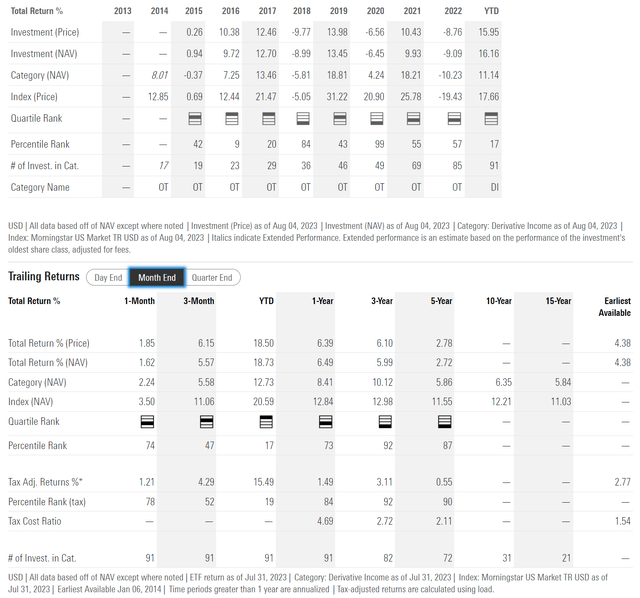
Figure 7 – FTQI historical returns (morningstar.com)
The FTQI’s performance lags far behind that of the QQQ ETF, which has returned 13.7% and 17.7%, respectively, in the same time frame (Figure 8).
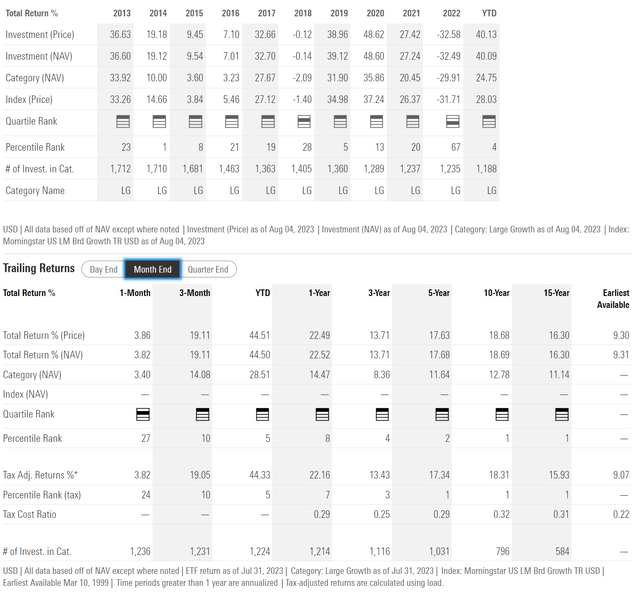
Figure 8 – QQQ historical returns (morningstar.com)
One of my main criticisms of call-write strategies is the fact that they tend to underperform in the long-run because it trades off a significant part of the underlying’s upside in exchange for premium income. However, the FTQI ETF appears to take the underperformance to an extreme.
In fact, the FTQI has one of the weakest long-term performance of any call-write strategies I have seen.
FTQI vs. Peers
Comparing FTQI against peer ETFs that employ a buy-write strategy on the Nasdaq 100 Index, we can see that the FTQI is the most expensive fund, with a 0.85% expense ratio (Figure 9).
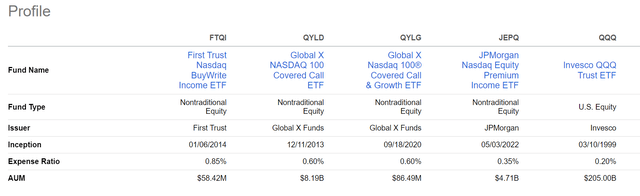
Figure 9 – FTQI vs. peers, fund structure (Seeking Alpha)
FTQI’s tiny AUM means that the fund has a wide bid/ask spread and a large gap between its market price and its NAV (Figure 10). The FTQI ETF has traded at a premium / discount of +/- 0.50% in the past year, compared to ~0.15% for the Global X Nasdaq 100 Covered Call ETF (QYLD), for example.
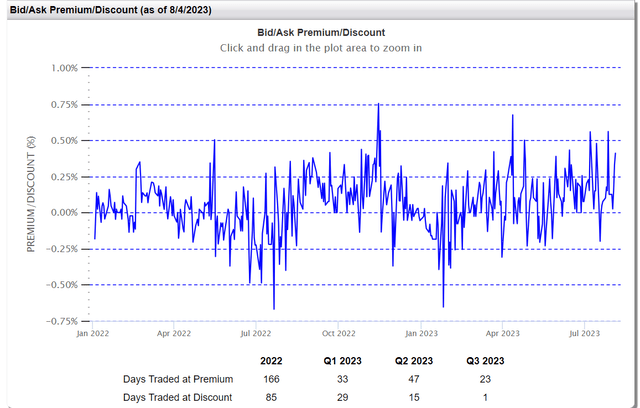
Figure 10 – FTQI trades at a wide bid/ask spread (ftportfolios.com)
Next, comparing returns, we can see the FTQI ETF has the weakest 1Yr return by far, returning only 3.8% compared to 9.1% for the QYLD ETF, 12.4% for the Global X Nasdaq 100 Covered Call & Growth ETF (QYLG), 12.1% for the JEPQ ETF, and 15.6% for the QQQ ETF (Figure 11).
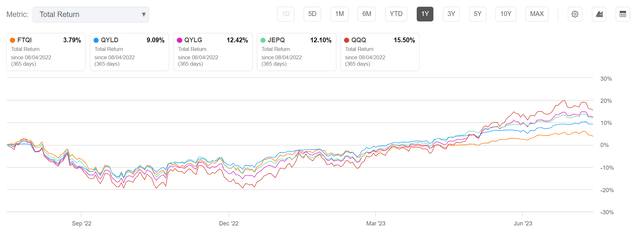
Figure 11 – FTQI vs. peers, 1Yr returns (Seeking Alpha)
On a 3Yr basis, FTQI’s performance is still the weakest, although its underperformance to QYLD is not as pronounced (Figure 12). Readers should note that QYLG’s performance below is shown from its inception date of 09/22/2020 instead of a full 3 years.
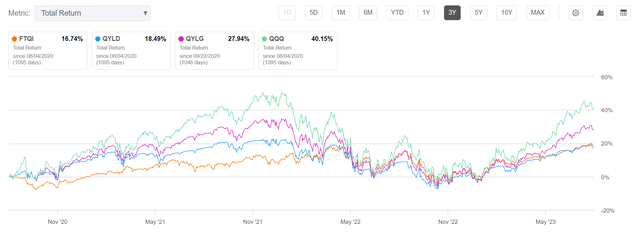
Figure 12 – FTQI vs. peers, 3Yr returns (Seeking Alpha)
Ditto for 5Yr returns, the FTQI ETF lags far behind the QYLD ETF, delivering 1/10th the total returns of the underlying QQQ ETF (Figure 13).
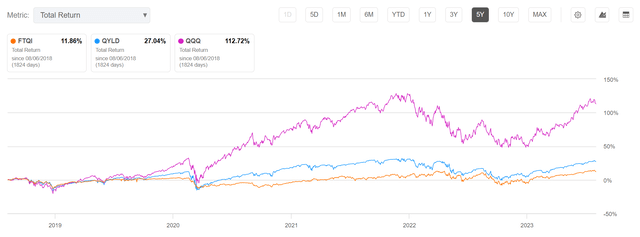
Figure 13 – FTQI vs. peers, 5Yr returns (Seeking Alpha)
In addition to the normal underperformance from call-write strategies, the FTQI ETF appears to further compress returns volatility with its stock selection methodology, leading to very significant underperformance relative to the CBOE Nasdaq-100 BuyWrite Index (an index that models the theoretical returns of a covered call strategy on the Nasdaq 100 Index) over the long-run (Figure 14).
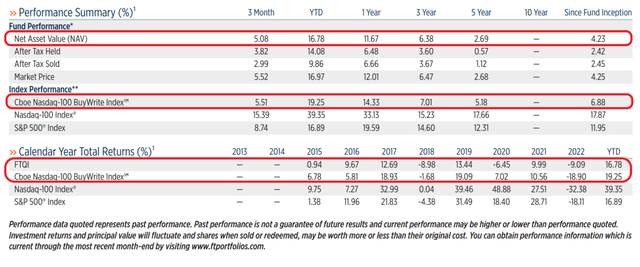
Figure 14 – FTQI lags the CBOE Nasdaq-100 BuyWrite Index (FTQI factsheet)
Finally, comparing the distribution yields of the peers, the FTQI ETF pays a trailing 12 month distribution of 11.5%, compared to 12.0% for QYLD, 5.4% for QYLG, and 11.6% for JEPQ.
Overall, the FTQI ETF appears to be a ‘worst of breed’ call-write fund with high fees and low returns. Its only attractive feature is its high distribution yield. However, since its distribution is far above its total returns, the FTQI is not technically ‘earning’ its distribution.
Conclusion
The First Trust Nasdaq BuyWrite Income ETF is First Trust’s version of a covered call strategy based on the Nasdaq 100 Index.
As I have mentioned in previous articles, for investors seeking exposure to growth stocks while receiving high distribution yields from a call-writing overlay, there are many investment vehicles to choose from.
Comparing the FTQI ETF against peer ETFs, I find that the FTQI ETF is the most expensive while delivering the weakest total returns. It is not surprising that the FTQI has not been able to gain traction, garnering only $58 million in assets after almost a decade in operation.
For call-write strategies based on the Nasdaq 100 Index, instead of the FTQI ETF, I recommend investors consider the high yielding JEPQ ETF or the growth oriented QYLG ETF.
Read the full article here