


We are quickly approaching the next rate shift cycle as the Fed has clearly communicated they are ready to take the policy rate down in the September meeting. Changes in short-term rates are one of the few aspects of markets that are both relatively slow-moving, as shown in the chart below, and relatively easily forecastable. Although we don’t know the ultimate endpoint of today’s short-term rates or the duration of the upcoming rate-cutting cycle, there is a high probability that it is going to start very soon, will last for a couple of years and will push the rate down a couple of percentage points.
FRED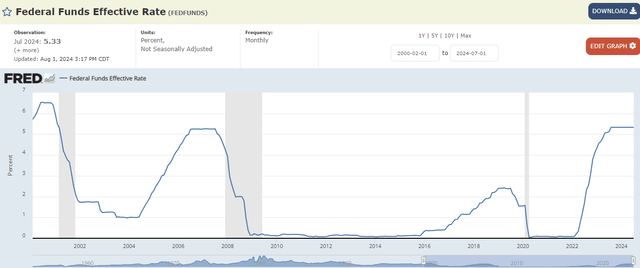
Apart from this being one of the few well-telegraphed moves in financial markets, short-term rates also have an outsized impact on distributions for many investment vehicles popular with retail investors. These include such as closed-end funds (“CEFs”), business development companies (“BDCs”), open-end funds, and others. This means investors who are willing to look out further 12-18 months can start to prepare for likely changes in the distributions today in a proactive rather than reactive way.
What’s also interesting is that there is some evidence of inefficiency in market valuations as they respond to changes in short-term rates. For example, in this past rate-hiking cycle we saw that Loan CEF relative valuations (i.e., loan CEF discounts less the average CEF sector discount) only started to get richer in 2023 once rate hikes started to feed into loan CEF distributions. However, investors who pre-positioned in loan CEFs before distribution hikes were able not only to enjoy the rise in distributions but also the rise in valuations. This was as less informed investors rotated into loan CEFs only when they saw the distribution hikes arrive.
Systematic Income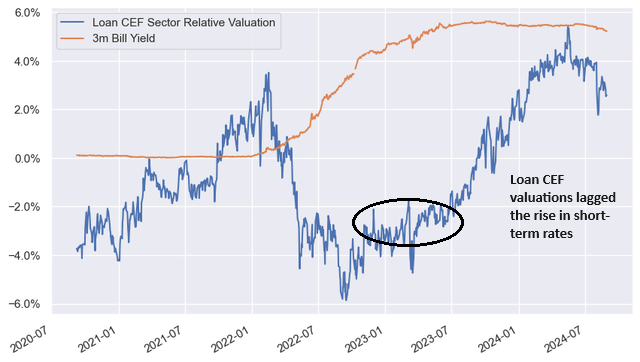
In this article, we take a look at the broader income landscape and see how distributions could evolve over the medium term across different types of investment vehicles.
Starting with CEFs, there are two things to worry about for investors. The first is, obviously, the forward path of distributions due to changes in short-term rates and the other is valuations. While many investors rightly focus on distributions, they should not ignore valuations for two reasons. One, valuation changes can be much more impactful on portfolio wealth than changes in distributions; and two, distributions and valuations are often linked.
For example, the chart below shows what happened to the historic valuations of one previously expensive CEF PGP when its distributions were cut (marked by red lines). Each time distributions were cut, the valuation fell. Investors holding the fund through these periods locked in significant and permanent economic losses. The key takeaway here is that CEFs trading at very tight discounts or even premiums are much more dangerous for long-term wealth than cheaper funds in case of a distribution cut.
Systematic Income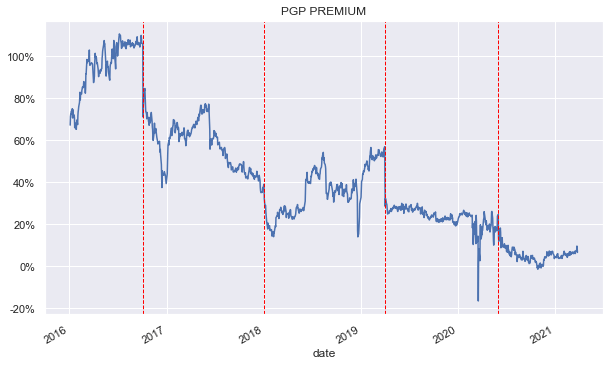
At this point, fixed-income/credit CEF valuations are on the expensive side, as the following chart shows (marked by orange line). This suggests that investors should take a careful look at their portfolio, and particularly at their expensive CEF holdings.
Systematic Income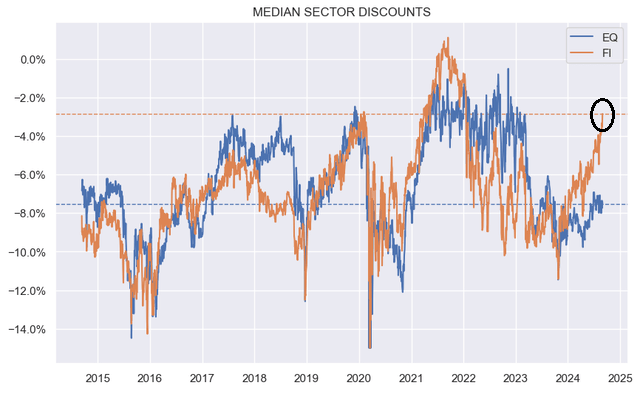
Most leveraged CEFs use floating-rate facilities, and this means that their cost of leverage will come down. However, what’s more important for net investment income is less the cost of leverage than the overall sensitivity of assets and liabilities to the drop in short-term rates. Specifically, leveraged funds with fixed-rate assets and floating-rate liabilities (e.g., muni, preferreds, corporate bond CEFs, etc.) will likely see an increase in net investment income. Assets with primarily floating-rate assets and floating-rate liabilities such as loan CEFs will tend to experience a decline in net investment income.
The following chart shows a normalized distribution path of the loan CEF sector. We can see that it has followed the direction of short-term rates fairly closely, and we expect the same from the next rate-cutting cycle. This is also why we are leaning to fixed-rate asset funds such as muni and preferred CEFs. We don’t expect a lot of distribution hikes in the Muni sector, particularly from Nuveen, Eaton Vance, BlackRock, Invesco, and other managers because they have already made sharp hikes to ward off CEF activists. That said, their net investment income will be moving higher.
Systematic Income CEF Tool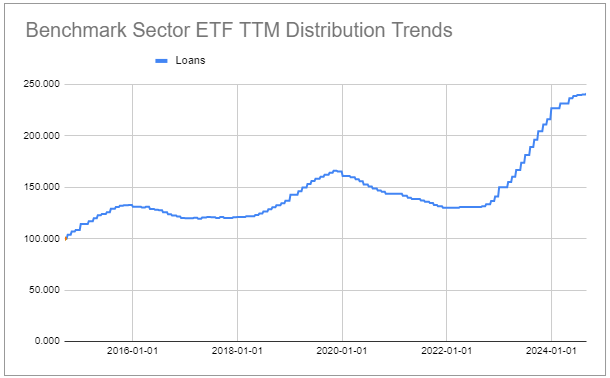
Given the discussion above around loan CEFs, it might seem obvious that we would avoid BDCs. However, that’s not the case. In fact, we have added a number of BDCs to our Income Portfolios in early August, taking advantage of the dip in prices.
BDCs are different from loan CEFs in a few key ways, despite both investment vehicles holding mostly floating-rate assets. One, BDCs, tend to carry significantly higher levels of dividend coverage than loan CEFs; and two, many source income from apart from loan payments such as dividend income, repayment fees, original issue discount, etc.
If we take the BDC Ares Capital (ARCC) as an example, we see that it has consistently maintained high dividend coverage.
Systematic Income BDC Tool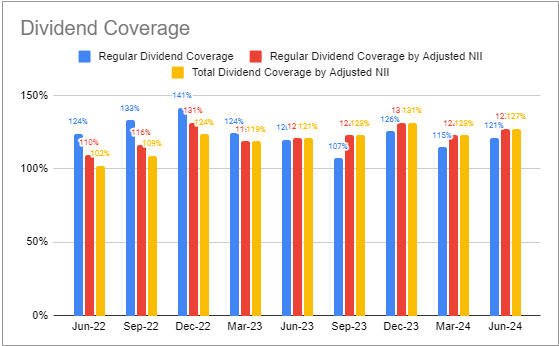
And it has a significant chunk of non-investment income.
Systematic Income BDC Tool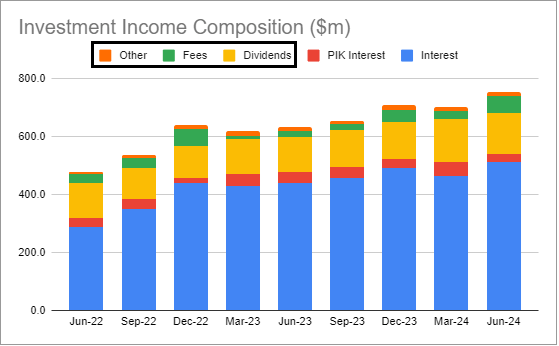
A final point is that many BDCs have recently been swapping their fixed-rate debt to floating rates, which has lowered the sensitivity of their net investment income to the drop in short-term rates. The most recently issued swapped bonds below are highlighted for ARCC.
ARCC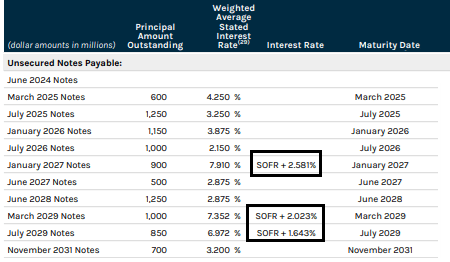
We can get a pretty good sense of how base dividend coverage will evolve because BDCs report their total investment income sensitivity to changes in short-term rates. The following chart shows estimated base dividend coverage after a 2% drop in short-term rates. BBDC is an outlier here on the high side, as its Q2 net investment income rose sharply due to a lack of incentive fee accruals. A more realistic coverage after 2% of cuts would be around 100-110%.
Systematic Income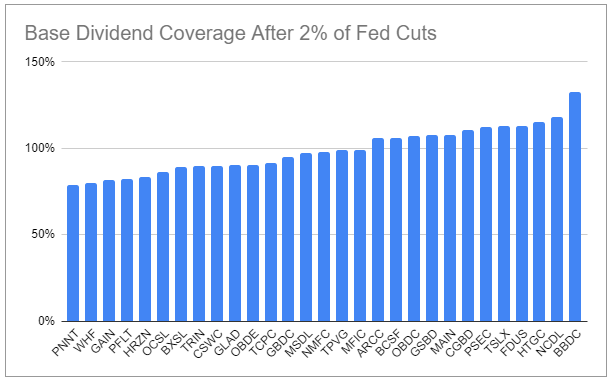
Obviously, investment income can change for other things such as changes in leverage, credit spreads of new holdings, etc. but this provides a good rough idea. It’s also important to keep in mind that many BDCs are distributing sizable special dividends and these dividends will likely be cut, resulting in a drop in total dividends.
Finally, it can make a lot of sense to avoid the possibility of dividend cuts and go with individual fixed-rate bonds or preferreds. These securities don’t have leverage or net investment income to worry about. Their dividends are contractual and, while preferreds’ dividends can be deferred, it’s a rare occasion that they do.
Ideas and Takeaways
Given we appear to be on the cusp of another significant shift in short-term rates, it makes a lot of sense for investors to prepare for this development. One aspect where the shift in short-term rates will make itself felt is in the net investment income of various investment vehicles and, by extent, their distribution levels.
As far as CEFs that will take advantage of falling short-term rates, we like the Flaherty & Crumrine Preferred Income Opportunity Fund (PFO) as well as the Eaton Vance Municipal Bond Fund (EIM), trading at 6.5% and 5.8% distribution rates. PFO has returned around 20% since it was added at the start of the year, but it still has value in our view. EIM also benefits from the tender offer program, which drives additional alpha for shareholders.
We also see value in BDCs with a high level of distribution coverage, which should allow them to maintain the base dividend by the time the Fed is expected to make a pause in the rate-cutting cycle. This includes Nuveen Churchill Direct Lending (NCDL) and the Fidus Investment (FDUS), trading at 12.4% and 11.3% total dividend yields, respectively.
It also makes sense to stick with securities whose dividends or net income are not dependent on the level of interest rates. This includes individual bonds and preferreds. Among others, we see value in the mortgage REIT NYMT 9.125% 2029 bond (NYMTI) as well as the OXLC 8.65% 2030 bond (OXLCI), trading at 9.2% and 8.4% yields, respectively.
Read the full article here