Introduction
Golub Capital (NASDAQ:GBDC) is a BDC widely reputed to be among the most conservative BDCs on the market. It currently sports a 10% dividend yield, which invites us to consider whether it is suitable for a long term buy-and-hold income position, as it would be a portfolio income booster for nearly any portfolio.
BDCs, or Business Development Companies, are required by law to distribute at least 90% of their taxable income as dividends. This restriction limits their ability to retain earnings, making the underwriting and credit quality crucial factors to consider. BDCs with poor underwriting practices often experience a decline in their Net Asset Value [NAV] over time.
Managing BDCs falls to a management team that needs to be compensated. As a result, BDCs charge management fees based on different schedules. It’s important to assess whether a BDC’s fee structure incentivizes the management to act in the best interest of the shareholders.
BDCs specialize in investing in the debt of middle market businesses. These companies are typically too large to rely on traditional bank loans but not big enough to access the bond markets for debt offerings. The loans that BDCs invest in usually come with a coupon rate around prime plus 2-3%. These loans make up the primary assets held by BDCs.
On the other side of their balance sheet, BDCs issue bonds, notes, and/or baby bonds as their liabilities. The interest rates on these instruments vary based on the issuer’s credit rating. By law, BDCs are limited to a maximum debt to equity ratio of 2, although many voluntarily keep their ratios below this limit for better risk management.
These general characteristics of BDCs lay the groundwork for addressing six specific questions regarding GBDC:
- Are the levels of balance sheet leverage reasonably close to a debt to equity ratio of 1?
- Do management and incentive fees align with the interests of shareholders?
- Do Golub Capital’s assets lean towards conservatism, emphasizing senior secured debt instruments preferably with floating rates?
- How has Golub Capital’s credit quality performed in recent years?
- Is there extensive diversification across industries, with a reduced exposure to cyclical sectors of the economy?
- Is Golub Capital competitive in terms of its debt and leverage costs?
Balance Sheet Leverage Is Modest
Prior to 2019, BDCs were constrained to a debt to equity ratio of 1. However, the limit has now been increased to 2, allowing BDCs to leverage up to different extents. The level of leverage adopted by BDCs demonstrates their varying degrees of prudence in pursuing risk.
Considering balance sheet leverage is crucial when assessing the potential decay of Net Asset Value [NAV] over time due to credit losses. Leverage amplifies the impact of credit losses on a BDC’s assets, resulting in corresponding losses on equity, which represents the true ownership of shareholders.
In the chart below, I’ve computed the debt to equity ratio of Golub Capital over the past few years.
| Figures In Thousands | Total Liabilities | Total Equity | Debt to Equity Ratio |
| FY 2015 | 822,556 | 810,870 | 1.014 |
| FY 2016 | 877,684 | 878,825 | 0.999 |
| FY 2017 | 796,230 | 957,946 | 0.831 |
| FY 2018 | 866,698 | 968,854 | 0.895 |
| FY 2019 | 2,172,009 | 2,222,854 | 0.977 |
| FY 2020 | 2,048,091 | 2,396,193 | 0.855 |
| FY 2021 | 2,582,223 | 2,582,692 | 1.000 |
| FY 2022 | 3,136,724 | 2,544,500 | 1.233 |
| Q2 2023 | 3,165,605 | 2,506,145 | 1.263 |
Prior to 2021, the debt to equity ratio was roughly 1, but it has increased to ~1.25 as of now. This means that management has decided to pursue more risk via leveraging up Golub Capital’s balance sheet. If leverage remains at this level in the future, then I would consider Golub Capital to be a reasonably leveraged BDC.
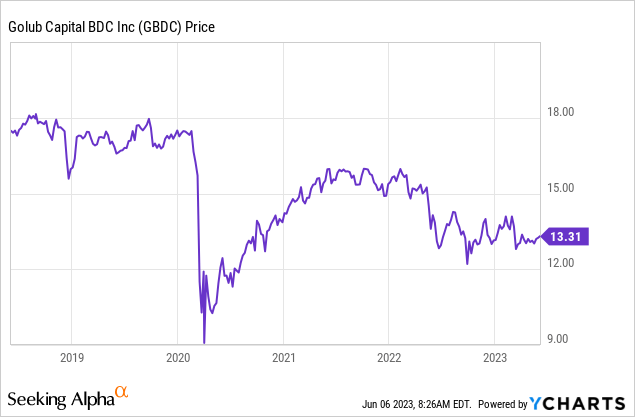
In fact, I believe that the slight share price decline in Golub Capital in 2021 – 2023 is linked to the increase in the risk taken on the balance sheet via increased leverage:

This would appear to be a natural move; given the same amount of equity, increased risk should reduce the share price.
An important item to watch in the future is whether Golub Capital further increases its balance sheet leverage.
Management Aligned With Shareholders
BDC managements charge fees for providing the management services that investors benefit from. Management fees for BDCs typically have two portions: the base asset management fee and the incentive fee. Knowing the structure of these fees is very important to shareholders, as the terms of the fee determine management’s incentives and priorities. We will first take a look at Golub Capital’s fee structure.
Base Management Fee
I will quote directly from the FY 2022 10-K Filing:
Under the Investment Advisory Agreement, the base management fee is calculated at an annual rate equal to 1.375% of our average adjusted gross assets at the end of the two most recently completed calendar quarters…
This means that the first 1.375% returns on gross assets each year are calculated as fees. One thing to notice though is that there is no provision for adjusting the fee based on the level of leverage present in the balance sheet. For instance, Ares Capital (ARCC) does this for assets funded by debt above a debt to equity ratio of 1, where the fee drops from 1.5% of assets to 1.0%, which causes more of the rewards of higher leverage to be accrued to shareholders rather than management.
This means that Golub Capital management is not discouraged from increasing the leverage on the balance sheet by its fee structure, in terms of marginal fees per unit of leverage. Hence, we will have to check later on if Golub management has voluntarily exercised restraint on increasing leverage.
Income And Capital Gains Fee
After the base management fee has been charged, the income and capital gains fee is assessed. This is the fee that incentivizes management as to what level of risk to take in the portfolio overall. The key word to understand here is the “hurdle rate”.
I will quote directly from the FY 2022 10-K Filing:
We calculate the income component of the Income and Capital Gains Incentive Fee Calculation with respect to our Pre-Incentive Fee Net Investment Income quarterly, in arrears, as follows:
- zero in any calendar quarter in which the Pre-Incentive Fee Net Investment Income does not exceed the hurdle rate [2.0% quarterly];
- 100.0% of our Pre-Incentive Fee Net Investment Income with respect to that portion of such Pre-Incentive Fee Net Investment Income, if any, that exceeds the hurdle rate but is less than 2.5% in any calendar quarter.
- 20.0% of the amount of our Pre-Incentive Fee Net Investment Income, if any, that exceeds 2.5% in any calendar quarter.
Let’s translate this back to annual returns for ease of comprehension. The hurdle rate is 8.00%/year. The above states that in order for management to earn an income fee, the portfolio’s weighted average yield needs to exceed 8.00%. Management then keeps all the return between 8.00%/year and 10.00%/year as the fee, and then 20% of the return above 10.00%/year.
This means that the bulk of the income fee is earned by investing the portfolio at 10.00%/year, and then if the aggregate risk taken lets the return exceed that, the vast majority of that benefit goes to the shareholders.
We can see this from the excerpt of an exhibit from the Q2 2023 10-Q filing:
GBDC Portfolio Yield (Q2 2023 10-Q Filing)
There is another incentive fee in the schedule, but since it is insignificant compared to these two, I will not discuss it.
Asset Portfolio Composition
When examining GBDC’s filings, our focus will be on determining the portion of its portfolio dedicated to senior secured debt. This is because within the realm of BDC lending, the senior secured loan is one of most risk-averse assets because its asset backed nature is provides higher potential for principal recovery in the event of borrower default.
To provide a recent reference, here is the relevant exhibit from GBDC’s latest 10-Q report, specifically for Q2 2023:
GBDC Asset Composition (Q2 2023 10-Q Filing)
I also had to look up what a “one stop” loan is: it is a hybrid loan that is first lien and subordinated. All this put together, we have 94.6% of Golub Capital’s asset portfolio invested in first lien loans.
The percentage of loans that are floating rate vs. fixed rate is another important consideration in assessing a BDC. Unfortunately, the Q2 2023 10-Q filing did not specifically specify the percentage. But, I was able to figure this out from a nifty little quote from that filing:
Income yields on senior secured and one stop loans increased for the six months ended March 31, 2023 as compared to the six months ended March 31, 2022, primarily due to rising LIBOR and SOFR rates. Our loan portfolio is partially insulated from a drop in floating interest rates, as 97.2% of the loan portfolio at fair value is subject to an interest rate floor.
Since 97.2% of the loan portfolio is subject to an interest rate floor, we can conclude that virtually all of Golub capital’s loan portfolio is floating rate. This is a good thing: floating rate loans generally have less valuation volatility than fixed rate loans as a result of interest rate changes.
Underwriting Results Over The Business Cycle
Every quarter, BDCs disclose a financial item known as “Net realized and unrealized gains (losses) on investments, foreign currency, and other transactions.” This figure serves as an indication of the credit quality of the loans. Ideally, investors would prefer this value to be minimal in magnitude if it is negative or substantial if positive, signifying appreciation or capital gains.
I will present this value alongside the total equity and calculate the equity appreciation/depreciation ratio. In the case of a well-performing BDC, a higher positive ratio is desirable. This ratio reflects the year-to-year percentage change in the BDC’s net asset value. The dollar amounts provided below are in millions.
| Year | Net Realized And Unrealized Gains (Losses) | Total Equity | Equity Appreciation / (Depreciation) Ratio |
| 2022 | -41,522 | 2,544,500 | -1.63% |
| 2021 | 173,151 | 2,582,692 | 6.70% |
| 2020 | -84,187 | 2,396,193 | -3.51% |
| 2019 | -104,651 | 2,222,854 | -4.71% |
| 2018 | 5,949 | 968,854 | 0.61% |
| 2017 | 12,742 | 957,946 | 1.33% |
| 2016 | 4,224 | 878,825 | 0.48% |
| 2015 | 11,794 | 810,870 | 1.45% |
| 2014 | 8,853 | 732,739 | 1.21% |
| 2013 | 2,125 | 658,236 | 0.32% |
| Average | 0.23% |
Over approximately the last business cycle, the average rate of change of equity was 0.23%/year, due to appreciation of capital overall. There was some volatility in the ratio in 2019 unrelated to COVID-19, which may be somewhat of a red flag. However, on the whole, GBDC is capable of protecting shareholder capital over a business cycle.
This is welcome knowledge for those who wish to buy and hold GBDC long term.
Portfolio Generally Diversified By Industry
As a general rule, we should want a BDC we invest in to be concentrated away from cyclical industries. This is because during a cyclical downturn, it is highly likely that those loans will become distressed simultaneously. An example of this occurring is in 2014-2015 when oil prices dropped as a result of US overproduction: BDCs suffered losses in their energy sector investments.
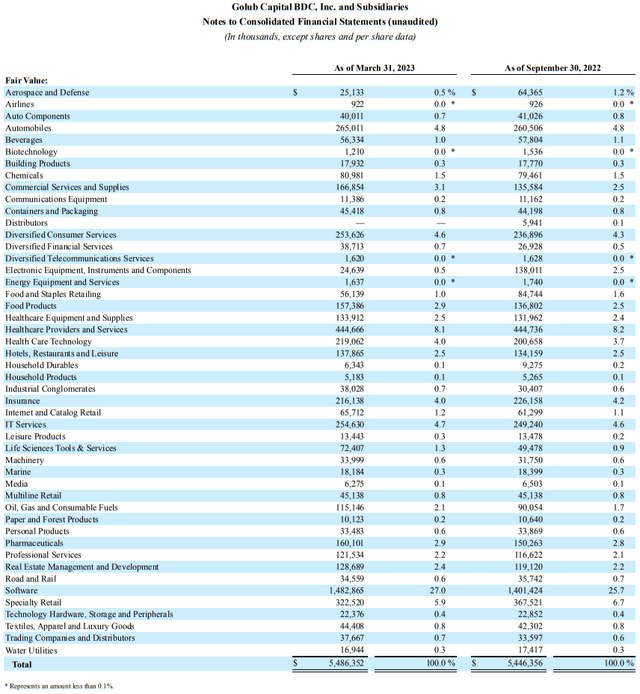
I’ve included the exhibit from the relevant Q2 2023 10-Q filing below (you can enlarge it by clicking on it). It is a monster of a chart, so I’ll summarize the main points here. Yes, it’s true that Golub Capital is diversified, but there are pockets of concentration:
- Software: 27.0%
- Healthcare Providers and Services: 8.1%
- Automobiles: 4.8%
- IT Services: 4.7%
And so on. Fortunately, none of these are cyclical industries. Therefore we can conclude that Golub is largely protected from cyclical downturns in its portfolio.
GBDC Diversification By Industry (Q2 2023 10-Q Filing)
Golub Capital’s Leverage Cost
To avoid delving into excessive detail and numerical comparisons of Golub Capital’s bonds and notes with those of other BDCs, I will compare Golub Capital’s overall cost of liabilities with the yield for AAA corporate bonds, with the data extracted from FRED. Simplifying the assessment, the cost of liabilities for Golub Capital can be calculated by dividing its interest expense by its total liabilities.
| Figures in thousands | Interest Expense | Total Liabilities | Cost of Liabilities | Average AAA Bond Yield (FRED) |
| 2022 | 89,378 | 3,136,724 | 2.85% | 4.07% |
| 2021 | 65,739 | 2,582,223 | 2.55% | 2.70% |
| 2020 | 74,858 | 2,048,091 | 3.66% | 2.48% |
| 2019 | 43,531 | 2,172,009 | 2.00% | 3.39% |
| 2018 | 33,174 | 866,698 | 3.83% | 3.93% |
| 2017 | 31,534 | 796,230 | 3.96% | 3.74% |
| 2016 | 27,724 | 877,684 | 3.16% | 3.67% |
| 2015 | 24,510 | 822,556 | 2.98% | 3.89% |
Golub Capital’s liabilities cost less than the average AAA bond yield! This is a truly remarkable feat for a BDC to achieve.
Conclusions & Summary
Golub Capital possesses 6 of the most desirable qualities in a BDC for a long-term buy and hold income position.
- Balance sheet leverage remains at levels generally close to a debt to equity ratio of 1, though given the recent increase we want to watch out for if management continues to increase leverage.
- Management fees mean that the management is mostly in alignment with shareholders – keep in mind that the base management fee does not leave shareholders extra return if management reaches for yield, something that needs to be watched.
- Golub Capital’s balance sheet assets are almost entirely composed of senior secured loans, which is the most conservative way for a BDC to invest.
- Golub Capital has had some unusual volatility in its credit quality in 2019 unrelated to COVID, but aside from that red marker, on the whole from 2015-2022, Golub has successfully preserved shareholder capital.
- Golub is widely diversified across various industries, except for a few spots of concentration in non-cyclical industries such as software and health care services.
- I believe that Golub Capital has the lowest cost of liabilities / leverage of all BDCs out there; their cost is less than the average yield on AAA corporate debt.
Golub capital appears a very suitable candidate for a long-term buy and hold income investor.
I hope you enjoyed this article and hope to hear from you in the comments!
Read the full article here


