

Investment Thesis
First Trust NASDAQ Clean Edge Smart Grid Infrastructure Index Fund ETF (NASDAQ:GRID) warrants a buy rating due to its strong performance compared to peer ETFs, the expected growth of renewable energy infrastructure, and the solid potential of its holdings. While the United States has made notable investments in clean energy, the European Union has seen very significant growth in its clean energy infrastructure. GRID is uniquely postured to take advantage of this growth based on the mix of its current holdings.
Fund Overview and Compared ETFs
GRID is an ETF that seeks to track the performance in the grid and electric energy infrastructure sector. With an inception in 2009, the fund has 101 holdings and $808M in AUM. The fund predominantly consists of companies that focus on electrical components (29.00%), diversified industrials (11.50%), and conventional electricity (11.04%). GRID is rebalanced quarterly to meet its objectives.
Two ETFs utilized for comparison purposes with GRID are VanEck’s Low Carbon Energy ETF (SMOG) and iShares U.S. Infrastructure ETF (IFRA). SMOG works to track the MVIS Global Low Carbon Energy Index and IFRA attempts to capture the performance of U.S. infrastructure companies. While not specifically tied to clean energy, IFRA is included for comparison purposes for the performance of infrastructure-related equities.
Clean Energy Industry Growth
The global renewable energy market is expected to grow at a 17.2% CAGR between 2024 and 2030. In the U.S. specifically, a 15.7% CAGR is expected through 2030. Clean energy infrastructure has seen significant recent investment under the Biden Administration. In May 2023, $11B in grants and loans were made available to help providers with renewable energy, particularly in rural areas.
U.S. Renewable Energy Compound Annual Growth Rate (www.grandviewresearch.com)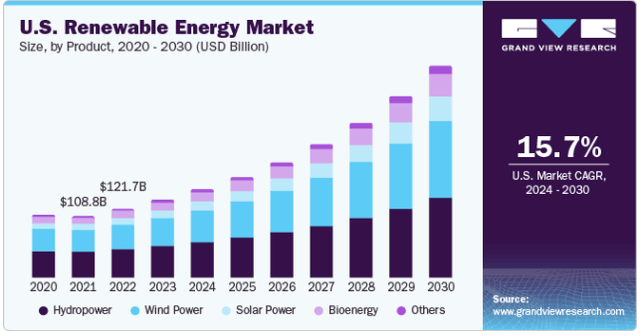
While renewable energy companies might applaud this direction in the U.S., many of GRID’s top holdings are European companies. In the EU, clean energy has been a top priority with 22.5% of the energy consumed in 2022 coming from renewable sources.
Furthermore, the European renewable power capacity in the 2022-2027 five-year timeframe is expected to be twice as much as 2017-2022. This growth is only expected to continue with solar and wind constituting much of the growth. Therefore, an ETF that is focused on capturing this growth, particularly with European holdings, will likely do well over the next years.
Performance, Expense Ratio, and Dividend Yield
GRID has seen a 10-year CAGR of 11.69%. This surpasses SMOG at only a 7.41% 10-year CAGR and IFRA with a 9.27% CAGR since its inception in 2018. GRID does have a relatively high expense ratio at 0.58% but this is roughly on par with compared ETFs, SMOG (0.61%) and IFRA (0.30%).
10-Year Price Return for GRID and Compared ETFs (Seeking Alpha)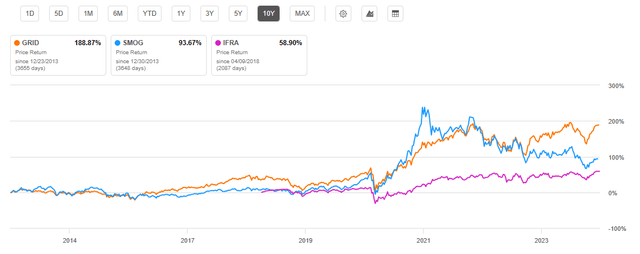
Investors in GRID will enjoy a modest dividend yield of 1.25%, but lower than SMOG, IFRA, or the S&P 500 index dividend yield. Despite this lower yield, the 5-year dividend growth CAGR for GRID is over 20%.
Expense Ratio, AUM, and Dividend Yield Comparison
|
GRID |
SMOG |
IFRA |
|
|
Expense Ratio |
0.58% |
0.61% |
0.30% |
|
AUM |
$808M |
$161M |
$2.25B |
|
Dividend Yield TTM |
1.25% |
1.62% |
1.98% |
|
Dividend Growth 5 YR CAGR |
20.92% |
39.07% |
6.76% |
Source: Seeking Alpha, 26 Dec 23
GRID Holdings and Its Competitive Advantage
GRID has multiple strong holdings to take advantage of the growing clean energy infrastructure industry. Its top holdings are predominantly European companies including ABB Ltd (OTCPK:ABBNY), a Swiss electric energy and renewable power company. GRID also has holdings with high growth potential such as Schneider Electric (OTCPK:SBGSF) and Eaton Corporation (ETN) which I will dive into further detail later.
Top 10 Holdings for GRID and Compared ETFs
|
GRID – 101 Holdings |
SMOG – 72 Holdings |
IFRA – 159 Holdings |
|
ABB Ltd – 8.13% |
Tesla – 8.12% |
Century Aluminum – 0.85% |
|
Schneider Electric – 8.07% |
NextEra Energy – 7.56% |
Enviri Corp. – 0.81% |
|
Eaton Corporation – 7.81% |
Iberdrola Sa – 6.89% |
Sterling Infrastructure – 0.76% |
|
National Grid PLC – 7.72% |
Enel Spa – 6.45% |
U.S. Steel Corp – 0.76% |
|
Johnson Control Intl – 7.12% |
Vestas Wind Systems – 6.10% |
Worthington Enterprises – 0.74% |
|
Quanta Services – 4.23% |
Byd Co Ltd – 5.01% |
Allete Inc. – 0.74% |
|
Aptiv Plc – 4.00% |
Li Auto Inc – 4.41% |
Hawaiian Electric – 0.73% |
|
Samsung SDI Co. – 3.41% |
Samsung Sdi Co Ltd – 3.63% |
One Gas Inc. – 0.73% |
|
Enphase Energy – 3.38% |
Enphase Energy – 3.23% |
Chesapeake Utilities – 0.72% |
|
Hubbell Incorporated – 3.16% |
First Solar Inc. – 2.67% |
Unitil Corp. – 0.71% |
Source: Multiple, compiled by author on 26 Dec 23
All ETF investors know that the performance of the fund is tied to the performance of each individual holding. GRID has multiple individual holdings that have strong potential to take advantage of the EU’s renewable energy infrastructure growth. Two of these key holdings are Schneider Electric and Eaton Corporation.
Schneider Electric
The first strong ingredient for GRID is Schneider Electric. This French energy management company has solid growth and profitability metrics to take advantage of the growing market in the European Union. For example, it has seen a 14.5% YoY revenue growth with a 16.9% YoY EBITDA growth. It is also very profitable with a 41% gross profit margin and 11% net income margin. Founded back in the 1800s, Schneider Electric has also been awarded with Corporate Knights’ Global 100 list of most sustainable corporations 12 times in a row.
Eaton Corporation
The second example of a strong holding is Ireland-based Eaton Corporation. This power management company has demonstrated a 12% YoY revenue growth and 22.9% YoY EBITDA growth. The company is also very profitable with a 35% gross profit margin and 13.2% net income margin. ETN also offers a 1.43% dividend yield that appears safe with a 39% payout ratio. By providing electric power distribution to both the American and international markets, Eaton is well postured to take advantage of renewable energy growth.
Valuation and Risks to Investors
GRID is currently trading at $104.99 at the time of writing this article. This price is approximately 3% below its all-time high and upper limit of the 52-week range of $107.86 achieved back in July 2023. YTD, GRID is up approximately 20%. This is higher than infrastructure ETF, IFRA, as well as clean energy ETF, SMOG. However, all ETFs examined still underperformed the S&P 500 index so far this year.
Year-to-Date Price Return for GRID and Compared ETFs (Seeking Alpha)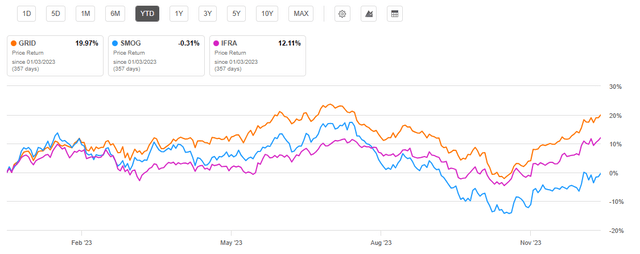
Despite GRID’s strong potential performance of its holdings, it displays valuation metrics notably higher than peer ETFs examined. For example, Eaton’s valuation is high with a forward P/E GAAP 33% higher than its sector median. Schneider Electric is also high at 12% higher than its sector median and over 90% higher than its sector median’s price/sales ratio. Therefore, one can reasonably conclude that GRID could be slightly overvalued. Because of its strong YTD return and current high valuation for multiple of its holdings, GRID may experience modest returns in 2024. However, given clean infrastructure industries growth, I expect the fund to continue providing at least its historic CAGR over the long term.
Valuation Metrics for GRID and Peer Competitors
|
GRID |
SMOG |
IFRA |
|
|
P/E ratio |
18.96 |
16.17 |
13.63 |
|
P/B ratio |
2.78 |
2.29 |
1.79 |
Source: Compiled by Author from Multiple Sources, 26 Dec 23
Although the clean energy infrastructure industry is relatively stable, the fund is not without risks. GRID has a 3-year beta of 1.25 and a standard deviation of 23.29%. This indicates volatility greater than other comparable ETFs. SMOG has a 3-year beta of 1.13 compared to the S&P 500 index and a standard deviation of 27.88%. IFRA has a 3-year beta of 1.02 compared to the S&P 500 and a standard deviation of 20.52%.
Given the international diversification of GRID’s holdings, a primary risk factor for the fund is geopolitical risk. However, this risk may present upsides as well. For instance, Russia’s invasion of Ukraine and subsequent reduction in natural gas exportation to Europe only drove calls for increased renewable energy sources. For example, Denmark and Norway proposed major wind power initiatives to provide electricity to the rest of Europe in response to the Russian invasion.
Concluding Summary
GRID is an ETF that warrants a buy rating for investors looking to take advantage of the clean energy infrastructure industry’s expected growth. While the United States has made modest steps towards clean energy investment, the European Union is seeing major growth. GRID’s holdings mix posture the fund to take advantage of this growth. Downsides for the fund are its current valuation, which is a bit high, its mediocre dividend yield, and relatively high expense ratio. Despite these downsides, the fund has low risk given the global trend towards clean, renewable energy. For now, this trend appears to be a stable, safe bet.
Editor’s Note: This article discusses one or more securities that do not trade on a major U.S. exchange. Please be aware of the risks associated with these stocks.
Read the full article here