


This monthly article series shows a dashboard with aggregate industry metrics in healthcare. It may also serve as a top-down analysis of sector ETFs like the iShares U.S. Healthcare ETF (IYH) and the Health Care Select Sector SPDR ETF (XLV), whose largest holdings are used to calculate these metrics. This month’s post reviews a less popular fund: the Global X Genomics & Biotechnology ETF (NASDAQ:GNOM).
Shortcut
The next two paragraphs in italic describe the dashboard methodology. They are necessary for new readers to understand the metrics. If you are used to this series or if you are short of time, you can skip them and go to the charts.
Base Metrics
I calculate the median value of five fundamental ratios for each industry: Earnings Yield (“EY”), Sales Yield (“SY”), Free Cash Flow Yield (“FY”), Return on Equity (“ROE”), Gross Margin (“GM”). The reference universe includes large companies in the U.S. stock market. The five base metrics are calculated on trailing 12 months. For all of them, higher is better. EY, SY and FY are medians of the inverse of Price/Earnings, Price/Sales and Price/Free Cash Flow. They are better for statistical studies than price-to-something ratios, which are unusable or non available when the “something” is close to zero or negative (for example, companies with negative earnings). I also look at two momentum metrics for each group: the median monthly return (RetM) and the median annual return (RetY).
I prefer medians to averages because a median splits a set in a good half and a bad half. A capital-weighted average is skewed by extreme values and the largest companies. My metrics are designed for stock-picking rather than index investing.
Value and Quality Scores
I calculate historical baselines for all metrics. They are noted respectively EYh, SYh, FYh, ROEh, GMh, and they are calculated as the averages on a look-back period of 11 years. For example, the value of EYh for healthcare providers in the table below is the 11-year average of the median Earnings Yield in this industry.
The Value Score (“VS”) is defined as the average difference in % between the three valuation ratios (EY, SY, FY) and their baselines (EYh, SYh, FYh). The same way, the Quality Score (“QS”) is the average difference between the two quality ratios (ROE, GM) and their baselines (ROEh, GMh).
The scores are in percentage points. VS may be interpreted as the percentage of undervaluation or overvaluation relative to the baseline (positive is good, negative is bad). This interpretation must be taken with caution: the baseline is an arbitrary reference, not a supposed fair value. The formula assumes that the three valuation metrics are of equal importance.
Current data
The next table shows the metrics and scores as of last week’s closing. Columns stand for all the data named and defined above.
|
VS |
QS |
EY |
SY |
FY |
ROE |
GM |
EYh |
SYh |
FYh |
ROEh |
GMh |
RetM |
RetY |
|
|
HC Equipment |
-44.15 |
-16.18 |
0.0174 |
0.1904 |
0.0115 |
8.68 |
65.17 |
0.0307 |
0.2634 |
0.0298 |
13.29 |
63.68 |
-7.96% |
1.66% |
|
HC Providers |
7.30 |
-8.68 |
0.0508 |
1.4809 |
0.0734 |
15.94 |
19.88 |
0.0519 |
1.3970 |
0.0622 |
15.83 |
24.26 |
-0.57% |
0.35% |
|
Pharma/Biotech |
-7.35 |
2.74 |
0.0370 |
0.2143 |
0.0282 |
23.82 |
77.78 |
0.0365 |
0.2345 |
0.0331 |
21.83 |
80.73 |
1.05% |
-0.79% |
|
Life Science Tools |
-16.68 |
1.24 |
0.0291 |
0.1804 |
0.0250 |
15.55 |
57.95 |
0.0290 |
0.2745 |
0.0298 |
16.07 |
54.82 |
1.57% |
-8.13% |
Value and Quality chart
The next chart plots the Value and Quality Scores by industry (higher is better).
Value and quality in healthcare (Chart: author; data: Portfolio123)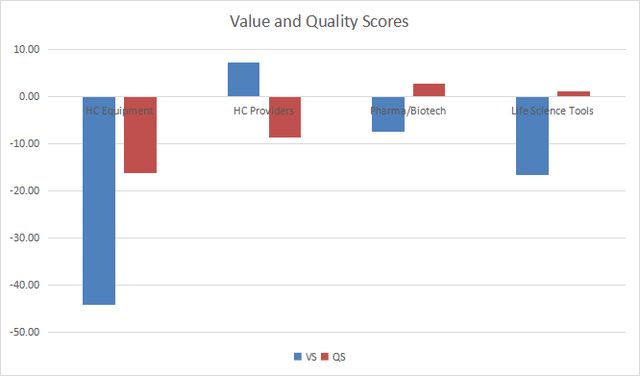
Evolution since last month
The most notable change is a deterioration of value score in pharmaceuticals/biotechnology.
Variations in value and quality (Chart: author; data: Portfolio123)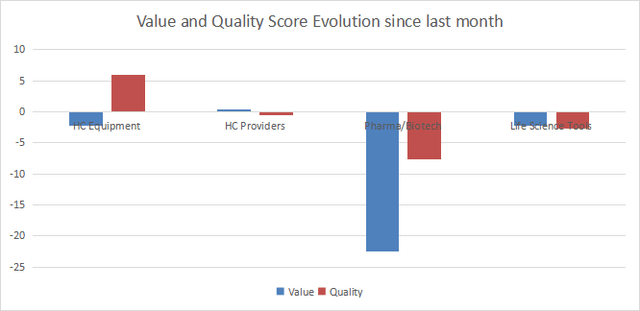
Momentum
The next chart plots momentum scores based on median returns.
Momentum in healthcare (Chart: author; data: Portfolio123)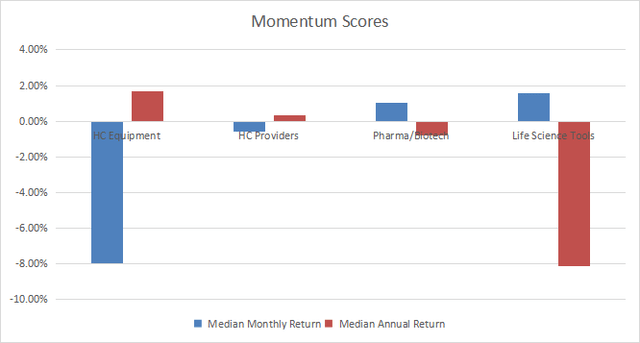
Interpretation
Two subsectors still have fair value and quality scores: healthcare providers and pharmaceuticals/biotechnology. The former is undervalued by about 7% relative to 11-year averages, and quality is a bit below the historical baseline. The latter is slightly overvalued and has a quality score close above the baseline. Life science tools are moderately overvalued. Healthcare equipment is the worst-looking subsector regarding both value and quality scores.
Fast facts on GNOM
Genomics is a very promising fields in the pharma/biotech industry. The Global X Genomics & Biotechnology ETF (GNOM) was launched on 04/05/2019 to provide exposure to innovative companies in genomics and genetic medicine. Its total expense ratio is similar to the iShares Biotechnology ETF (IBB): 0.50% vs. 0.45%. Both are significantly more expensive than the sector benchmark XLV (0.10%).
As described by Global X ETFs, companies are screened based on revenue exposure to one of the following business operations: gene editing, genomic sequencing, development and testing of genetic medicine/therapies, computational genomics and genetic diagnostics. Companies that derive at least 50% of revenue from these operations are eligible for the index. Other companies that are classified as “Biotechnology” by FactSet are further reviewed and analyzed based on R&D expenditures, product pipeline, and operating business segments. Those companies with exposure to the genomics related business activities are also eligible for the index.
Then, eligible companies of both sets described above are ranked together by a score based on an NLP algorithm (natural language processing) that evaluates publicly available information such as financial websites, search engines, and company publications. The 40 highest ranking companies constitute the final index.
As of writing, GNOM holds 41 stocks. The portfolio is quite concentrated: the aggregate weight of the top 10 holdings is 43.6% (list below).
|
Ticker |
Name |
Weight% |
EPS growth %TTM |
P/E TTM |
P/E fwd |
Yield% |
|
PACB |
Pacific Biosciences of California, Inc. |
4.81 |
-47.29 |
N/A |
N/A |
0 |
|
NTRA |
Natera, Inc. |
4.68 |
20.62 |
N/A |
N/A |
0 |
|
NTLA |
Intellia Therapeutics, Inc. |
4.53 |
-1.99 |
N/A |
N/A |
0 |
|
TECH |
Bio-Techne Corp. |
4.47 |
6.55 |
47.80 |
42.43 |
0.38 |
|
SRPT |
Sarepta Therapeutics, Inc. |
4.25 |
-75.69 |
N/A |
N/A |
0 |
|
CRSP |
CRISPR Therapeutics AG |
4.24 |
35.54 |
N/A |
N/A |
0 |
|
1548 HK |
GENSCRIPT BIOTECH CORP |
4.23 |
||||
|
QGEN |
Qiagen N.V. |
4.13 |
-34.28 |
29.90 |
21.05 |
0 |
|
VCYT |
Veracyte, Inc. |
4.13 |
41.33 |
N/A |
N/A |
0 |
|
TXG |
10x Genomics, Inc. |
4.11 |
-18.08 |
N/A |
N/A |
0 |
Since 06/11/2019, GNOM has underperformed its main competitors:
- iShares Genomics Immunology and Healthcare ETF (IDNA)
- Invesco Dynamic Biotechnology & Genome ETF (PBE)
As reported in the next chart, it has also lagged the sector benchmark XLV, and the industry benchmark IBB. Price history may be too short to assess the strategy on past performance, but for an investor looking for a genomics ETF, PBE shows a better return with a lower volatility. Moreover, as a software engineer with a certification in machine learning, I think the fund’s strategy makes a questionable use of NLP: public information may be biased by marketing content and company self-descriptions.
GNOM vs. IDNA, PBE, XLV, IBB (Seeking Alpha)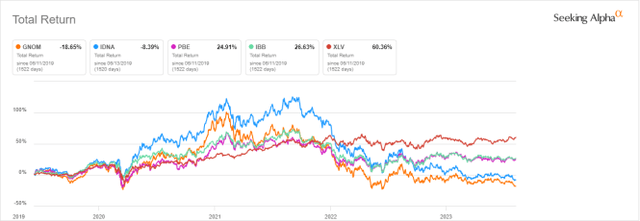
Dashboard List
I use the first table to calculate value and quality scores. It may also be used in a stock-picking process to check how companies stand among their peers. For example, the EY column tells us that a large pharma/biotech company with an Earnings Yield above 0.0370 (or price/earnings below 27.03) is in the better half of the industry regarding this metric. Here is our Dashboard List with the most profitable companies standing in the better half among their peers regarding the three valuation metrics at the same time (the list was made several weeks ago based on data available at the time).
|
DVAX |
Dynavax Technologies Corp. |
|
PFE |
Pfizer Inc. |
|
INVA |
Innoviva, Inc. |
|
HRMY |
Harmony Biosciences Holdings, Inc. |
|
WAT |
Waters Corp. |
|
CCRN |
Cross Country Healthcare, Inc. |
|
MOH |
Molina Healthcare, Inc. |
|
AMN |
AMN Healthcare Services, Inc. |
|
DVA |
DaVita, Inc. |
|
THC |
Tenet Healthcare Corp. |
It is a rotational list with a statistical bias toward excess returns on the long-term, not the result of an analysis of each stock.
Read the full article here