

Investment Thesis
The objective of today’s article is to show you how you could allocate $15,000 among two exchange-traded funds, or ETFs, as well as my top 10 dividend growth companies that I have selected for this month of June.
In order to help you achieve a higher extra income in the form of dividends from today onwards, I have included two ETFs. I believe they are particularly attractive since they offer an attractive Dividend Yield [TTM], and have shown an attractive Dividend Growth Rate [CAGR] over the past 5 years. For these reasons, I believe that this portfolio can be attractive not only for dividend growth investors but also for dividend income investors.
I have further ensured that those companies, which I believe are specifically attractive when it comes to risk and reward, are overweighted in this investment portfolio. This is to increase the likelihood of you achieving excellent investment results over the long term.
The following are the two ETFs that are part of this investment portfolio:
- Schwab U.S. Dividend Equity ETF (SCHD)
- iShares Select Dividend ETF (DVY).
The following are my top 10 dividend growth companies that I have selected for June 2023:
- Apple (AAPL)
- BlackRock (BLK)
- Canadian Natural Resources Limited (CNQ)
- Goldman Sachs (GS)
- JPMorgan (JPM)
- Mastercard (MA)
- Microsoft (MSFT)
- Nasdaq (NDAQ)
- The Charles Schwab Corporation (SCHW)
- Union Pacific Corporation (UNP).
Overview of the 10 selected Picks for June 2023, the two selected ETFs and the Portfolio Allocation
|
Company Name |
Sector |
Industry |
Country |
Dividend Yield [TTM] |
Dividend Growth 5Y |
Allocation |
Amount in $ |
|
Apple |
Information Technology |
Technology Hardware, Storage and Peripherals |
United States |
0.54% |
7.26% |
4% |
600 |
|
BlackRock |
Financials |
Asset Management and Custody Banks |
United States |
2.97% |
13.60% |
5% |
750 |
|
Canadian Natural Resources Limited |
Energy |
Oil and Gas Exploration and Production |
Canada |
4.12% |
21.83% |
2% |
300 |
|
JPMorgan Chase & Co. |
Financials |
Diversified Banks |
United States |
2.93% |
12.91% |
3% |
450 |
|
Mastercard |
Financials |
Transaction & Payment Processing Services |
United States |
0.57% |
17.66% |
3% |
450 |
|
Microsoft |
Information Technology |
Systems Software |
United States |
0.84% |
10.02% |
4% |
600 |
|
Nasdaq |
Financials |
Financial Exchanges and Data |
United States |
1.47% |
9.57% |
2% |
300 |
|
The Charles Schwab Corporation |
Financials |
Investment Banking and Brokerage |
United States |
1.78% |
21.16% |
2% |
300 |
|
The Goldman Sachs Group |
Financials |
Investment Banking and Brokerage |
United States |
2.94% |
25.93% |
3% |
450 |
|
Union Pacific Corporation |
Industrials |
Rail Transportation |
United States |
2.65% |
14.83% |
2% |
300 |
|
Schwab U.S. Dividend Equity ETF |
ETFs |
ETFs |
United States |
3.75% |
15.56% |
40% |
6000 |
|
iShares Select Dividend ETF |
ETFs |
ETFs |
United States |
3.88% |
7.00% |
30% |
4500 |
|
3.12% |
11.67% |
100% |
15000 |
Source: The Author, data from Seeking Alpha.
Portfolio Allocation per Company/ETF
The following two ETFs represent the highest proportion of the investment portfolio, which I am presenting in today’s article:
- Schwab U.S. Dividend Equity ETF (40%)
- iShares Select Dividend ETF (30%).
A number of reasons have contributed to giving these two ETFs the highest proportion of the overall portfolio.
Since I aim to show you the portfolio allocation among my top 10 dividend growth stocks for June 2023, I wanted to raise the portfolio’s Weighted Average Dividend Yield [TTM]. This is the case as the majority of these dividend growth companies have a relatively low Dividend Yield [TTM] (the 10 selected picks have an Average Dividend Yield [TTM] of 2.08%).
By providing the Schwab U.S. Dividend Equity ETF (40%) and the iShares Select Dividend ETF (30%) with the highest proportion of this portfolio, the extra amount of money you can receive via dividends increases from today, thus making this portfolio appealing for dividend income investors as well as for dividend growth investors.
I have further given the Schwab U.S. Dividend Equity ETF an even higher proportion (40%) than the iShares Select Dividend ETF (30%). This is because it has shown a higher Dividend Growth Rate [CAGR] over the past 5 years (15.56% compared to 7.00%). By doing this, it helps us to raise the Weighted Average Dividend Growth Rate of this investment portfolio.
Another reason why I overweighted the two selected ETFs in this portfolio is that by doing so, we increase the diversification while reducing its risk level at the same time.
In addition to that, it can be highlighted that, as we will see in the following, no individual position has a proportion of more than 5% of the overall portfolio. Once again, this helps us to reduce the risk level, and with this, to raise the probability of achieving excellent investment results when investing over the long term.
The following companies represent the largest individual positions of this investment portfolio:
- BlackRock (5%)
- Apple (4%)
- Microsoft (4%)
- JPMorgan (3%)
- Mastercard (3%)
- The Goldman Sachs Group (3%).
BlackRock represents the largest individual position with 5% of the overall portfolio.
I selected BlackRock as the individual position with the highest proportion, since the company provides investors with an attractive Dividend Yield [TTM] of 2.97% while having shown an attractive Dividend Growth Rate [CAGR] of 13.60% over the past 5 years. In addition to that, I believe that the risks for BlackRock investors are relatively low and the reward (in form of the expected rate of return) is attractive. This makes BlackRock an attractive choice for investors in my opinion.
I also believe it makes sense to overweight Apple and Microsoft in this investment portfolio, since I think that both companies are particularly attractive for investors when considering risk and reward. Both have strong competitive advantages (in the form of a high brand value, their own ecosystem and their broad product diversification) and are financially extremely healthy (both have an Aaa credit rating from Moody’s). This makes me believe that you should, with a high probability, obtain an attractive Internal Rate of Return by investing in these companies over the long term.
I also believe that JPMorgan (3%), Mastercard (3%) and The Goldman Sachs Group (3%) are attractive for investors when it comes to risk and reward. This is why they also get a relatively high proportion of this investment portfolio.
The following companies represent the smallest proportion of this investment portfolio:
- Canadian Natural Resources Limited (2%)
- Nasdaq (2%)
- The Charles Schwab Corporation (2%)
- Union Pacific Corporation (2%).
Due to the fact that each of these picks only have a proportion of 2% of the overall portfolio, the impact they have would be lower. This also means that a potential stock decline of one of these picks would have a lower negative impact on the Total Return of your portfolio.
Illustration of the Portfolio Allocation per Company/ETF
Source: The Author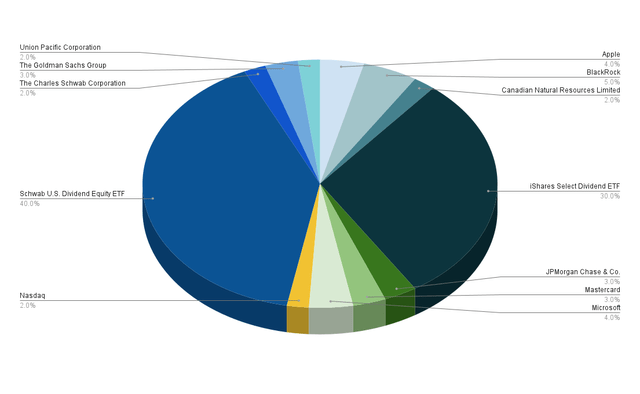
Portfolio Allocation per Sector
The two selected ETFs have the highest proportion of this investment portfolio: while the Schwab U.S. Dividend Equity ETF represents 40%, the iShares Select Dividend ETF makes up 30%. This implies that when combined, both represent 70% of the portfolio.
Beside the ETFs, the Financials Sector makes up the highest percentage of the overall portfolio (18%). This sector is represented by BlackRock (5%), JPMorgan (3%), Mastercard (3%), The Goldman Sachs Group (3%), Nasdaq (2%) and The Charles Schwab Corporation (2%).
Meanwhile, the Information Technology Sector represents 8%. The sector is represented by Apple and Microsoft, which each hold 4% of the total portfolio.
A smaller percentage of the overall portfolio is held by the Energy Sector (with Canadian Natural Resources holding 2%) and the Industrials Sector (with Union Pacific Corporation holding 2% of the overall portfolio).
Due to the fact that no Sector represents more than 18% of the total portfolio, we can deduce that we have reached a broad diversification over Sectors.
Illustration of the Portfolio Allocation per Sector when allocating SCHD and DVY to the ETF Sector
The graphic below shows the portfolio allocation per sector when allocating both the Schwab U.S. Dividend Equity ETF and the iShares Select Dividend ETF to the ETF Sector.
Source: The Author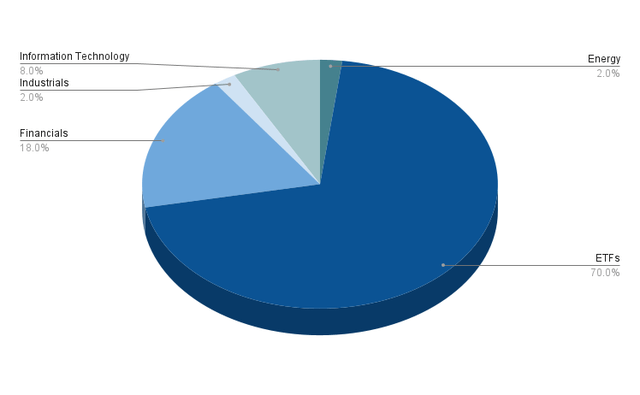
Below you can find the list of companies/ETFs that belong to each sector.
ETFs (70%)
- Schwab U.S. Dividend Equity ETF (40%)
- iShares Select Dividend ETF (30%)
Financials (18%)
- BlackRock (5%)
- JPMorgan (3%)
- Mastercard (3%)
- The Goldman Sachs Group (3%)
- Nasdaq (2%)
- The Charles Schwab Corporation (2%)
Information Technology (8%)
- Apple (4%)
- Microsoft (4%)
Industrials (2%)
- Union Pacific Corporation (2%)
Energy (2%)
- Canadian Natural Resources Limited (2%)
Portfolio Allocation per Industry
Besides the ETF sector, the Asset Management and Custody Banks Industry (5% of the overall portfolio) and the Investment Banking and Brokerage Industry (5%) make up the highest percentage of the overall portfolio.
The Asset Management and Custody Banks Industry is represented by BlackRock (5%) and the Investment Banking and Brokerage Industry is represented by The Goldman Sachs Group (3%) and The Charles Schwab Corporation (2%).
The Systems Software Industry (represented by Microsoft with 4%) and the Technology Hardware, Storage and Peripherals Industry (with Apple making up 4%) both represent 4% of the portfolio.
The Diversified Banks Industry (represented by JPMorgan) and the Transaction & Payment Processing Services Industry (represented by Mastercard) each make up 3% of the overall portfolio.
The Financial Exchanges and Data Industry (represented by Nasdaq), the Oil and Gas Exploration and Production Industry (Canadian Natural Resources), and the Rail Transportation Industry (Union Pacific Corporation) hold 2% each.
Besides the ETFs, no Industry represents more than 5% of the overall portfolio, indicating that we reached a broad diversification over industries.
Illustration of the Portfolio Allocation per Industry when allocating SCHD and DVY to the ETF Industry
Source: The Author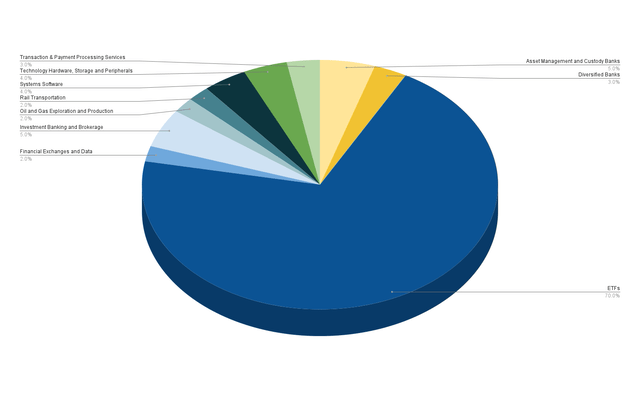
Portfolio Allocation per Country
98% of this investment portfolio, which I am presenting in today’s article is invested in companies from the United States while only 2% are invested in companies from another country. Canada is represented by Canadian Natural Resources, which holds 2% of the overall portfolio.
Due to the fact that only 2% of the selected companies are from outside the United States, it cannot be stated that we reached a broad diversification over countries.
However, I wouldn’t interpret this as being a weakness of this portfolio. This is because I consider it more important to select companies with strong competitive advantages and a strong financial health when investing over the long term, rather than prioritizing companies in a way that only achieves a broad geographical diversification.
Nevertheless, I would suggest that when acquiring additional positions for this investment portfolio, you could include some picks from outside the United States in order to increase its geographical diversification.
Illustration of the Portfolio Allocation per Country
Source: The Author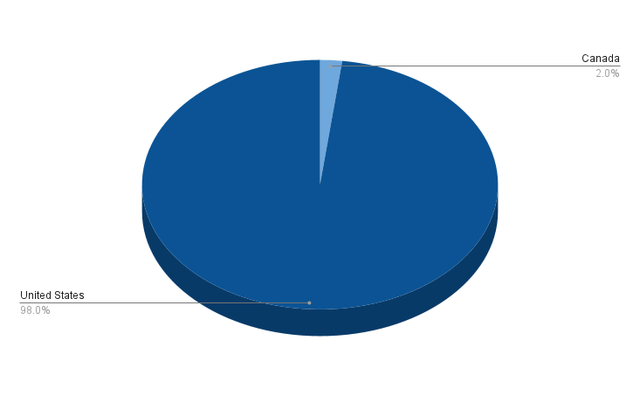
How to achieve an even Broader Diversification
If you would like to achieve an even broader diversification than this investment portfolio offers, you might consider investing in an additional ETF: you could take a closer look at the iShares Core Dividend Growth ETF (DGRO), since it provides you with a relatively attractive Dividend Yield [TTM] of 3.37% and a Dividend Growth Rate [CAGR] of 10.32% over the past 5 years.
In case you ask yourself if it makes sense to only invest in SCHD, I would like to highlight some advantages of picking stocks individually over only investing in ETFs:
- It provides your portfolio with more individuality and flexibility
- You can protect your investment portfolio against the next stock market crash by adding companies with a low Beta Factor (an example of a company with a low Beta Factor would be Johnson & Johnson, which is part of this portfolio)
- You can overweight industries with which you are more familiar and you can avoid others you don’t want to invest in
- You can select stocks which you think are able to beat the market or you can select ones to raise the Weighted Average Dividend Yield or Weighted Dividend Growth Rate of your investment portfolio
- You can also achieve an even broader geographical diversification of your portfolio
In my article, “10 Dividend Stocks To Show The Advantages Of Investing In Individual Stocks Over ETFs,” I discuss the advantages of the selection of stocks over ETFs in greater detail.
Conclusion
The goal of today’s article was to show you how you could allocate $15,000 among my top 10 dividend growth companies I have selected for the month of June.
The 10 selected picks have an Average Dividend Yield [TTM] of 2.08%. In order to help increase the Average Dividend Yield [TTM] of this investment portfolio, I have included two ETFs: the Schwab U.S. Dividend Equity ETF and the iShares Select Dividend ETF.
By providing the Schwab U.S. Dividend Equity ETF with a proportion of 40% of the overall portfolio and the iShares Select Dividend ETF with a proportion of 30%, we were able to increase the Weighted Average Dividend Yield [TTM] of this portfolio to 3.12%. The allocation of the companies also contributed to achieving this Weighted Average Dividend Yield [TTM] of 3.12%.
In addition to that, the portfolio has reached a broad Diversification over Sectors and Industries, since no Sector represents more than 18% of the overall portfolio and no Industry represents more than 5%.
At the same time, I expect the reward (in the form of an attractive compound annual rate of return) of this investment portfolio to be attractive and the risk level to be relatively low. This is due to the fact that I have overweighted the companies that I believe are particularly attractive when it comes to risk and reward.
Author’s Note: Thank you very much for reading and I would appreciate hearing your opinion on this investment portfolio and its allocation! Do you own or plan to acquire one of the selected picks? Any suggestion to improve my analyses is much appreciated! Thank you!
Read the full article here