


Get ready for charts, images, and tables because they are better than words. The ratings and outlooks we highlight here come after Scott Kennedy’s weekly updates in the REIT Forum. Your continued feedback is greatly appreciated, so please leave a comment with suggestions.
Last time I wrote to our followers on the public side, I started out by slamming Cherry Hill Mortgage (CHMI). I was pretty clear with comments like:
Don’t tell me I was wrong to warn investors away from that stock. CHMI’s payout ratio is getting worse. Now it is up to 125%. It was “only” 106% not so long. However, forward earnings keep going down…
I also blasted the dividend yield specifically:
Better REITs trade at much cheaper price-to-book ratios. So, CHMI is a bad choice, despite that sucker 21.4% yield.
Well, CHMI had something to say about that. I bring you CHMI’s rebuttal:

Seeking Alpha
Powerful statement.
Shareholders responded by dumping CHMI. Shares are down 6.3% so far today.
Of course, I have other ideas to share as well. Rather than write up a different article, I will share what I sent to our paid subscribers recently (subscriber link, paywall). I rarely do this kind of delayed release, but I think this piece is particularly educational. Normally our paid content and free content are entirely separate articles.
How to Make Easy Money
If you’re investing in any preferred shares, it makes sense to monitor alternatives that would also be appealing to you. You may find that the shares trade at materially different prices. If you’re in the less attractive share, you can quickly swap your position to improve your return profile. That’s precisely what we did recently. Before putting in our own trade, I wanted to highlight the opportunity for our members.
Yesterday’s subscriber article starts below:
AGNC Preferred Share Absurdity, Yet Again (Hurray)
- Got AGNCM? Consider swapping it for AGNCP and pocketing a difference of more than $2.00 per share.
- This is a very easy call. The market messes up sometimes, but it rarely messes up this badly.
- As the chart demonstrates, there have been very few days where the trade was available at such an extreme gap in valuation.
- Swapping from AGNCO to AGNCP is also a great deal. The fundamental valuation gap is slightly smaller, but still significant. Extremely rare exchange ratio!
- I have some shares of AGNCO and if the pricing disparity holds, I may swap my AGNCO for more AGNCP.
Thanks to our REIT Forum members for calling these opportunities out in chat. Those smart calls brought my attention to a pricing failure that just developed:
- AGNCP is significantly underpriced relative to AGNCM and AGNCO.
Here’s the chart for the historical price spreads for (AGNCM), (AGNCO), and (AGNCP).
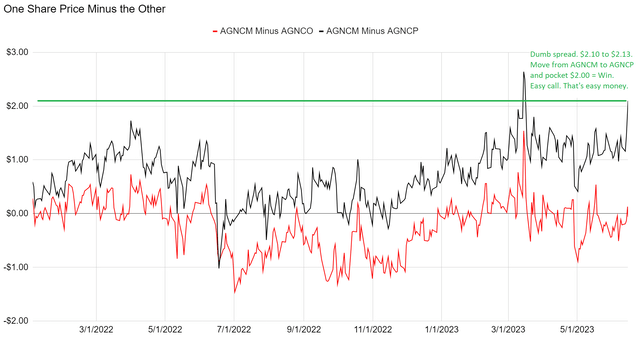
Thereitforum.com
AGNCM closed about $2.10 to $2.13 higher than AGNCP. That’s way too big.
We should consider future cash flows. Here’s a projection using some rates I picked:
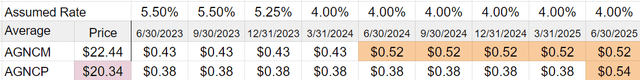
Thereitforum.com
The floating rate on the top (called Assumed Rate) doesn’t matter until the boxes below turn orange to indicate floating-rate dividends.
Based on the yields across the Treasury curve, I think using 4% for 2024 is an acceptable choice. In this scenario, over the next two years:
- AGNCM shareholders get $3.80 (using 4%).
- AGNCP shareholders get $3.06.
- That is a spread of $.74.
- The price spread is above $2.00.
That’s absurd.
We’re going to ignore the fact that you could take the $2.00 of savings and buy Treasuries to get some extra interest. We will just assume you stick it in a bank so the bank can earn extra interest instead of paying you.
Without investing your $2.00, you can match the $.74 in dividends the AGNCM shareholder gets (just withdraw the money) and still have $1.36 left in the account. It doesn’t matter much for 1 share. But for 1,000 shares, you’d be talking about an extra $1,360. That’s not life-changing money, but it sure beats a poke in the eye!
As you’ll notice on the right-hand side, AGNCP gets an extra $.02 per quarter when both shares are floating. If we adjust for the rounding error, AGNCP actually gets an extra $.091 per share per year when they both float.
What Rate Does AGNCM Need to Win?
If short-term rates are above 9.0% for each of AGNCM’s floating dividends, then AGNCM almost wins ($1.99 difference in dividends). But if you were going to invest the $2.00 savings in Treasuries, then AGNCM actually needs an even higher floating rate.
If anyone is absolutely convinced short-term rates are going to 9.0%, their portfolio should be 1-month Treasury bills and put options.
I don’t believe that will happen. Therefore, I think AGNCM is laughably overvalued relative to AGNCP.
Another Trade
You may have noticed that AGNCO is not completely out of step with AGNCM. The spread between those shares did not break the bell curve. Therefore, as you might imagine, AGNCP is also cheap relative to AGNCO.
When we measure using cash flows, the gap between AGNCO and AGNCP is less extreme than the gap between AGNCM and AGNCP. However, it’s still present. Consequently, investors in AGNCO may want to swap for shares of AGNCP.
Current prices:
- AGNCM: $22.44
- AGNCO: $22.50
- AGNCP: $20.34
Note: I currently have no shares of AGNCM. However, I do have some shares of AGNCO. I could use my shares of AGNCO to make this swap. If I see similar prices available for execution in the future, I will probably take the opportunity. Publishing this article might prevent those prices from being available, given the liquidity constraints. However, this is my extremely explicit foreshadowing.
I foreshadowed once in the bullet points, once in the text, and I’ll do it again in the disclosure.
If we build the price comparison chart from the perspective of AGNCP, we can see that it is suddenly more than $2.00 below AGNCO and AGNCM:
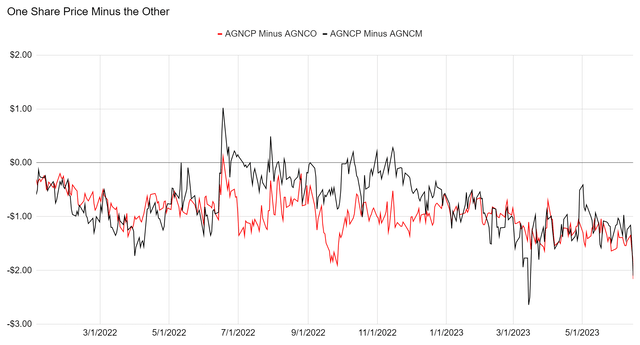
Thereitforum.com
That’s an unusually large spread! This is the first time the red line broke below negative $2.00! This is absolutely a market failure. Investors who didn’t run all the cash flows are trading on incomplete information. That’s great for us. That’s usually how we find trading opportunities.
Beware the bid-ask spreads. Usually, they are not too big for the AGNC preferred shares. However, they certainly could spike up. Investors looking to make the trade should check the ask for the shares they want to buy and the bid for the shares they want to sell.
If moving a large number of shares, I find it wise to split the transaction up. That way, I’m not entirely out of one share before I start moving into the other.
Again, thank you to our great members for noticing this in real-time and calling it out in chat (after making their trades).
That’s the end of our subscriber article, so we’ll be moving on to the charts.
Note: As foreshadowed in the article, on 6/16/2023, I closed out my position in AGNCO at $22.19 and used the proceeds to buy more shares of AGNCP at $20.30. The spread of $1.89 was good enough for me to be quite happy.
Update
Here are the latest prices:
- AGNCM: $21.70
- AGNCO: $22.57
- AGNCP: $20.68
The AGNCM to AGNCP spread came down precisely as we expected:
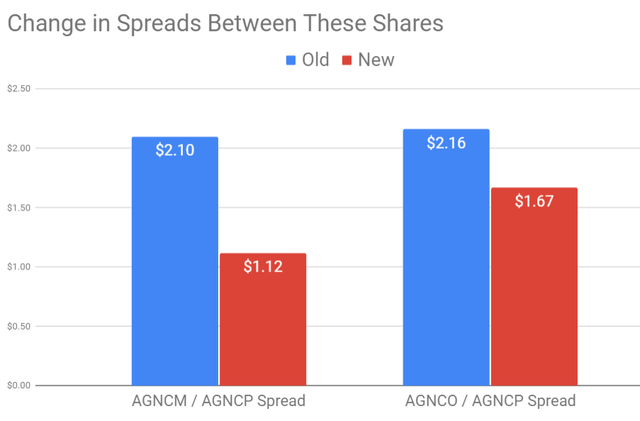
The REIT Forum
Note: I pulled some charts before the market closed, so a few prices swung by a few cents between this chart and the later charts on preferred share prices.
The spread between AGNCM and AGNCP narrowed significantly since the initial alert. The spread between AGNCO and AGNCP narrowed modestly. AGNCP is still the most attractive share at the moment. To be clear, AGNCP’s share price should be lower than either of the shares currently. However, the gap should still tighten.
This is far from the only case where prices diverge. We’ve got other opportunities in the sector where the disconnect in prices is even wider than this. All it takes is understanding how to model out the cash flows and preparing the analysis to find the opportunities.
Stock Table
We will close out the rest of the article with the tables and charts we provide for readers to help them track the sector for both common shares and preferred shares.
We’re including a quick table for the common shares that will be shown in our tables:
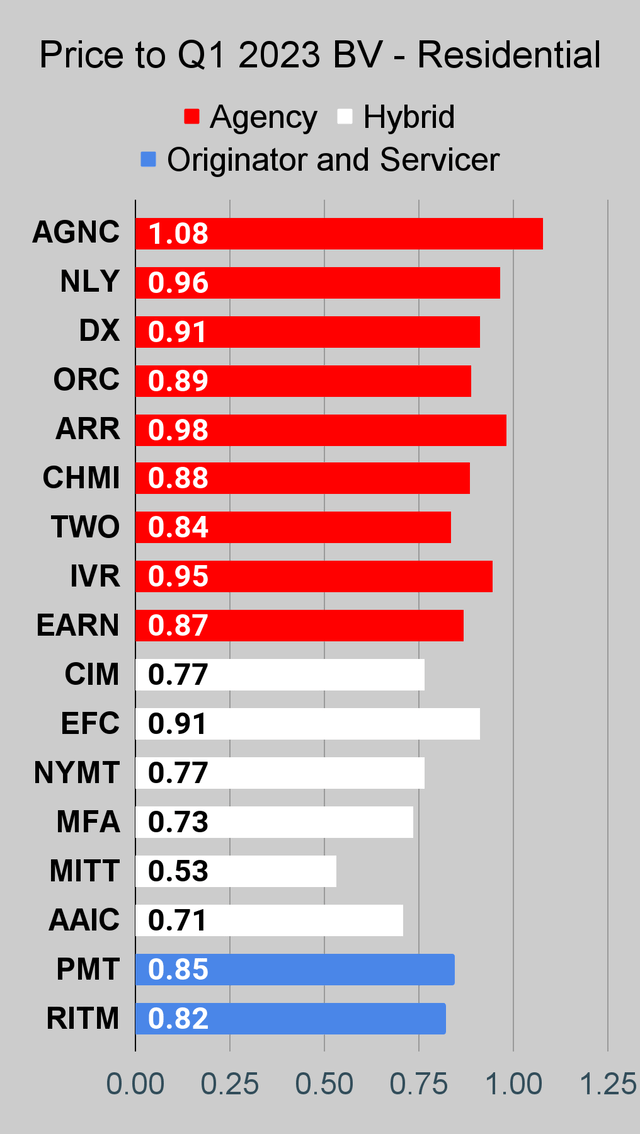
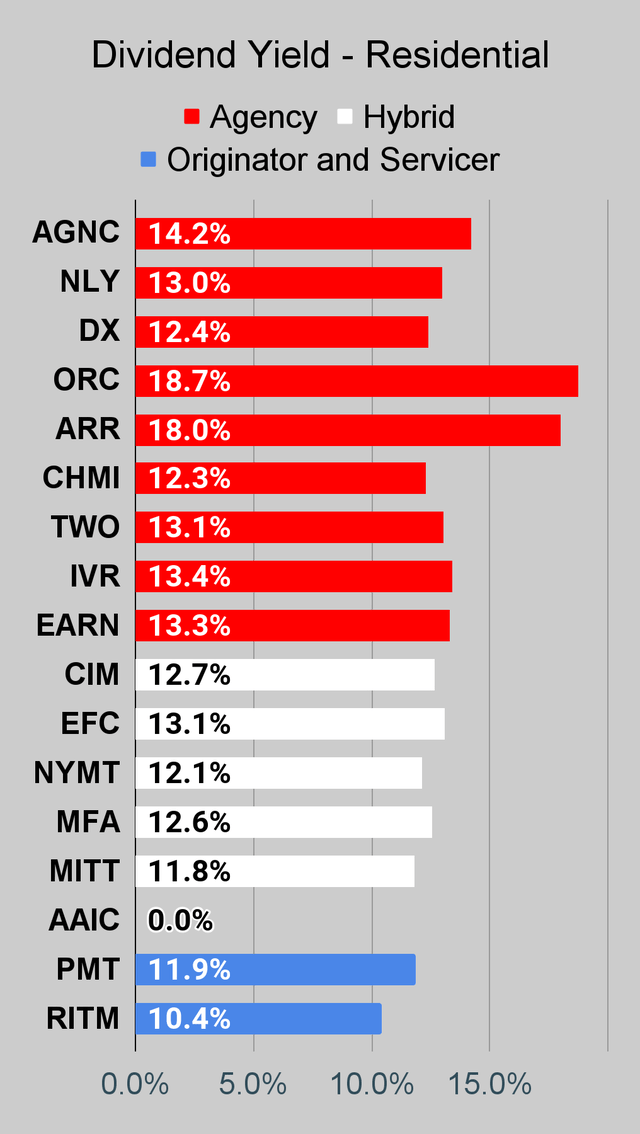
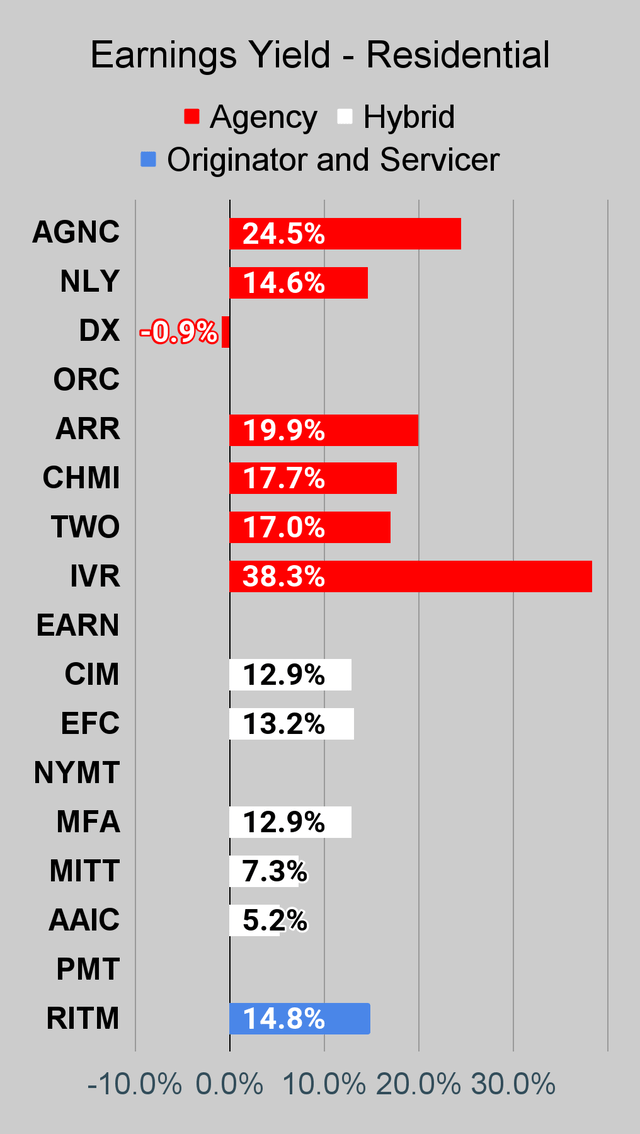
If you’re looking for a stock and I haven’t mentioned it yet, you’ll still find it in the charts below. The charts contain comparisons based on price-to-book value, dividend yields, and earnings yield. You won’t find these tables anywhere else.
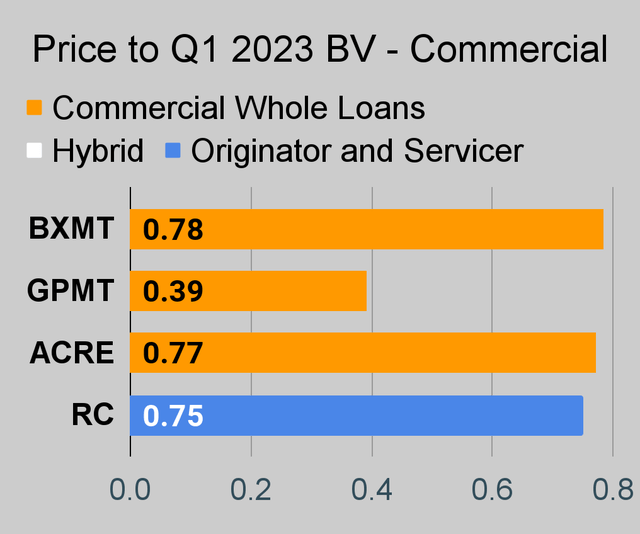
For mortgage REITs, please look at the charts for AGNC, NLY, DX, ORC, ARR, CHMI, TWO, IVR, EARN, CIM, EFC, NYMT, MFA, MITT, AAIC, PMT, RITM, BXMT, GPMT, WMC, and RC.
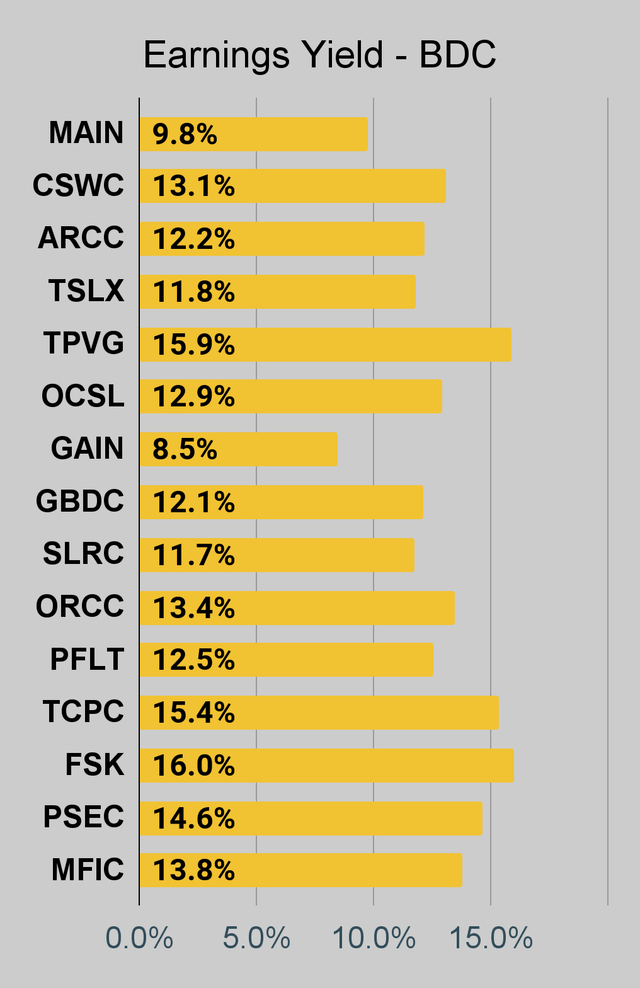
For BDCs, please look at the charts for MAIN, CSWC, ARCC, TSLX, TPVG, OCSL, GAIN, GBDC, SLRC, ORCC, PFLT, TCPC, FSK, PSEC, and MFIC.
This series is the easiest place to find charts providing up-to-date comparisons across the sector.
Residential Mortgage REIT Charts
Note: The chart for our public articles uses the book value per share from the latest earnings release. Current estimated book value per share is used in reaching our targets and trading decisions. It’s available in our service, but those estimates are not included in the charts below. PMT and NYMT are not showing an earnings yield metric as neither REIT provides a quarterly “Core EPS” metric. Presently, a few other REITs also have no consensus estimate.
Second Note: Due to the way historical amortized cost and hedging is factored into the earnings metrics, it is possible for two mortgage REITs with similar portfolios to post materially different metrics for earnings. I would be very cautious about putting much emphasis on the consensus analyst estimate (which is used to determine the earnings yield). In particular, throughout late 2022 the earnings metric became less comparable for many REITs.
Note: The chart for our public articles uses the book value per share from the latest earnings release. Current estimated book value per share is used in reaching our targets and trading decisions. It’s available in our service, but those estimates are not included in the charts below. PMT and NYMT are not showing an earnings yield metric as neither REIT provides a quarterly “Core EPS” metric. Presently, a few other REITs also have no consensus estimate.
Second Note: Due to the way historical amortized cost and hedging is factored into the earnings metrics, it’s possible for two mortgage REITs with similar portfolios to post materially different metrics for earnings. I would be very cautious about putting much emphasis on the consensus analyst estimate (which is used to determine the earnings yield). In particular, throughout late 2022 the earnings metric became less comparable for many REITs.
 The REIT Forum |
 The REIT Forum |
 The REIT Forum |
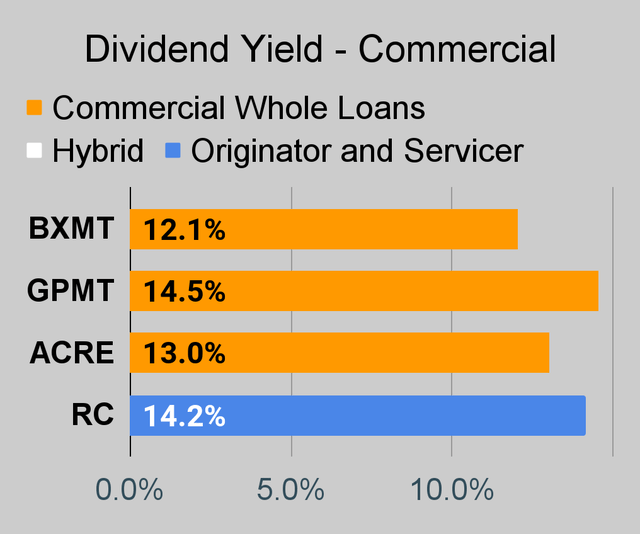
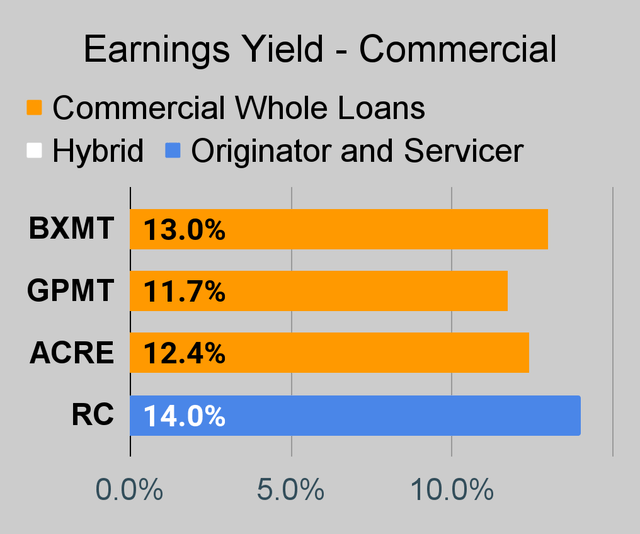
Commercial Mortgage REIT Charts
 The REIT Forum |
 The REIT Forum |
 The REIT Forum |
BDC Charts
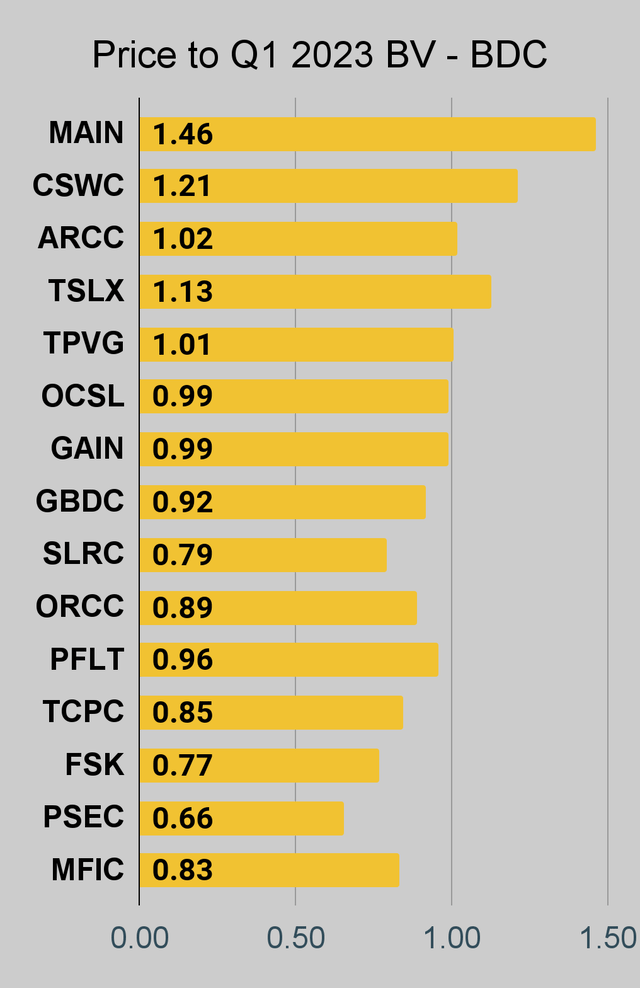 The REIT Forum |
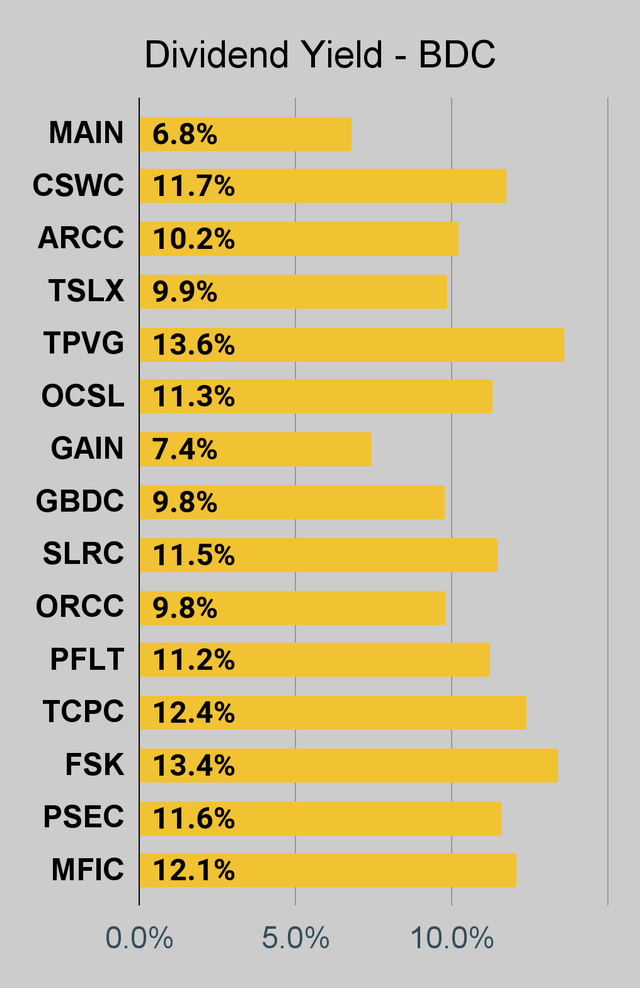 The REIT Forum |
 The REIT Forum |
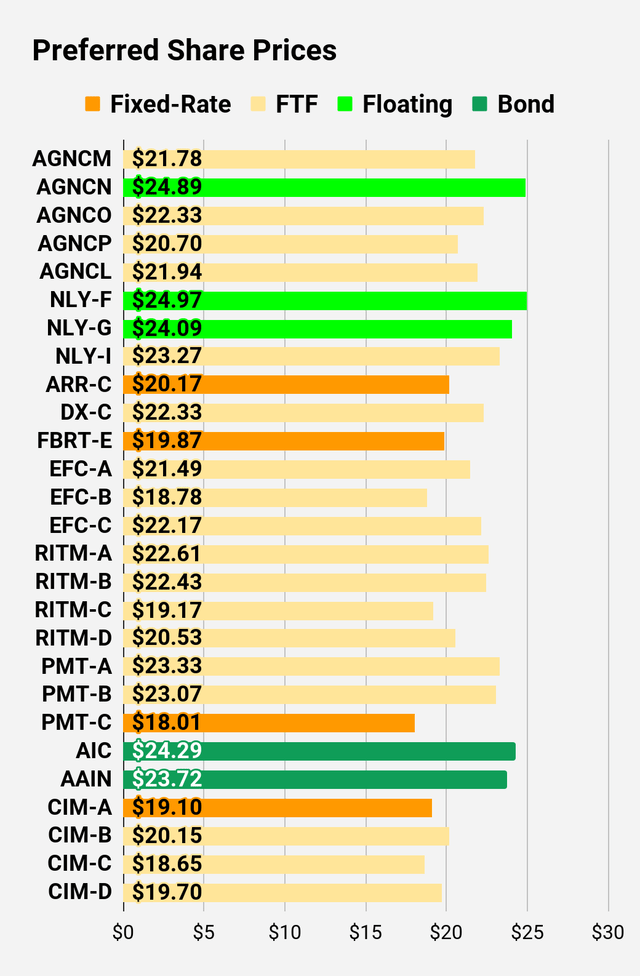
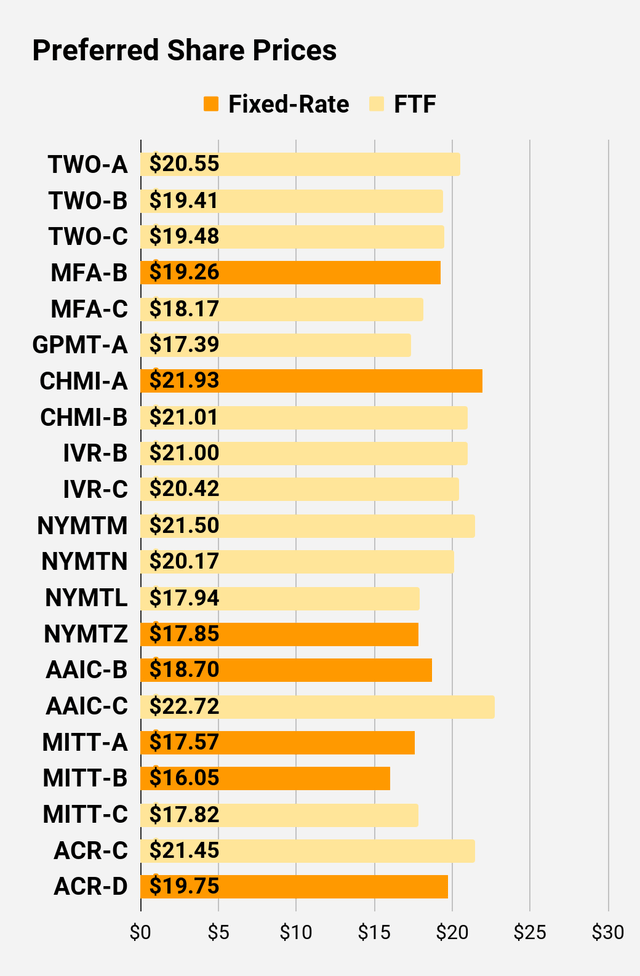
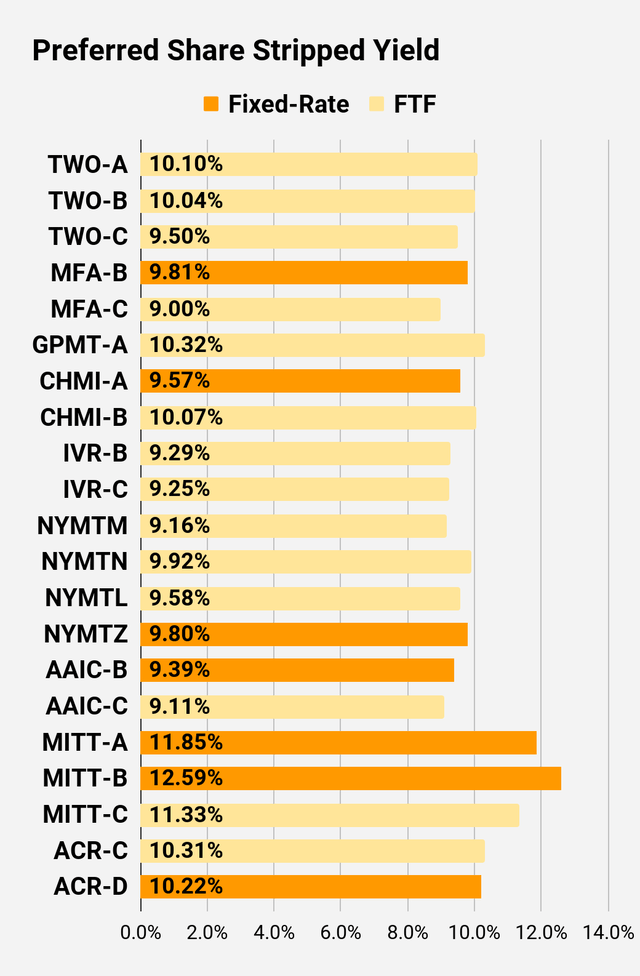
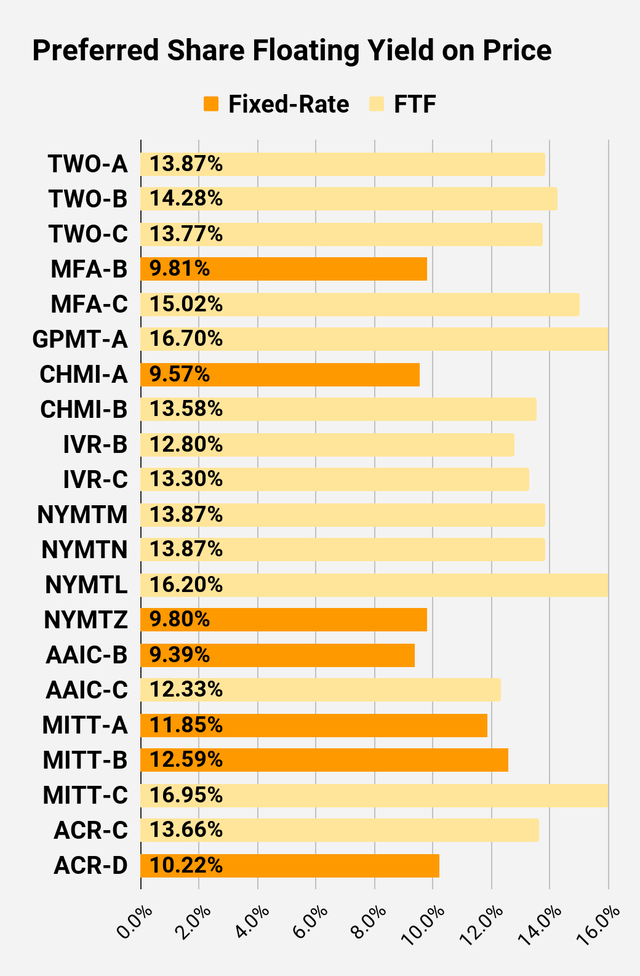
Preferred Share Charts
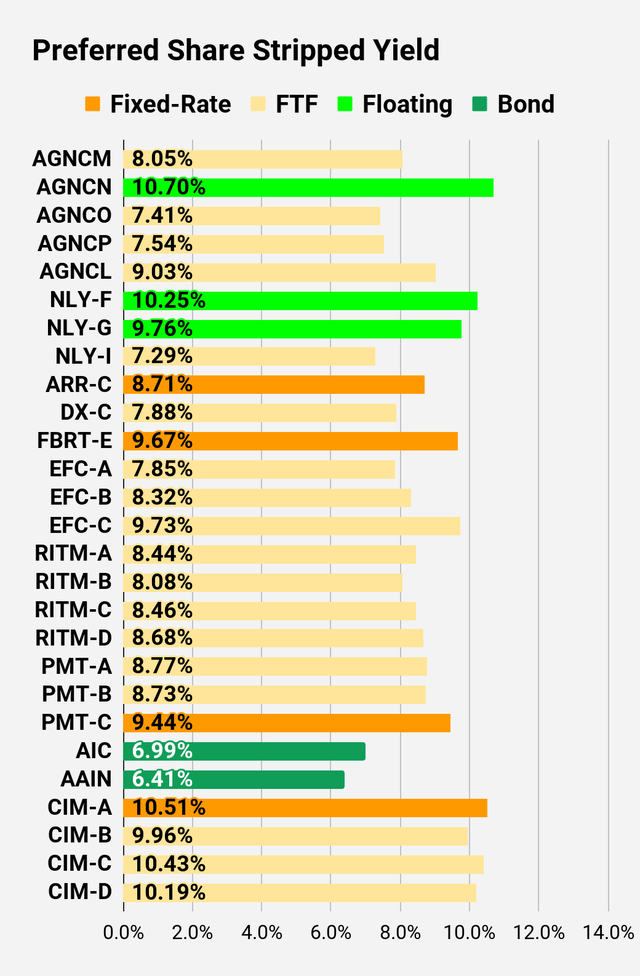
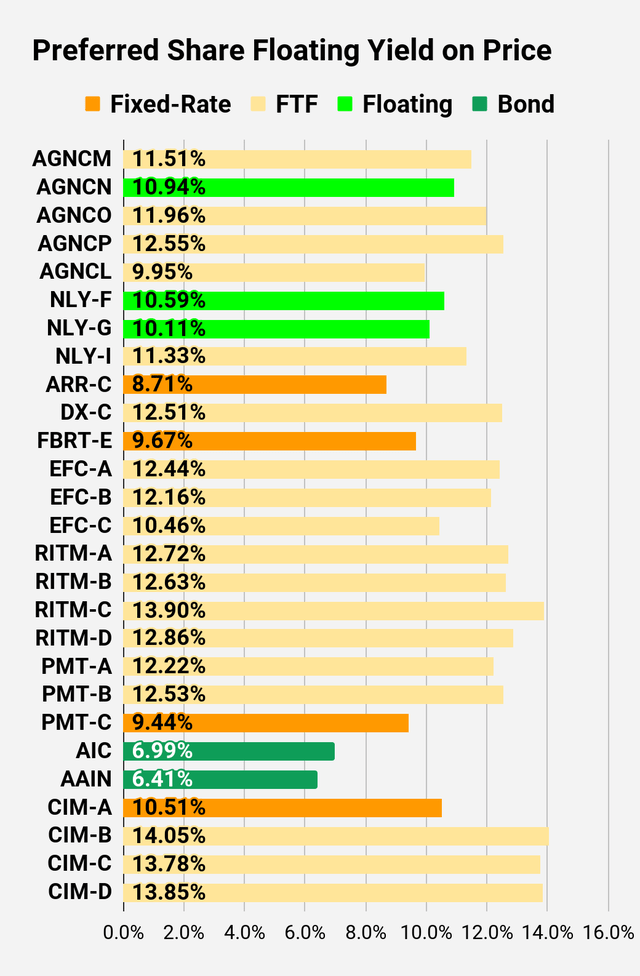
I changed the coloring a bit. We needed to adjust to include that the first fixed-to-floating shares have transitioned over to floating rates. When a share already is floating, the stripped yield may be different from the “Floating Yield on Price” due to changes in interest rates. For instance, NLY-F already has a floating rate. However, the rate is only reset once per three months. The stripped yield is calculated using the upcoming projected dividend payment and the “Floating Yield on Price” is based on where the dividend would be if the rate reset today. In my opinion, for these shares the “Floating Yield on Price” is clearly the more important metric.
 The REIT Forum |
 The REIT Forum |
 The REIT Forum |
 The REIT Forum |
 The REIT Forum |
 The REIT Forum |
Preferred Share Data
Beyond the charts, we’re also providing our readers with access to several other metrics for the preferred shares.
After testing out a series on preferred shares, we decided to try merging it into the series on common shares. After all, we’re still talking about positions in mortgage REITs. We don’t have any desire to cover preferred shares without cumulative dividends, so any preferred shares you see in our column will have cumulative dividends. You can verify that by using Quantum Online. We’ve included the links in the table below.
To better organize the table, we needed to abbreviate column names as follows:
- Price = Recent Share Price – Shown in Charts
- BoF = Bond or FTF (Fixed-to-Floating)
- S-Yield = Stripped Yield – Shown in Charts
- Coupon = Initial Fixed-Rate Coupon
- FYoP = Floating Yield on Price – Shown in Charts
- NCD = Next Call Date (the soonest shares could be called)
- Note: For all FTF issues, the floating rate would start on NCD.
- WCC = Worst Cash to Call (lowest net cash return possible from a call)
- QO Link = Link to Quantum Online Page
Second Batch:
Strategy
Our goal is to maximize total returns. We achieve those most effectively by including “trading” strategies. We regularly trade positions in the mortgage REIT common shares and BDCs because:
- Prices are inefficient.
- Long term, share prices generally revolve around book value.
- Short term, price-to-book ratios can deviate materially.
- Book value isn’t the only step in analysis, but it’s the cornerstone.
We also allocate to preferred shares and equity REITs. We encourage buy-and-hold investors to consider using more preferred shares and equity REITs.
Performance
We compare our performance against four ETFs that investors might use for exposure to our sectors:
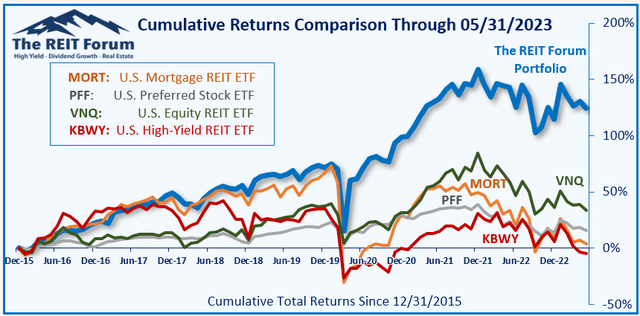
The REIT Forum
The four ETFs we use for comparison are:
|
Ticker |
Exposure |
|
MORT |
One of the largest mortgage REIT ETFs |
|
PFF |
One of the largest preferred share ETFs |
|
VNQ |
Largest equity REIT ETF |
|
KBWY |
The high-yield equity REIT ETF. Yes, it has been dreadful. |
When investors think it isn’t possible to earn solid returns in preferred shares or mortgage REITs, we politely disagree. The sector has plenty of opportunities, but investors still need to be wary of the risks. We can’t simply reach for yield and hope for the best. When it comes to common shares, we need to be even more vigilant to protect our principal by regularly watching prices and updating estimates for book value and price targets.
Ratings: AGNCP is more attractive than AGNCO. It should outperform by a small margin. Not a big margin, but low single-digit percentages. Not a home run (anymore), but better than a poke in the eye.
Read the full article here