

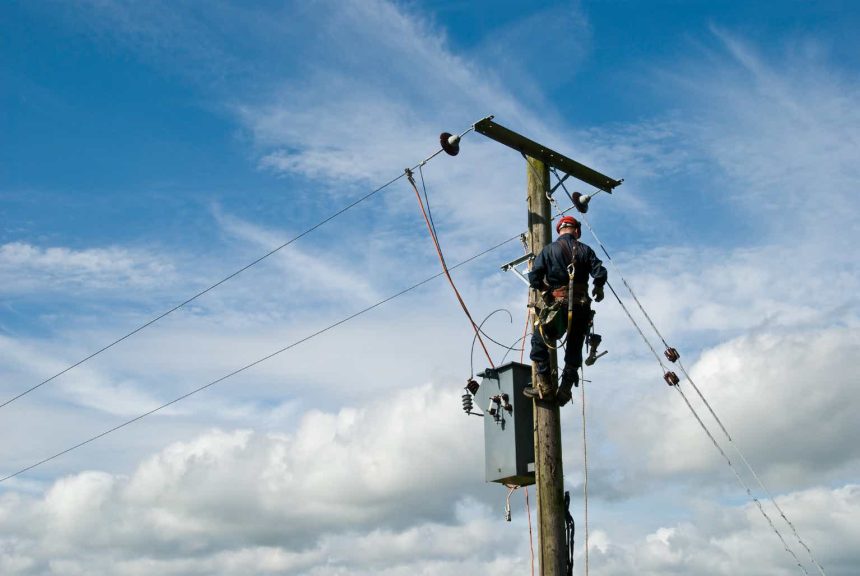
Hubbell is a nuts and bolts play on the United States electrical grid mega-trends.
Not only is it positioned in attractive niches, but it has compounded capital at double-digit ROIC and expects a significant inflection in growth over the next years and decade.
What Hubbell Does
Founded in 1888 by Harvey Hubbell (the inventor of the electrical plug and pull-chain light socket), Hubbell manufactures critical T&D (on the pole) and behind-meter components through 75 brands and thousands of SKUs.
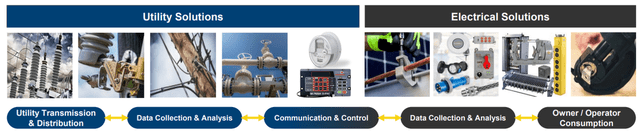
Hubbell Products in the Value Chain (Company Presentation)
Their customers include distributors, wholesalers, electric utilities, OEMs, electrical contractors, telecom companies, and retail and hardware outlets.
As their customer base is highly fragmented apart from large utilities, 35% of sales are through its internal sales force and 65% through distributors (key to reaching smaller customers).
They are highly exposed to the secular trends driving higher spending on the electric transmission and distribution (T&D) grid. They define their market position as everything in the T&D grid other than the poles, the towers, and the wires.
Overview of its Two Divisions
Hubbell operates under two divisions, Hubbell Electrical Solutions (HES) and Hubbell Utility Solutions (HUS).
HUS manufactures T&D components like transformers, surge arresters, insulators, anchors, etc., and utility meters.
HES manufactures behind the meter electrical components like connectors, lugs, grounding, wiring systems, boxes, fittings, etc.
Changing With Divestitures and Acquisitions
The revenue mix between the segments has shifted significantly since 2017:
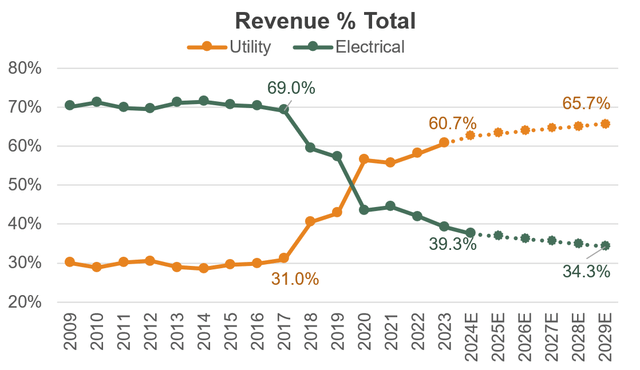
Company Filings and Author Estimates
This has been the result of acquisitions, divestitures, and different end-market growth.
Hubbell divested commodity-like products with below-average margins and growth. Notable ones include the 2021 sale of its Commercial and Industrial lighting division which was 12.3% of sales and the 2023 sales of its Residential Lighting portfolio which was 3.5% of sales.
Below is a visual representation of what was removed and what is left.
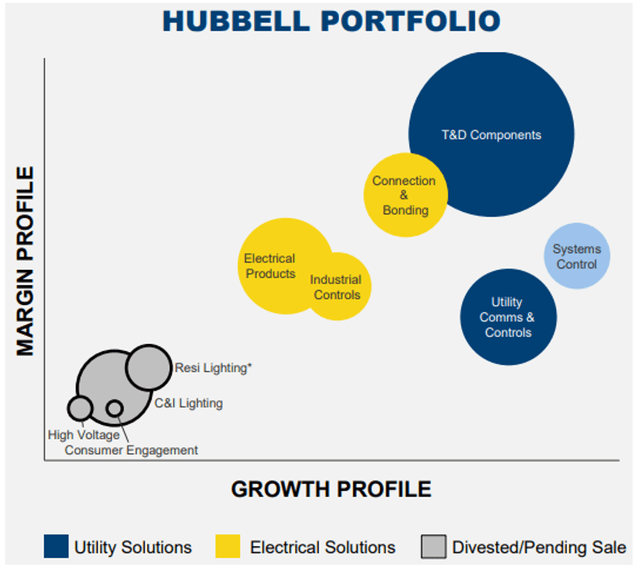
Hubbell portfolio evolution through acquisitions (Company Presentation )
Focusing on more attractive products led to the shift in segment mix but also to an inflection in top-line growth and margins post-2017:
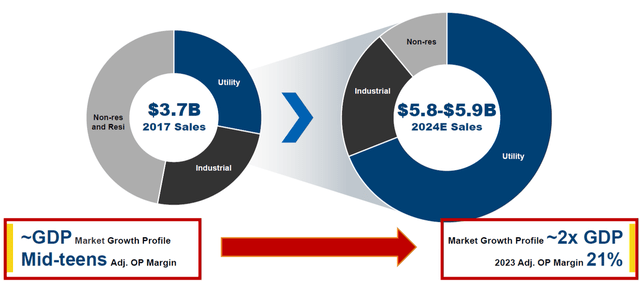
Hubbell Evolution since 2017 (Company Filings)
Hubbell Utility Solutions
HUS provides essential components to the T&D grid including on-pole equipment, substation equipment, and metering hardware and software.
Here is a handful of the products offered by the segment (Hubbell has thousands of SKUs so this is not anywhere close to exhaustive)
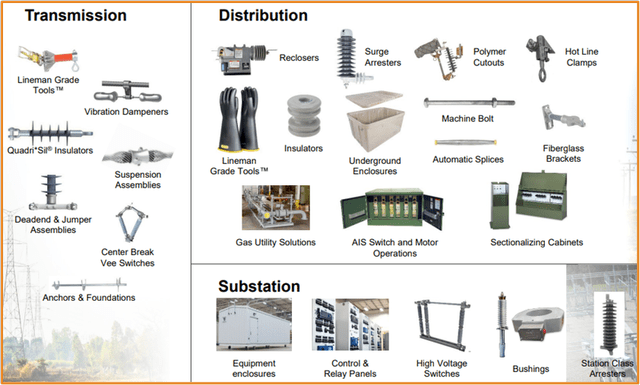
HUS Product Sample (Company Presentation)
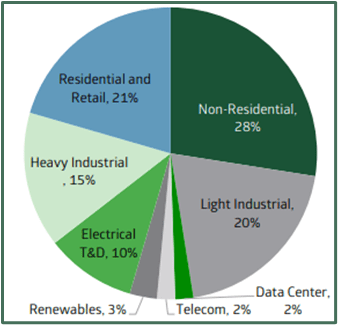
Apart from Telecom and civil construction, most of its end markets depend on utilities’ spending:
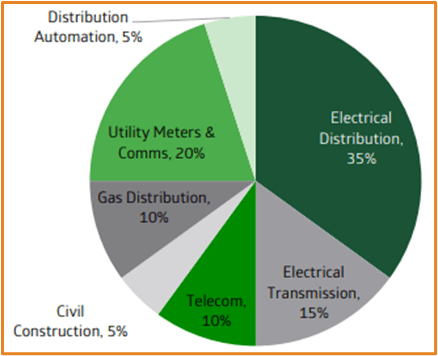
HUS End Markets (Equity Research)
Hubbell Electrical Solutions
HES sells components mostly used in the consumption of electricity behind the meter, used in and around industrial, commercial, and institutional facilities by electrical contractors, maintenance personnel, electricians, etc.
Once again, this segment has thousands of SKUs, so the product list below is only a small sample:
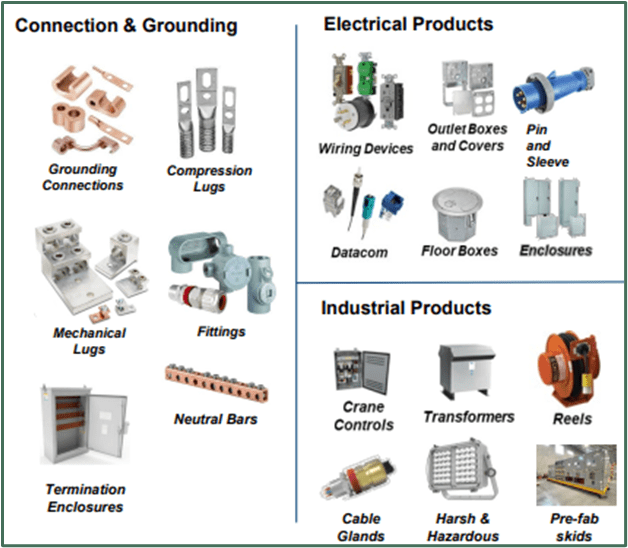
HES Product Sample (Company Presentation)
Its end-market mix is more varied than HUS, as some components are used in industrial applications only, some residential, and some in T&D:
HES End Markets (Equity Research)
Secular Growth Drivers
Over the next decade(s), the electric grid in the United States will face trends that require a sizeable increase in capex:
- Significant energy demand growth (from electrification, reshoring, EVs, data centers, etc.)
- Increasing necessity of replacing and modernizing the existing grid
- Shift to renewables production, which requires more T&D infrastructure than “dirty” generation.
- Utility CAPEX catalyzed by government incentives
The trends above are focused mostly on the United States grid because Hubbell’s revenue mix is >90% U.S.:
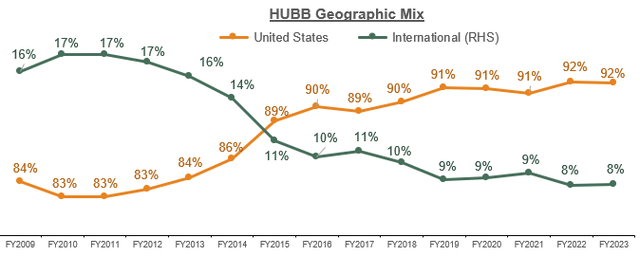
Company Filings
I explore each of these drivers and their impact on Hubbell’s product demand
Energy Demand Will Inflect Upward
After a decade of flat electricity demand in the United States, the grid is expected to experience significant load growth:
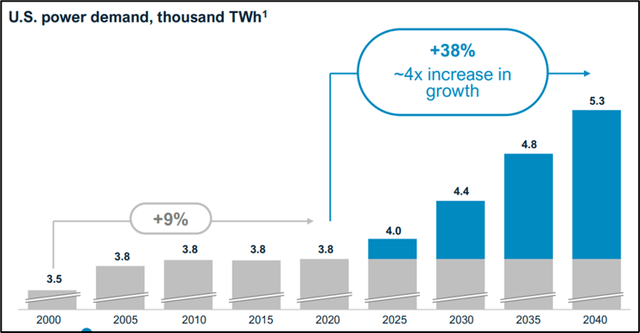
NextEra 2024 Investor Day
This is driven by the electrification of power generation, re-shoring of industries, and more.
- Electrification (includes EVs): Beyond the shift of current electricity production to renewables, there is a shift of energy generated towards electricity (gas, steam, coal engines being replaced by grid-connected components:
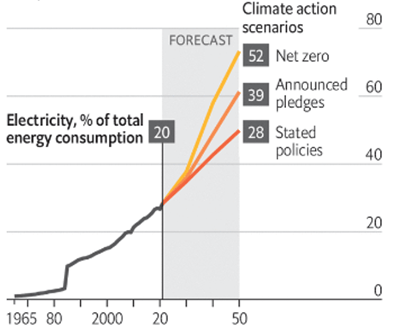
Electricity % total consumption estimates (The Economist)
- Re-Shoring: The talks around re-shoring have been backed up by numbers (see graph of spending below). Chip manufacturing is the poster child of increasing electricity demand due to on-shoring. The 1st of 9 phases of TSMC’s Phoenix facility will need 200 MW, equivalent to the demand of ~30k households. TSMC plans to build up to 5 additional fabs on the same site, with another 21 already planned for construction in the country.
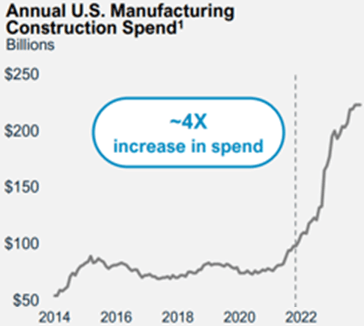
U.S. Manufacturing Construction Spend (Equity Research)
This is only a small sample of factors driving increasing demand, which also include data centers/AI.
Incremental Energy Will Come From T&D-Intensive Renewables
Beyond environmental reasons, utilities are economically incentivized to use renewables for future production because they cost less.
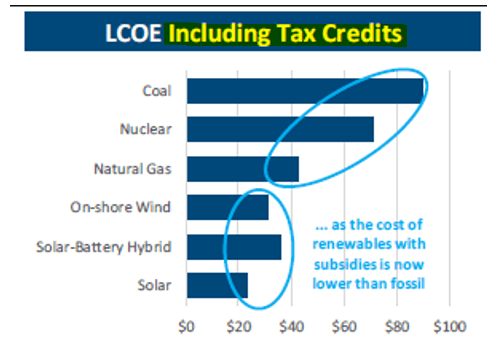
Equity Research
Even if subsidies ended tomorrow, the cost of solar especially has been decreasing, and now both it and on-shore wind have a cost comparable to natural gas.
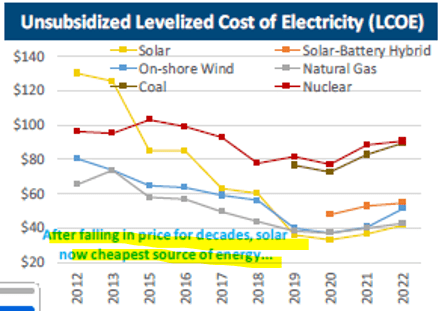
Equity Research
Renewables’ share of electricity generation is expected to go from ~30% today to ~40% by 2028, with most incremental capacity coming from Solar:
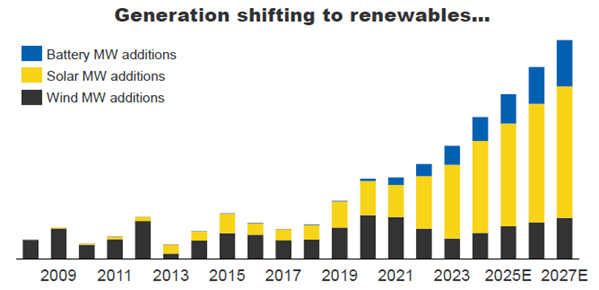
Hubbell Presentation
Hubbell benefits because unlike coal or natural gas power plants, renewables cannot be located close to consumption centers; they are bound to where the natural resource is available.
The mismatch in production and consumption locations is clear when looking at solar and wind resource locations in the U.S.:
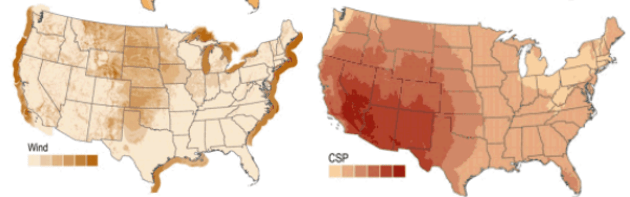
Renewable Resource Location (NREL)
The distance from production to consumption average is almost twice as long for wind as it is for natural gas, and this distance should increase as more people far from these resources rely on them for power:
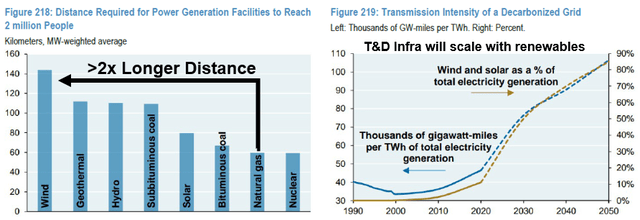
Equity Research
So while lower renewable electricity cost has made it the clear leader in incremental production capacity additions, the initial CAPEX required to transmit it to consumers is higher, benefiting Hubbell as a key supplier of T&D hardware.
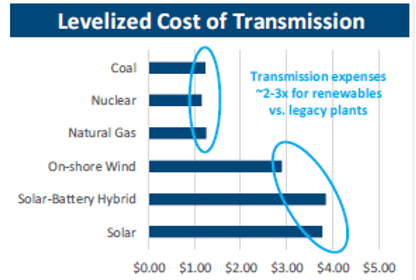
Equity Research
An Old and Fragile Grid Needs Elevated CAPEX
Most of the U.S. grid was built after World War 2 and is beyond its expected life:
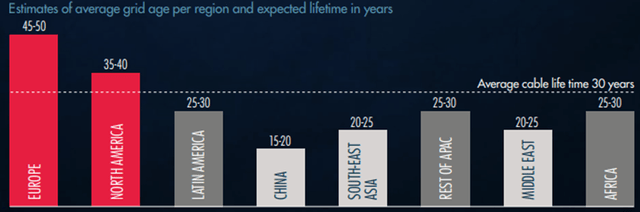
Grid Age by Geography (Prysmian Investor Day)
Over 70% of U.S. transmission lines are over 25 years old, and ~60% of U.S. distribution lines are older than their 50-year life expectancy.
This trend does not even require new T&D construction to play out, as most of the network investments will be in replacement:
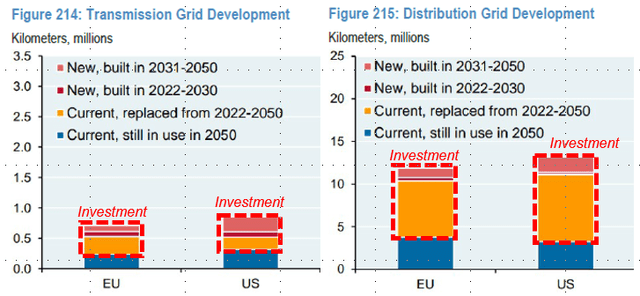
Grid T&D Replacement (Equity Research)
Beyond age, the increasing frequency and severity of weather events and their impact on the grid are incentivizing replacement and hardening.
It is estimated that between 2000 and 2023, ~80% of outages were caused by weather. Between 2014 and 2023, weather-related outages doubled relative to the prior decade. They have also been increasing in severity (they last longer).

Power Outage Statistics (EIA)
As a result, utilities are spending a meaningful share of their CAPEX on grid hardening and modernization, benefiting Hubbell as a key supplier of critical T&D hardware:
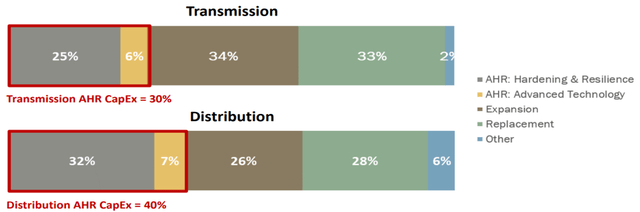
Hardening and Resiliency Investments (EEI)
Government Incentives Will Catalyze Demand Growth
Many government programs subsidizing spending on renewables, grid hardening, expansion, or modernization already exist, and more are likely to be implemented over the next decades.
These existing and future economic incentives will serve as catalysts accelerating the trends discussed above.
Some current ones include the IRA, IIJA, and GRIP, which target wholly or in part electrical grid investments.
The impacts on Hubbell will be non-negligible, as from the IIJA alone, Hubbell expects an incremental 1-2% tailwind to annual revenue growth:
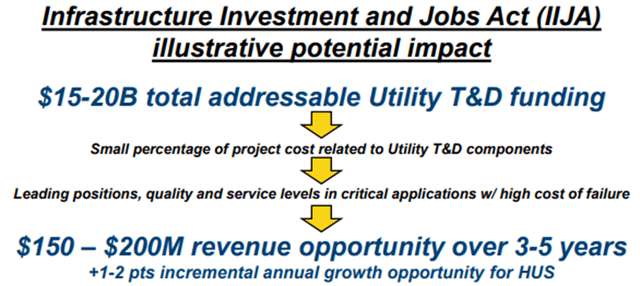
IIJA Impact on Hubbell (Company Presentation)
Result: Utility CAPEX Trending Up
There has been a clear inflection in T&D capex from utilities which is expected to subsist:
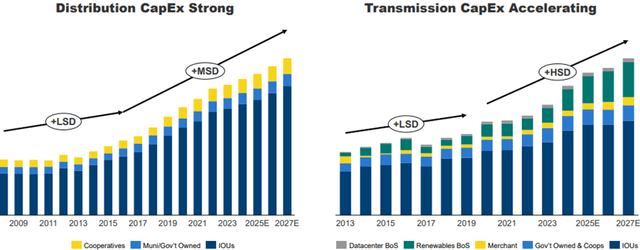
T&D Capex Trends (Company Presentation)
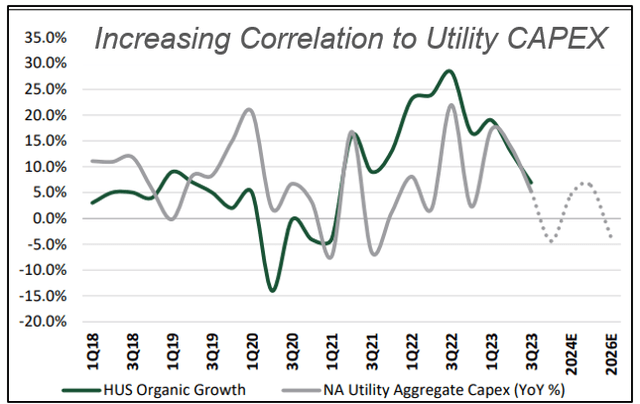
This applies to Hubbell, as its HUS revenue has become increasingly correlated to Utility CAPEX, and the segment itself has been growing in share of total revenue, now at ~61%.
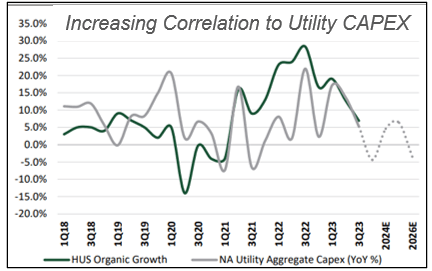
Equity Research
Hubbell’s Competitive Strengths
Hubbell’s utility customers have little bargaining power; the components it sells typically represent <5% of the cost of the T&D line but their quality and reliability is paramount.
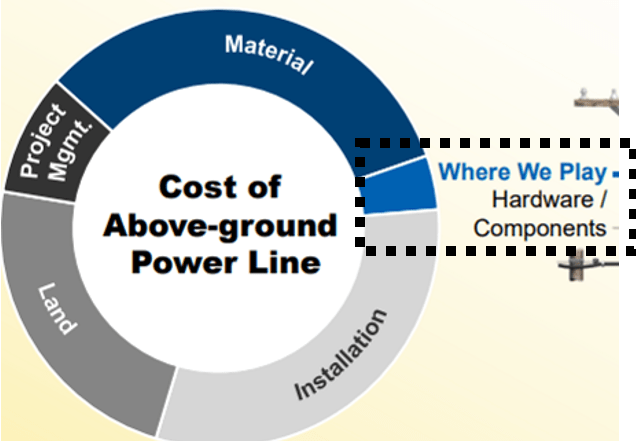
Low Cost Of Total (Company Presentation)
If a component fails, the line will usually be down, and repairmen dispatched. In the worst cases, it can lead to serious damage. For example, when a PG&E transmission line hook failed in 2018, it started one of the largest and most deadly wildfires in California’s history, costing 85 people their lives and billions to PG&E in lawsuits and settlements.
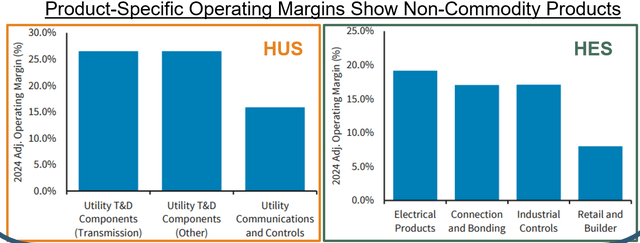
Hubbell has proven its pricing power in recent years, and its margins by product category show they are not commodities:
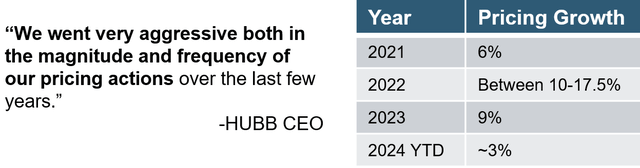
Pricing Actions in recent (Company Filings and Earnings Call)
Company Filings
Hubbell can price aggressively because of its brand leadership. They are positioned as a one-stop-shop for T&D components, serving >85% of products on T&D lines, and the leader in terms of T&D install base in the U.S.
Proving the value of its brand, components are generally replaced by utilities on a like-for-like basis to avoid taking risks on unproven companies/products.
A track record of quality and reliability, scale to ship with low lead times when utilities can’t afford to wait on repairs, and over 3000 patents therefore protect their current competitive position.
According to management during the 2024 analyst day, their customers have made explicit that their “one-stop-shop” positioning is valuable:
We got to see our 20 largest customers. And it seemed to me every single one is looking for us to be bigger, to sell more, to make their supply chain easier and with a trusted partner
For example, their TowerPak solutions are pre-assembled and tested transmission line components that simplify on-site assembly. Management says that over 50% of new transmission projects use their TowerPak solutions.
ROIC & Allocation Performance
M&A has been a key allocation priority for management over the past decade. It has represented ~40% of cash outlays over the past 5 years while generating solid low-teens ROIC despite increasing multiples paid and deal size:
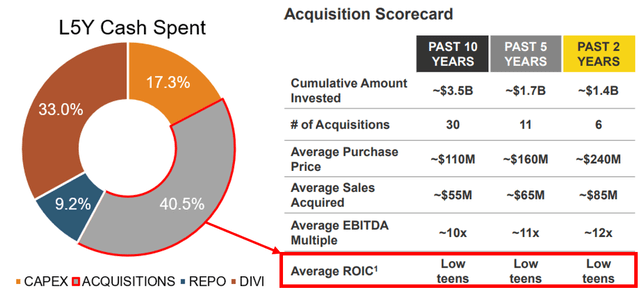
Company Filings
The acquisitions target bolt-ons focused on high-value brands (not commodity products), that are growth and margin additive, and that generate strong ROIC (management claims to use a benchmark test). ROIC has indeed held strong over the past 10 years+:
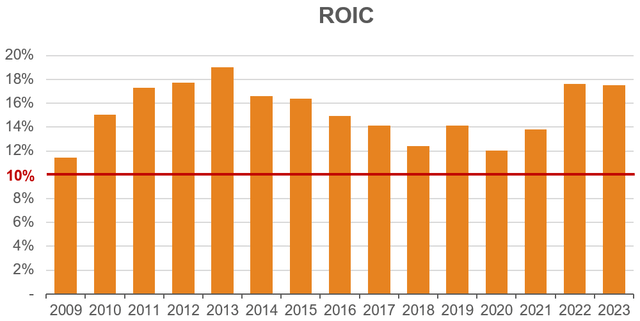
Company Financials (formatted by author)
The caveat is that management compensation metrics do not include allocation measures such as ROIC. Compensation incentives are instead based on results for operations unadjusted for M&A (can reward growth for growth’s sake)
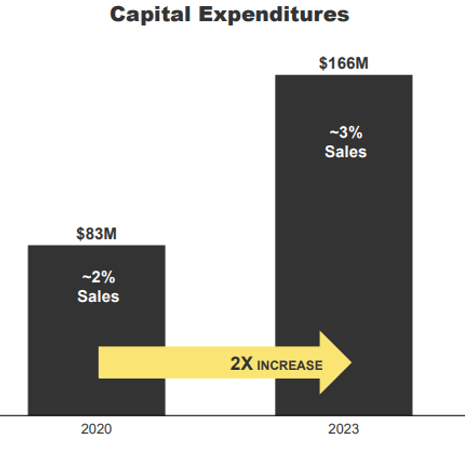
Yet even better than inorganic investments are investments in capacity expansion and operational optimizations. According to management, these organic internal investments have the most attractive return profile.
According to their 2024 investor day, investments in capacity expansions have >40% average ROIC on average, with ~50% of L3Y Capex has been towards capacity expansions mostly targeted to expand utility T&D component production capacity.
With these returns, that Hubbell can scale reinvestments at high ROIC is a positive sign that it can continue to compound capital:
Management presentation
>10% EPS Growth For Years to Come
Based on their 2024 analyst day, management currently guides for 6-9% top-line CAGR to 2027 (4-6% organic), HES growing 3-5% organic and HUS growing 5-6% organic.
I assume a 6% organic growth + 3% M&A for HUS and 4% organic with 2% M&A tailwind for HES, or a 7.9% total sales CAGR to 2027.
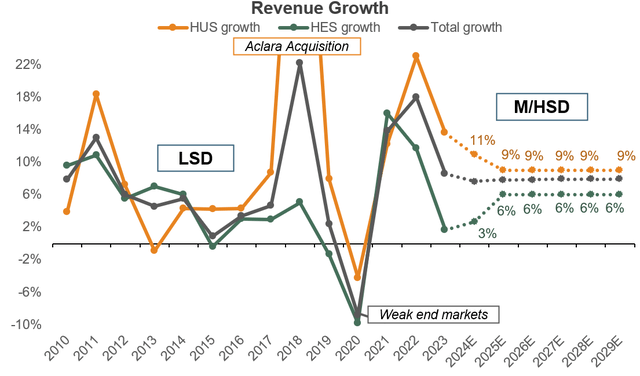
Top-Line expectations (Author Estimates and Company Filings)
Margin-wise, management expects incremental adjusted operating margin between 25-30% to 2027, with the actual margin in 2027 expected to surpass 22.5%. It currently is at ~21%.
Combining different top-line CAGRs with different incremental both within management’s guidance range, it is easy to surpass the 22.5% margin by 2027. Below, I show the implied 2027 margin based on these different cases:
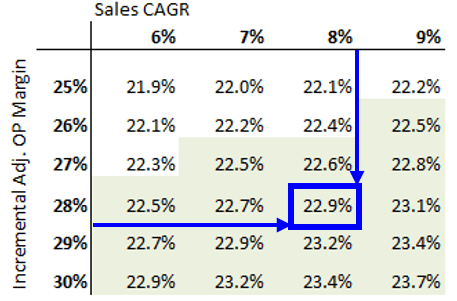
2027 Adj. Op. Margin based on different assumptions (Author Estimates)
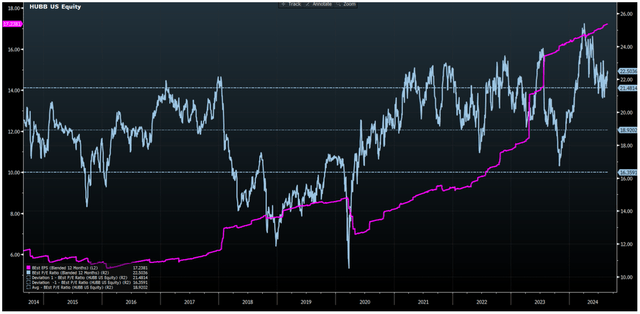
For context, management significantly outperformed their prior margin guidance on the back of unexpectedly strong pricing actions since ’21-’22 (notice the jump in operating margin estimates in the red box):
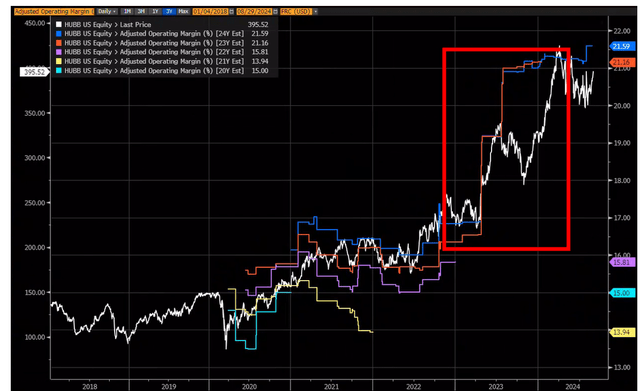
Margin estimates revised upwards (Bloomberg)
Management expects pricing to more cost neutral from now on (passing down cost inflation to customers) and that most margin uplift will come from productivity gains. However, there seems to be uncertainty in market discussions about whether Hubbell can hold on to this pricing.
If it can, I believe the 22.5% adjusted operating margin should be easily attainable at an incremental not much higher than its current margins.
To get down to EPS, I also assume repurchases reduce share count by ~0.3% annually, in line with the overall historical trend.
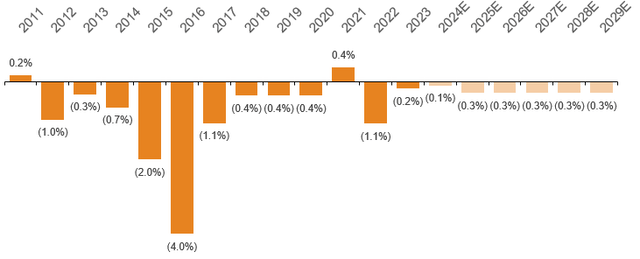
Shares outstanding growth rate (Company Filings & Author Estimates)
This gives a ~12% EPS CAGR to 2027. Adding it Hubbell’s 1.3% dividend (assuming the yield is constant), total shareholder returns should be at ~13% annualized by 2027.
Management guides for double-digit EPS growth, so this number checks out with their expectations.
Will Estimates Be Thrown Off By Macro Shocks?
Historically, Hubbell’s revenue growth has been resilient. We can see constant positive growth going back to 2010 (excluding 2020) backed by solid organic numbers:
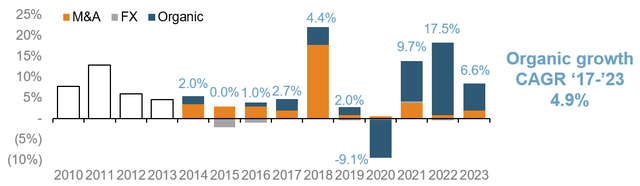
Historical revenue growth by factor (Company Filings formatted by author)
On the HUS side, this is not that surprising; the components they sell are a must-have and utilities’ spending is less exposed to macroeconomic cycles than for HES customers.
The segment has been increasingly correlated to utilities’ CAPEX as utility spending are shifting from break-and-fix (OpEx) mode to more proactive maintenance, expansion, and hardening of the grid (CAPEX).
While capital expenditures in general can fluctuate more than operational expenses, utilities’ spending growth is driven by the interplay of several secular trends which I expect to create sustainable elevated growth.
Equity Research
On the HES side, about 80% of their revenues are from end-markets prone to shift spending based on the economic cycle, and while 20% of overall costs are raw materials, we have not seen high correlation to general commodities’ inflation historically:
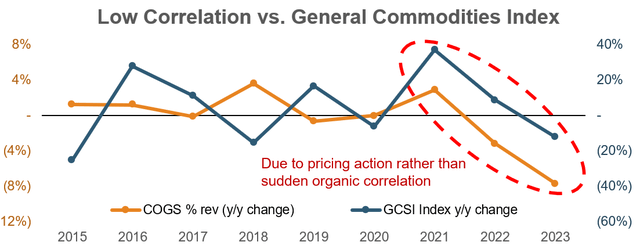
Company Data
Undemanding Valuation
Currently trading at ~21x forward EPS expectations with expected double-digit EPS growth over the next several years, Hubbell’s multiple is certainly justifiable.
Blended forward P/E and EPS (Bloomberg)
Assuming an EPS CAGR of 11% over a 5-year period and a 21x starting multiple with 1% dividends, the path to >10% returns is clear:
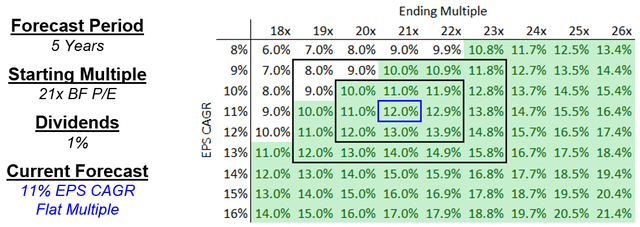
Stock Return Sensitivity (Analyst Estimates)
As long as Hubbell can hold on to (or expand) its current multiple, this should be an easy bar to clear. This would happen if the market grows more confident that Hubbell can hold on to its pricing (and margins) increase and that it will hold its leading competitive position within secular grid spending growth trends.
The biggest underperformance risk would be faltering margin if Hubbell indeed cannot hold on to pricing increases, which would not only hurt financial results but seriously put in question my pricing power/non-commodity/competitive advantage thesis. But so far, so good.
Conclusion
Hubbell is one of the rare companies directly exposed to the inflection in utility capex that is expected to last for more than a decade
Its products are an essential to the improvement and expansion of the grid, and Hubbell is the clear leader in portfolio breadth, depth, and quality among fragmented competitors.
Its proven pricing power, careful capital allocation, dominant competitive positioning, and growth driven by secular trends.
These trends build into expectations of significant growth despite just trading at ~20x. I believe Hubbell is one of the most focused and attractive plays in electrification today.
Read the full article here