


Investment briefing
Broad utilities are well positioned to capture risk premia emerging from a number of crosscurrents. Naturally, the large providers are worth screening for IDACORP (NYSE:IDA) came on our list given its extensive history and strong capital returns to shareholders over the last 10 years.
IDA was established in 1915 and primarily operates through its subsidiary, Idaho Power. Idaho Power is positioned at all points in the electric supply chain, from generation all the way downstream. Its service area covers ~24,000 sq. miles in southern Idaho and eastern Oregon. It therefore falls under Idaho and Oregon regulations and the Federal Energy Regulatory Commission.
In the utilities sector, more so in electrical utilities, one of the critical challenges is the absence of differentiation, whether it be in terms of cost or product offerings. There are no apparent advantages from a consumer standpoint or in terms of branding and that kind of thing. Most providers are bound by similar pricing mechanisms and are indistinguishable in terms of their offerings—they all sell the same product at the end of the day. It’s akin to iron ore mining, where the product everyone sells is iron ore. As a result, the economic characteristics of each company, such as production and efficiency advantages, become the key differentiators.
On my examination, IDA doesn’t capture either category. This report will unpack all the moving points from this standpoint, linking back to the broader hold thesis. Net-net, I rate IDA a hold.
Figure 1.
Data: Updata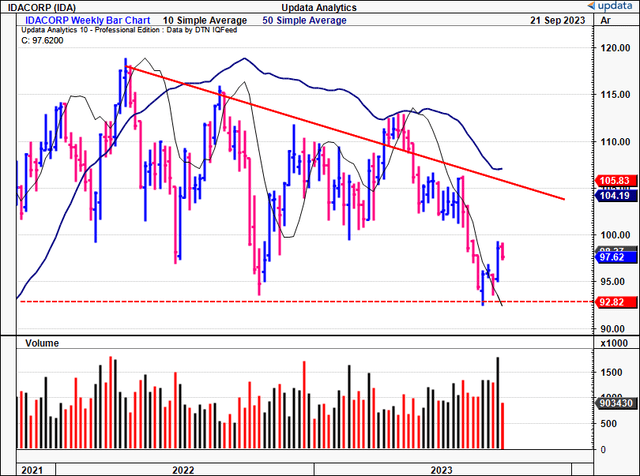
Critical investment facts to hold thesis
A quick note on dividends
One of the critical facts not discussed in the facts pattern today is IDA’s dividend. Income investors would no doubt be drawn to the capital returns IDA sustains each quarter and year. It has increased every year for the last 9, as seen below. This is indeed commendable. You’re looking at a 3% forward yield as I write.
Source: Seeking Alpha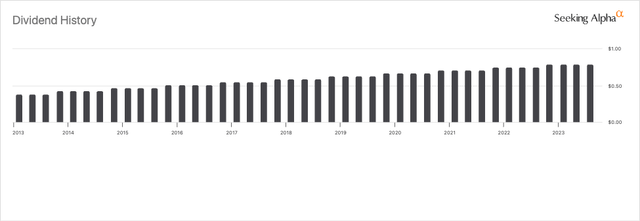
Aside from the economic factors outlined here today, the only issue I have are the restrictive covenants governing the dividend payout. The ability of IDA to pay and grow dividends on its common stock is subject to certain limitations. These are outlined in its credit facilities and reiterated in Idaho Power’s revised code of conduct. One of these limitations requires IDA to maintain a leverage ratio (debt to total capital) not in excess of 65% on a quarterly basis. As of Q2 this year, IDA had a 47% ratio. To comply with this convention, IDA’s dividend payout was capped at $1.5Bn in Q2.
1. Q2 and YTD ’23 insights
-
Unpacking Q2 and H1 ’23 financials
IDA’s customer base grew by 2.1% YoY in Q2, booking an additional $4.1mm in operating income in Q2. Residential customer growth remained strong at 2.3%, whereas total customer growth climbed another 2.2% through July, per management. On the revenue front, top-line revenues were $413mm, up 15% YoY. For the YTD, retail revenues made up 85% of total turnover, clipping $672.4mm, up from $697.4mm in H1 last year. As seen in Figure 2, the pre-tax margin was steady YoY at 31%, lifting off December ’22 lows of 21%.
The company also clipped a 1% increase in transmission wheeling costs for customers compared to Q1 ’23, caused by its transmission tariff rate increase in October last year. This added another $1.7mm of growth in operating income.
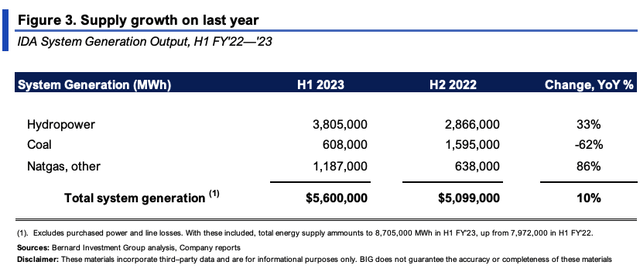
System generation numbers from H1 FY’22—FY’23 are seen in Figure 3. Hydropower generation grew 33% YoY, natural gas generation was up 86% to 1.18MM MWh, whereas coal was down 62% YoY to 0.6MM MWh. IDA maintained its hydropower generation projections between 6MM—7.5MM MWh for the year. This projection is lower than IDA’s 30-year average of 7.7MM Mwh but still higher than the actuals of 5.3MM Mwh in ’22. Management also forecasts operations and maintenance expenditures in a range of $385mm—$395mm for FY’23.
BIG Insights BIG Insights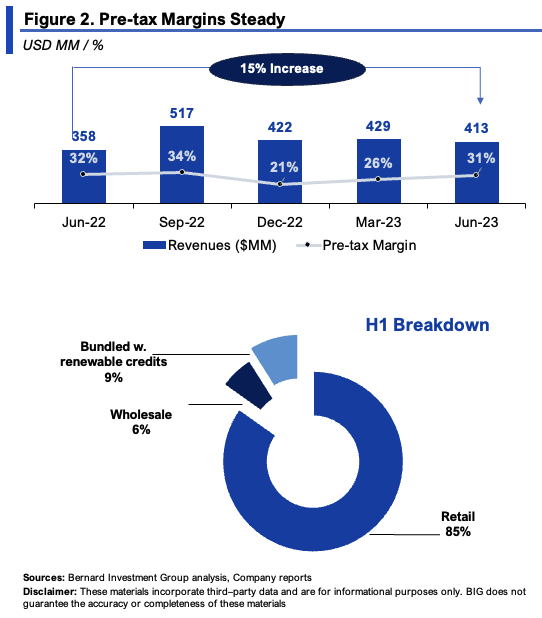
-
Regulatory updates and infrastructure investments
IDA submitted a request for a general rate increase in Idaho in June. The proposed rate increase amounts to $111mm, or 8.61% on average for Idaho customers. The company intends for the new rates to take effect on January 1st, 2024. IDA’s last base rate filing was around 12 years ago. Since then, it’s invested >$3Bn in grid and company infrastructure.
Additional investments made in its energy portfolio during H1 FY’23 include:
-
Battery storage facility (150 MW): It entered into an agreement to use a 150-megawatt battery storage facility. This agreement (if approved, it’s still in the hands of the regulators) will result in an increase of ~$431mm in contractual obligations over the course of 20 years. The facility is expected to be operational by June 2025.
-
Hydropower facility replacement (20 Years): Renewed its agreement with one of its hydropower facilities to replace an expiring power purchase agreement. This extension increased IDA’s purchase obligations by approximately $29.1mm over 20 years.
-
Natural gas storage capacity (1Bn cubic feet): IDA signed a deal in June to utilize up to 1Bn cubic feet of natural gas storage capacity, starting in April 2025. This agreement increased the company’s contractual purchase obligations by around $24.4mm over a 10-year period.
-
Battery storage assets (36 MW): Finally, the company bought 36 MW of battery storage assets, increasing its contractual purchase obligations by ~$52.6mm for 1-year. The batteries are expected to become operational in the spring of 2024.
The investments here are duly noted and link to the analysis performed a bit further down.
2. Economic analysis of value and performance
Being in an undifferentiated industry, it is the idiosyncratic elements that separate the winners and losers. A detailed economic analysis of IDA is helpful in this regard. Specifically, a detailed analysis of (i) the company’s core assets/investments, (ii) more importantly—what is it getting out of these assets, and (iii) at what rates of return on capital.
Figure 4 illustrates IDA’s net working capital (“NWC”) efficiencies. Each $1 invested in NWC is recycled back to cash in less than 1 month on average, whereas DSO’s have trimmed to ~40 days in ’23. This is favorable.
BIG Insights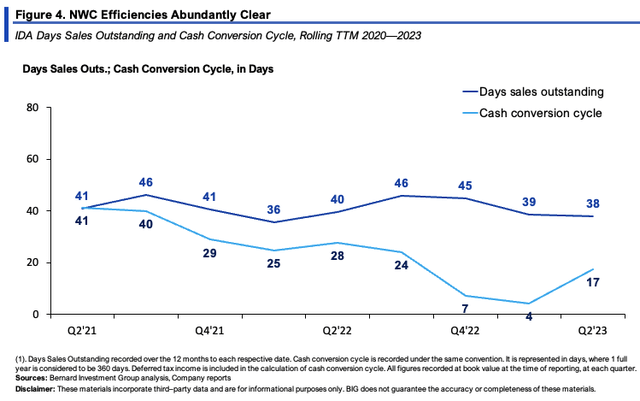
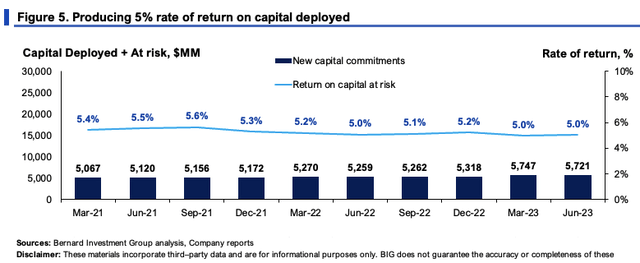
By the end of Q2 IDA had $5.7Bn or $113/share of capital invested into the business, ~107% of what investors have provided to finance these assets. As seen in Figure 5, the $5.7Bn produced $5.67/share in trailing NOPAT last period, a 5% rate of return—in line with last 2-year’s range. So the company is garnering around $5–$5.70/share on its core assets each rolling TTM period. This is built from post-tax margins of 16—19%, and capital turnover of just 0.25–0.3x.
BIG Insights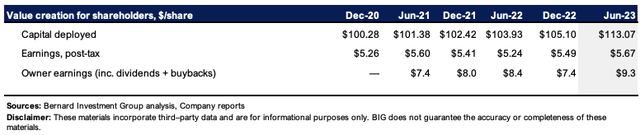
A 5% rate of return on capital isn’t the most attractive proposition. We employ a 12% required return on investments across all equity holdings. As mentioned earlier, I want companies that are sensible users of capital. The 12% hurdle rate also corresponds to long-term market averages. In Figure 6 you can see the difference in what IDA needed to produce in NOPAT off its c.$5–$6Bn in capital to meet this threshold. The difference is recorded as an economic loss here, amounting to $400mm in the TTM to Q2 FY’23.
BIG Insights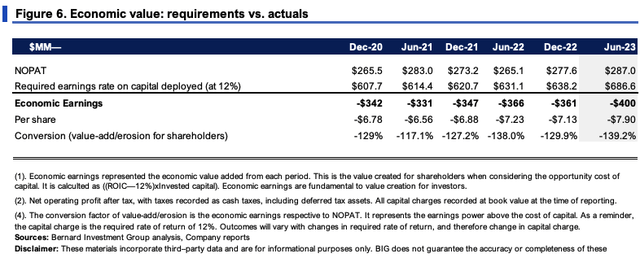
3. Value drivers and steady-state expectations
IDA’s growth drivers from 2020–date are seen in Figure 7. Sales growth, whilst tight at 2.8%, pulled in a ~21% pre-tax margin on average. Critically, the capital allocation has been all to fixed assets, and I’d say this is more than expected given the nature of the business. Each new $1 in sales was accompanied by a $1.72 investment in fixed capital. The company was able to reduce its NWC requirements by $0.2 for every $1 in new sales over this time, squaring off with the economics outlined in Figure 4.
BIG Insights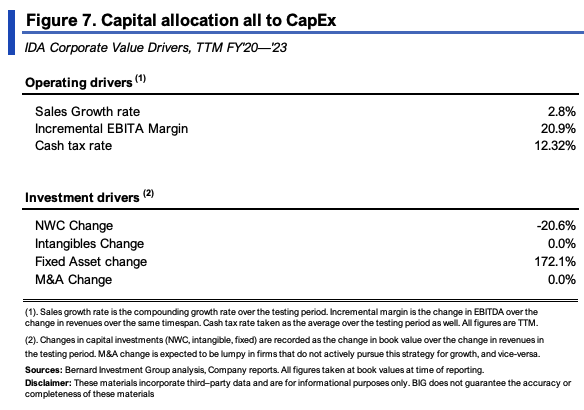
This is important to gauge the capital requirements moving forward. Per the company:
“We still expect this year’s CapEx spending to be in the range of $650mm to $700mm, and we’re trending at the higher end, we’re working on capital budgeting for next year and expect 2024 CapEx could be larger than what we predicted for 2024 at the beginning of this year.”
Figure 7(a).
Source: IDA Spring 2023 Investor Outreach, BofA Utilities and Clean Energy Conference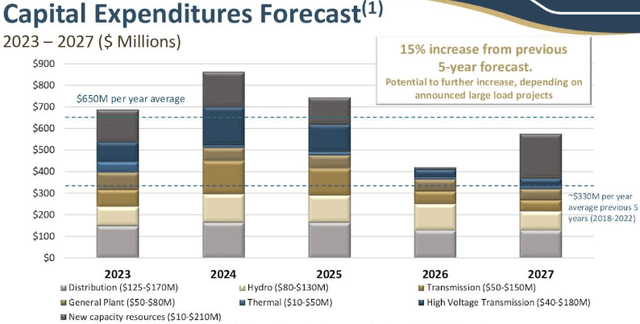
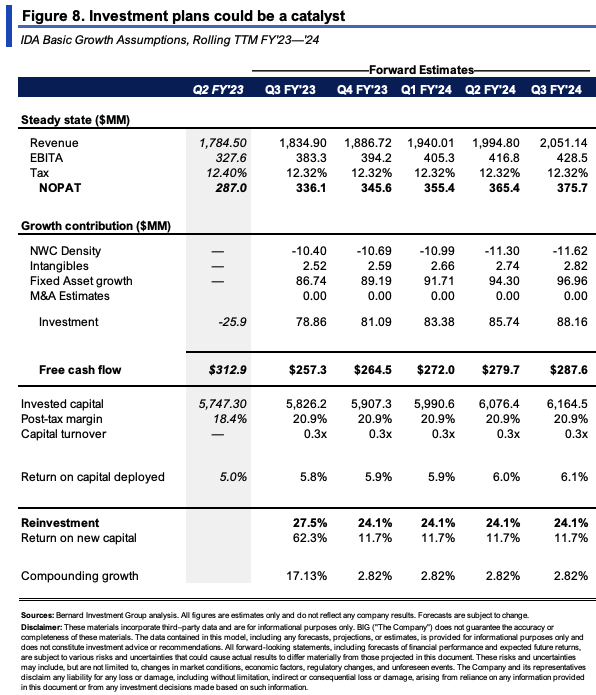
Should it continue exactly at the rates shown in Figure 7, the output would resemble what’s seen in Figure 8. It would invest ~$80–$88mm per quarter adjusting for NWC, getting to $458mm over the coming 12 months. Notably, this would fall short of its expectations, and throw off $260–$287mm each period.
To hit its CapEx targets at the stipulated investment rates in Figure 7, I’d estimate it would need to grow sales at 4%. So its base rate increases are essential to capture by FY’24 for this to materialize in my view. Critically, consensus has IDA to print a 4% revenue growth in FY’24, adding some weight to the case here. Shifting to this level of revenue upside would crimp FCF to $230–$267mm in this model.
( )
BIG Insights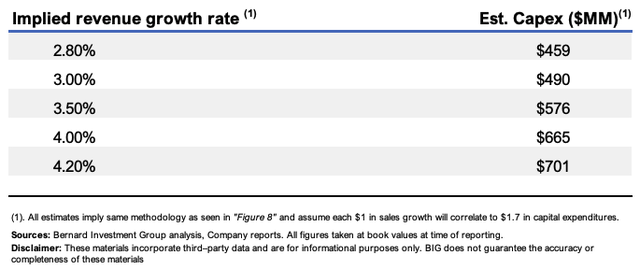
Valuation and conclusion
The stock sells at 19.2x forward earnings and ~24x forward EBIT as I write, both premiums of 14% and 28% to the sector, respectively. This looks richly priced in my view.
For one, the sector trades at 18x EBIT. Secondly, IDA has created just $1.70 in market value for every $1 in net asset value. As a cleaner measure, it has created $1.28 in EV for every $1 of invested capital, just 28% market return on investment. Again, not attractive in my view, and it implies the market values IDA’s capital low.
Consider the following:
(1). Compounding IDA’s intrinsic value at the function of its ROIC and reinvestment rates gets you to ~$5.2Bn in market value or $102/share, excluding dividends. All dividends paid up, You’re looking at $105/share.
BIG Insights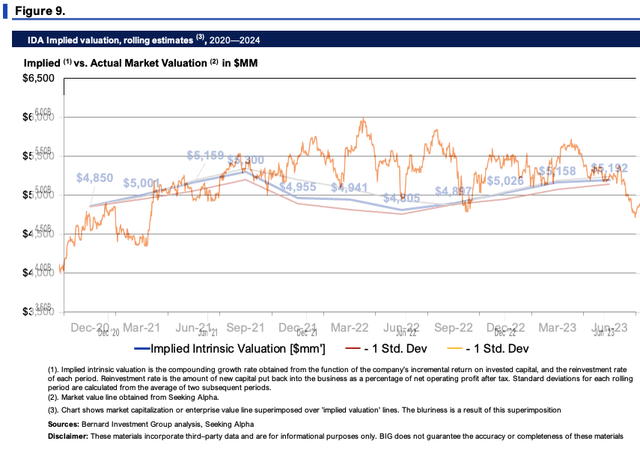
Figure 10.
Source: Seeking Alpha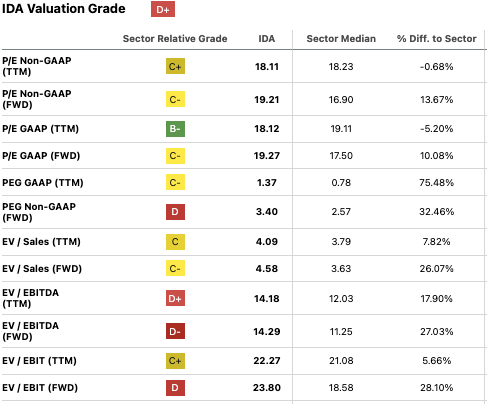
(2). Extending the steady-state numbers in Figure 8 out to FY’28, and discounting back at the 12% hurdle rate, gets you to $107/share in value. Blending this with the compounding rate of intrinsic value averages to $108/share in implied value. Either way, I get to $105–$108/share, around 8–11% value gap as I write.
Source: BIG Insights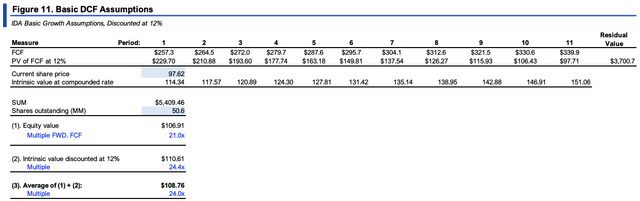
In short, IDA does not meet the required economic characteristics I am looking for within this industry. It has exhibited post-tax margin growth these past 3 years, backed by (i) customer growth and (ii) a favorable macroeconomic bedrock. But this is a capital-intensive business, producing a sustained 5% rate of return on capital deployed. It looks to invest $650mm avg. CapEx each year out to ’25. To me, IDA would just be ploughing more money into sub-par investment returns just to keep its competitive position. It would need to achieve revenue growth of 4% to hit these numbers as well in my opinion. To me these are not attractive economics, supporting a hold rating.
Read the full article here