

The Invesco S&P International Developed Momentum ETF (NYSEARCA:IDMO) leverages a price appreciation-focused strategy applied to developed world equities (ex-U.S. and ex-South Korea). The uniqueness of the fund is that, unlike most other international equity ETFs, it has delivered a double-digit return this year and even beat the iShares Core S&P 500 ETF (IVV) in the first five months by 1.84%.
Nevertheless, despite IDMO’s encouraging recent performance, I reckon investors should exercise caution when considering this vehicle, as longer-term data suggest risks and disadvantages are aplenty. The main issue here is that it was unable to keep pace with the U.S. market, plus it had a hardly comfortable downside capture ratio. I would like to cover these aspects and offer a glimpse into IDMO’s portfolio below in the note.
Key points of IDMO strategy
Since its inception in February 2012, IDMO has garnered an AUM of $227.9 million. Assuming all the complexities of an international stock portfolio, its expense ratio is fairly low at 25 bps.
As we know from its website, the basis for its strategy is the S&P World Ex-U.S. Momentum Index. An important remark here is that, previously known as the S&P Momentum Developed ex-U.S. & South Korea LargeMidCap Index, the benchmark was renamed in May of this year. However, the index rebranding was not assisted by methodological changes, and it still excludes Korean stocks.
I should explain that there are differences in index providers’ market classifications. As I have already discussed in the past, for example, in the December 2020 article on the iShares MSCI World ETF (URTH), MSCI (MSCI) considers Korea an APAC emerging market. This has not changed since then, as the results of the MSCI 2024 Market Classification Review announced on June 20 illustrate. S&P Dow Jones Indices assigned Korea a developed market status in 2001. So here, when it comes to this particular index, it seems S&P DJI’s stance on Korean equities makes it more similar to benchmarks provided by MSCI.
To qualify for inclusion, a candidate must “have the highest momentum score.” From the prospectus, we know that the said score is based on
the percentage change in the stock’s price over the last 12 months, excluding the most recent month, and applying an adjustment based on the security’s volatility over that period.
From the eligible names, the top 20% with the strongest scores join the index. The weighting schema is based on the modified market cap. As to rebalancing and reconstitution, the IDMO website says they are held “semi-annually on the third Friday of March and September.”
Before we proceed to the discussion of returns, it is important to note that, as we know from the fact sheet, before March 18, 2016, the ETF tracked the S&P BMI International Developed High Beta Index. So it makes sense to ignore performance delivered prior to the strategy change.
IDMO returns
In the first five months of the year, IDMO has seen fairly robust performance as it beat IVV by 1.84%. But owing to June sluggishness driven in part by the Japanese yen slump, as the U.S./Japan interest rate differentials weigh on traders’ sentiment, it is no longer ahead of the S&P 500 ETF YTD. This is also the case with the iShares MSCI Intl Momentum Factor ETF (IMTM).
| ETF | January-June 2024 return |
| IDMO | 13.61% |
| IMTM | 14.33% |
| EFA | 5.79% |
| IVV | 15.28% |
Data from Portfolio Visualizer
Nevertheless, the Japan- and UK-heavy iShares MSCI EAFE ETF (EFA) has trailed all the mentioned funds, delivering a just 5.79% return.
Regardless, even though IDMO is no longer ahead of the S&P 500 ETF in 2024, its results this year are worth appreciating. But here might emerge a temptation to use a short-term performance as a presupposition for a Buy thesis. This is wrong. IDMO is a momentum-based strategy, and returns delivered by that factor are usually fickle. At the end of the day, it is always about finding the most opportune moment to buy into.
The problem is that, zooming out, we see multiple disadvantages. As I said above, the flip side of the international equity momentum strategy includes its long-term underperformance and a hardly comfortable maximum drawdown, with its FX exposures being among the main drivers. To corroborate, let us look at the April 2016-June 2024 period.
| Metric | IDMO | EFA | IVV | IMTM |
| Start Balance | $10,000 | $10,000 | $10,000 | $10,000 |
| End Balance | $20,865 | $17,627 | $30,675 | $19,161 |
| CAGR | 9.32% | 7.11% | 14.55% | 8.20% |
| Standard Deviation | 14.98% | 15.47% | 15.80% | 14.37% |
| Best Year | 29.18% | 25.10% | 31.25% | 25.46% |
| Worst Year | -16.64% | -14.35% | -18.16% | -16.80% |
| Maximum Drawdown | -25.27% | -27.58% | -23.93% | -28.57% |
| Sharpe Ratio | 0.55 | 0.41 | 0.83 | 0.5 |
| Sortino Ratio | 0.83 | 0.6 | 1.28 | 0.73 |
| Upside Capture | 72.77% | 73.32% | 100.22% | 71.71% |
| Downside Capture | 82.18% | 94.93% | 96.76% | 86.54% |
Data from Portfolio Visualizer
What we see here is that IDMO did a solid job outperforming equities from Europe, Australasia, and the Far East proxied with EFA and even its peer IMTM, which also favors momentum stocks and ignores Korean equities (in line with MSCI’s market classification). To give a bit more color, it trailed EFA only in 2016 (April-December) and 2018. However, when compared to the U.S. market proxied with IVV, IDMO looks much weaker as its annualized return was significantly lower, while the maximum drawdown was deeper.
So the takeaway is that investors who were seeking more diversification from the tech-heavy U.S. market and thus decided to venture into developed markets with a goal to bolster returns and possibly minimize some FX headwinds using the momentum factor were likely disappointed with IDMO.
What is inside the IDMO portfolio at the moment?
As of June 27, there were 200 stocks in IDMO. The main five holdings account for almost 25% of the net assets. Yes, this portfolio is rather top-heavy.
IDMO is somewhat similar to its peer IMTM, as both feature industrials as the top sector, in contrast to EFA. Still, the Invesco ETF is much lighter in financials, while it is overweight in consumer staples, utilities, and consumer discretionary, to name a few.
Data in % (Created using data from the ETFs)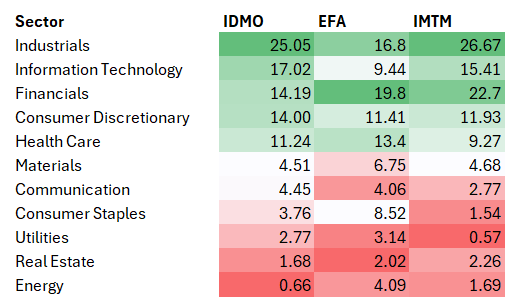
The ETF has a country mix that is rather standard for an ex-U.S. developed markets strategy. However, the proportions are somewhat unique, as IDMO is rather overallocated to Japan, with the country accounting for 54.7% of its portfolio. For context, even though this APAC nation is front and center of a great deal of international portfolios, with EFA having 22.5% allocated to it and IMTM having 41.7%, IDMO has one of the largest exposures to the country (excluding pure-play Japan portfolios).
In this regard, it is clear that IDMO carries even more yen risk than IMTM. It is true that the surging Nikkei 225 index (hence, overall bullishness in Tokyo) has grossly contributed to the ETF’s performance this year. But the issue here is that when the Japanese market is up and the currency is down (to the level seen in 1986, to be precise), in dollar terms, the contribution looks much smaller.
Seeking Alpha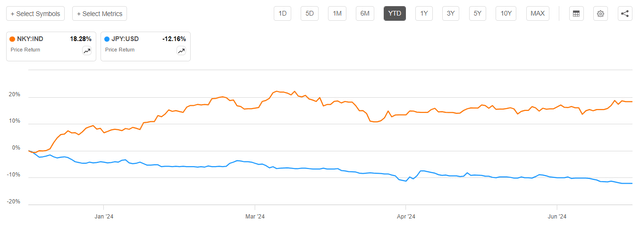
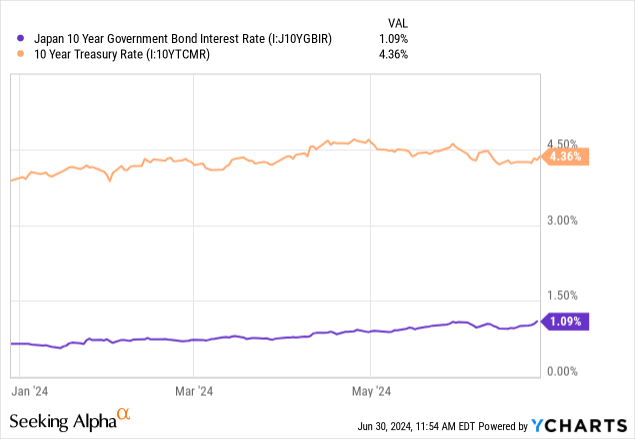
I should say that the recently presented U.S. PCE price index data for May might look very much in favor of a bit weaker dollar and a bit stronger JPY as the results justify interest rate cuts soon, yet I would abstain from expressing an overconfident bullish view here as the interest rate differentials remain fairly wide and a bit looser monetary policy in the U.S. might not be enough to significantly bolster the ailing yen.
Regarding the main holdings, Novo Nordisk A/S (NVO) (Copenhagen ticker NOVO B) is the key stock in the mix with a 9.5% weight. Chiefly thanks to NVO, Denmark has 9.9% weight in the IDMO portfolio. The UK comes second with 6.6%.
Invesco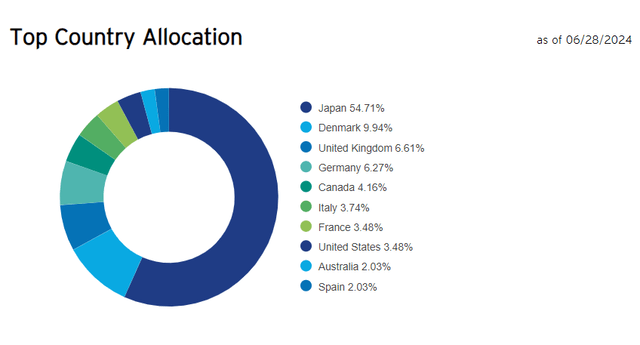
This is in contrast to IMTM, as it has smaller Japan exposure, while France and Germany are in second and third places.
Created by the author using data from IMTM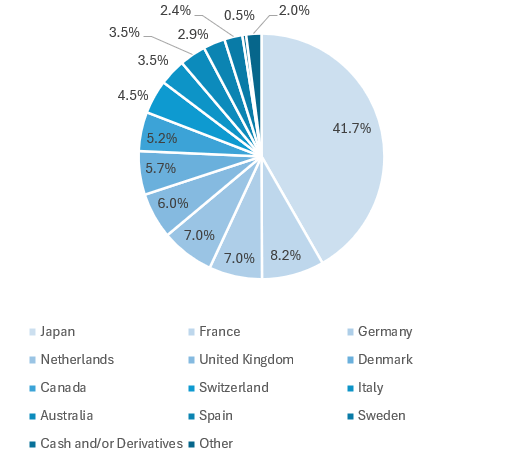
Below are IDMO’s top five holdings, with a few select metrics added.
| Adjusted ticker | Stock | Weight | Original ticker | Market Cap | Valuation Grade | Profitability Grade | YTD Perf |
| (NVO) | Novo Nordisk A/S | 9.5% | NOVOB DC | $640.5 billion | F | A+ | 37.98% |
| (TM) | Toyota Motor Corp | 5.5% | 7203 JP | $275.46 billion | B+ | A+ | 11.77% |
| (SAP) | SAP SE | 4.7% | SAP | $235.28 billion | F | A+ | 30.48% |
| (OTCPK:HTHIY) | Hitachi Ltd | 2.7% | 6501 JP | $103.66 billion | D- | A- | 55.76% |
| (OTCPK:TOELY) | Tokyo Electron Ltd | 2.4% | 8035 JP | $100.07 billion | – | – | 23.26% |
Created using data from Seeking Alpha and the ETF. The price performance is shown for the U.S. quoted securities (the ‘adjusted ticker’ column)
Conclusion
In sum, IDMO is an interesting option for developed markets ex-U.S., ex-Korea exposure. It has been marching higher this year, even beating the S&P 500 ETF in the first five months, but this fact certainly should not be used as the main and only premise for a bullish thesis. The primary issue is that, as with any other momentum strategy, IDMO is very much about finding the perfect time to buy into it. For instance, it performed stellar during the pandemic, as it beat IVV in 2020. It was also less afflicted by the 2022 bear market. But over the longer term, the strategy was unable to outperform the U.S. market, mostly because IDMO’s approach is not capable of shrugging off currency risks completely. Besides, it has a high turnover of 131%. In this regard, a Hold rating looks nicely balanced.
Read the full article here