


Overview
The past few weeks have been eventful for IDT Corporation (NYSE: IDT) with it releasing its 4Q23 results. I thought the result was decent, and the announcement of IDT emerging victorious in its lawsuit against Straight Path Communication was great news for existing shareholders. Since my last few coverages on the company, I believe that the company continues to be mispriced by the market, although it is warranted given the delay in the spin-offs. Nevertheless, IDT’s high-margin recurring revenue segments have continued to perform, which is what I am mainly concerned about and will be covering in the article.
1. National Retail Solution (NRS)
1.1 Analysis of NRS Financials
NRS Financials as of 4Q23
NRS Operating Metrics as of 4Q23
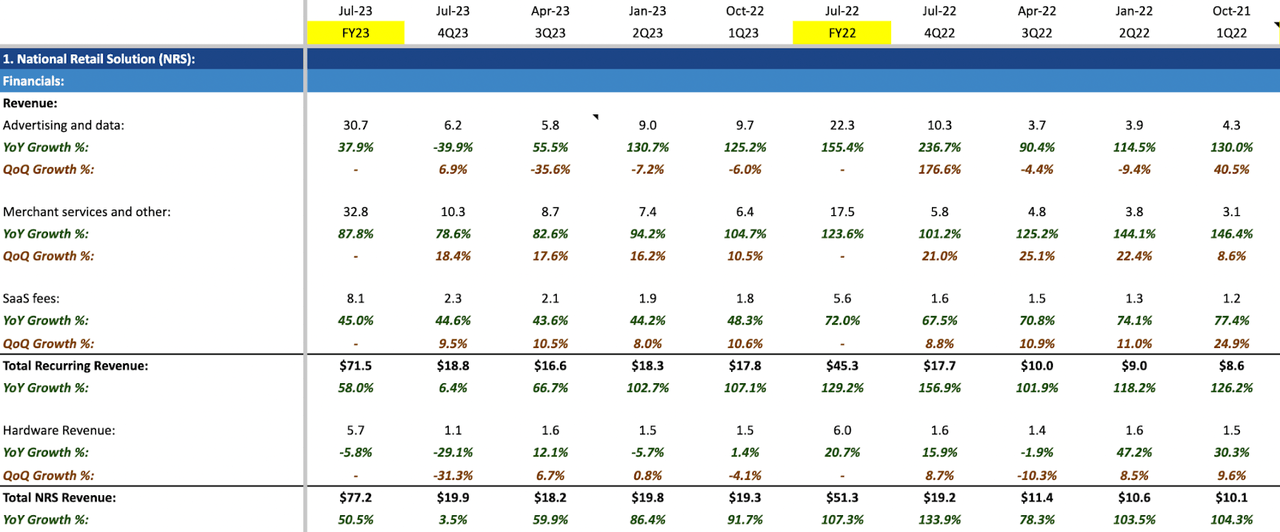
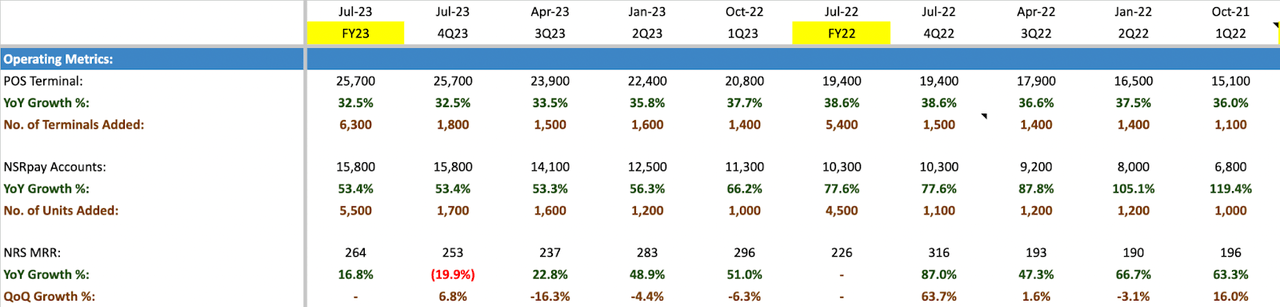
During 4Q23, NRS disclosed a total revenue of $19.9 million, reflecting a mere 3.5% YoY growth – a significant deceleration compared to the 133.9% YoY growth in 4Q22. This was caused by a sharp 40% drop in advertising (“ad”) revenue, stemming from the weak advertising market since its peak in 4Q22. The rest of the recurring revenue segments, however, have performed strongly as NRS continues to acquire more merchants, adding a record high of 1,800 POS terminals and 1,700 NRS Pay accounts in the quarter. This totals the recurring revenue to $18.8 million, a 6.4% growth from the previous year. Hardware revenue declined 29% YoY as discounts are offered on POS terminals for merchants who opt to use NRS Pay.
On a full-year basis, NRS reported a total recurring revenue of $71.5 million, growing 58% YoY, and hardware revenue of $5.7 million, a 5.8% YoY decline. This totals FY23 revenue to $77.2 million, growing 50.5% from FY22.

NRS Financials as of 4Q23
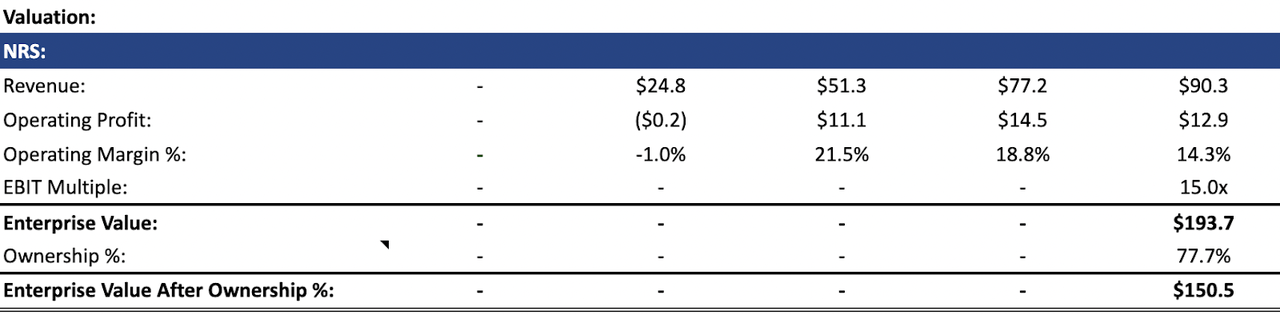
An acceleration in SG&A expenses largely drove the growth in POS terminal and NRS Pay accounts as it grew 20.3% sequentially from 1Q23, which is NRS’ largest sequential increase in a quarter. The drastic slowdown in ad revenue resulted in a 74.3% YoY reduction in operating profit. 4Q23 operating margin came in at 8.5%, marking the second consecutive decrease in margin since 2Q23. On an annual basis, FY23 operating profit grew 31.3% YoY, reaching $14.5 million, and the operating margin stood at 18.8% versus 21.5% in FY22.
1.2 FY24 Valuation
Author’s FY24 Valuation of NRS
NRS’ Relative Valuation
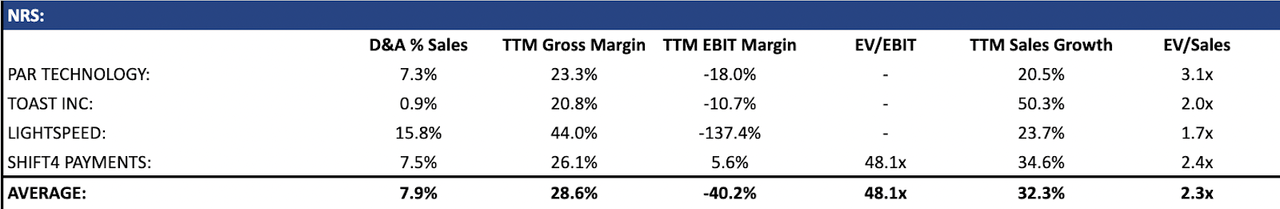
Looking into 2024, advertising revenue is expected to decline on an annual basis since growth in 1H23 was the strongest, and other recurring revenue segments to continue their strong performance. I forecast total revenue to grow at ~17% YoY to reach $90.3 million in FY24, and estimate an EBIT margin of ~14.3%, generating an EBIT of $13.3 million. I believe the decline in growth and margin is warranted given the slowdown in high-margin recurring ad revenue, and expect SG&A expenses to comprise 70% of total revenue as management continues to invest in acquiring more merchants. With its leading industry margin, higher growth profile than peers, and accounting for IDT’s ownership of 77.7% in NRS, an EV/EBIT of 15x (equate to 2.7x EV/sales) produces an enterprise value of $150.5 million.
2. FinTech
2.1 Analysis of Financials
FinTech Financials as of 4Q23
FinTech Financials as of 4Q23
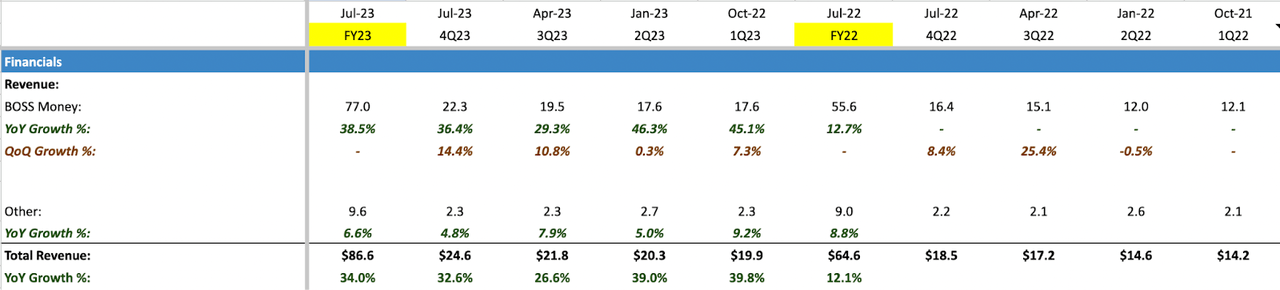
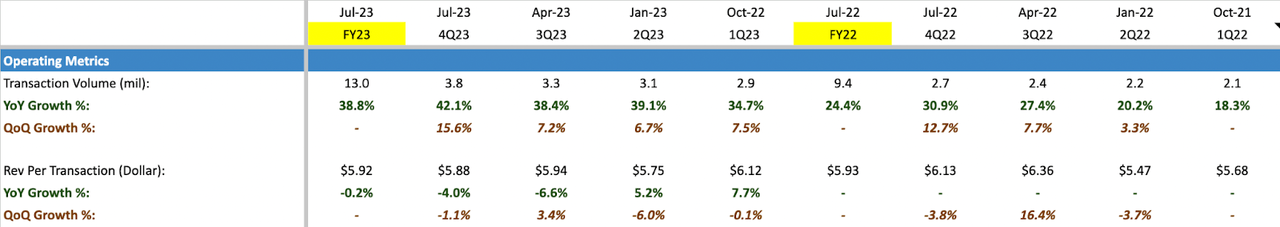
During 4Q23, BOSS Money reported a transaction volume of 3.8 million, marking a 42.1% YoY increase from 4Q22. The revenue per transaction stood at $5.88 million, resulting in quarterly revenue of $22.3 million for 4Q23 — this represents a 14.4% growth from 4Q22. Additionally, other revenue contributed $2.3 million, bringing the total revenue for the quarter to $24.6 million, a 32.6% increase from 4Q22. This is a strong quarter for BOSS Money as growth continues to be driven by both retail and direct-to-consumer channels, cross-marketing programs within the larger BOSS ecosystem, and as well as the expansion of its disbursement network into regions outside of the U.S., particularly in Africa and the Caribbean.
On an annual basis, revenue for BOSS Money and others totals $77 million and $9.6 million, respectively, adding up to a total revenue of $86.6 million for FY23 – representing 34% growth from FY22 compared to 12.7% growth in FY22, marking a significant improvement. However, it is worth noting that FY22 revenue growth was affected by the absence of revenue generated from the temporary foreign exchange market which concluded in FY21.
FinTech Financials as of 4Q23
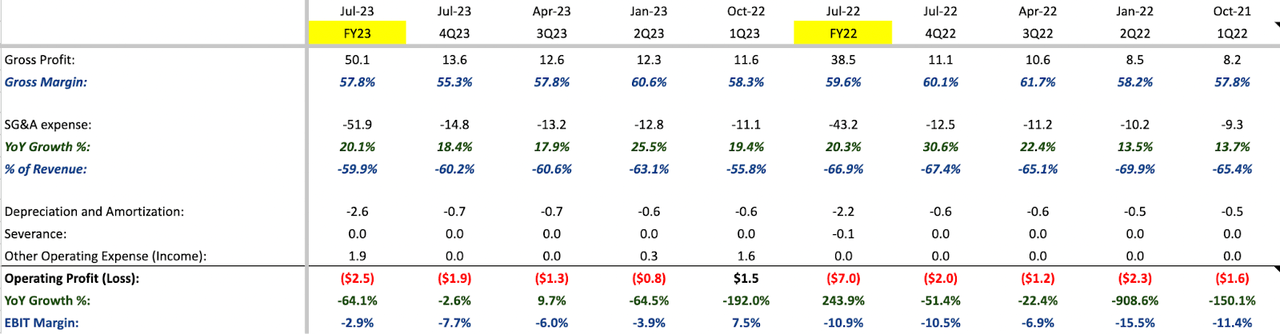
Despite the strong revenue growth by BOSS money, 4Q23 gross margin declined to 55.3% from 60.1% in 4Q22, likely due to a lower profit margin from retail transactions as IDT has to pay transaction-based commissions to retail agents. SG&A as a proportion of revenue declined to 60.2% in 4Q23 from 67.4% in 4Q22, and this was a result of revenue growing at a faster rate than SG&A expenses.
On an annual basis, FY23 gross margin was 57.8% compared to 59.6% in FY22, and SG&A expenses comprised 59.9% of revenue compared to 66.9% in FY22. FY23 operating profit was -$2.5 million, improving 64% YoY, and the operating margin, as a result, rose from -10.9% in FY22 to -2.9% in FY23. This marks a great fiscal year for BOSS Money as a result of its growth in DTC and retail channels, and its successful expansion into international markets.
2.2 FY24 Valuation
Author’s FY24 Valuation of FinTech
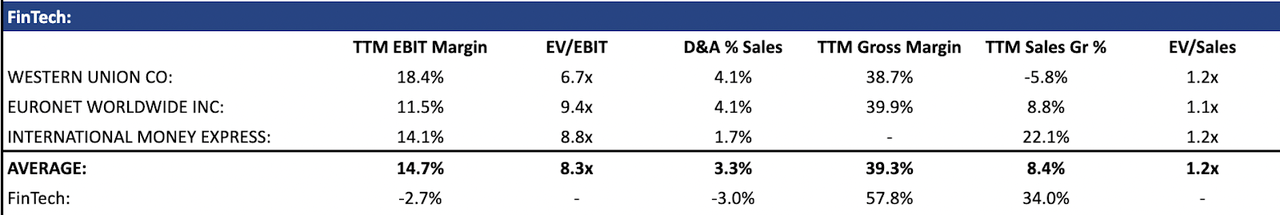
FinTech Relative Valuation
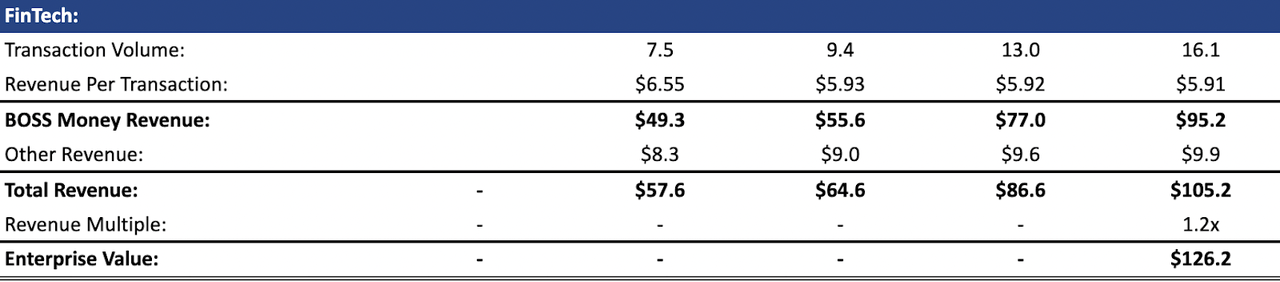
In FY24, transaction volume is forecasted to come in at 16.1 million – representing a 24% YoY increase compared to 38% YoY increase in FY22, and with a revenue per transaction of $5.92, which remains relatively unchanged from FY22, this generates BOSS money revenue of $95.2 million, and with an estimated other revenue of $9.9 million, this adds up to a total FinTech revenue of $105.2 million in FY24 – representing a 21.4% YoY increase from FY23. FinTech is, however, very likely to be still unprofitable by FY24. Hence, using a revenue multiple of 1.2x produces an enterprise value of $126.2 million.
3. Net2Phone
3.1 Analysis of Financials
Net2Phone Operating Metrics as of 4Q23
Net2Phone Operating Metrics as of 4Q23
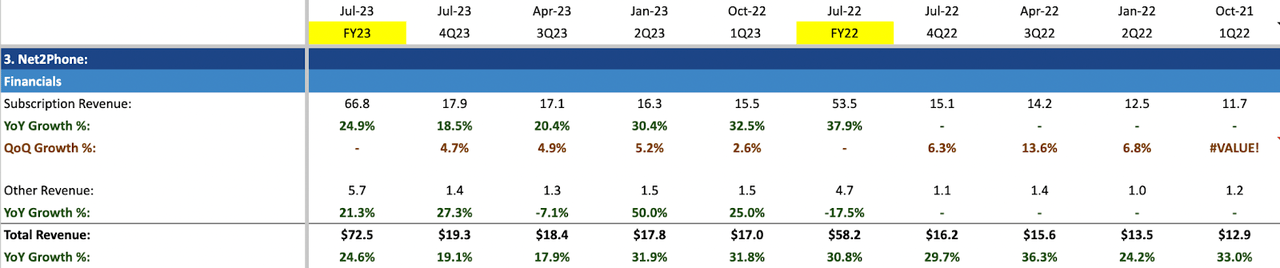
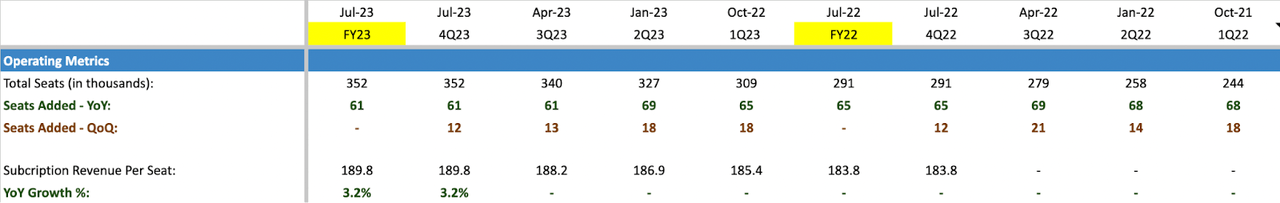
Net2Phone subscription revenue came in at $17.9 million, an 18.5% YoY growth from 4Q22, driven by growth in subscription revenue in the U.S. and Latin America. This growth also reflects the 12,000 seats added during the quarter. As of FY23, its seats totaled 352,000. FY23 total revenue, including other revenue, amounted to $72.5 million, growing 24.6% annually compared to 30.8% growth in FY22. Revenue per seat stood at $189.9 in FY23 – a 3.2% YoY increase from FY22.
Net2Phone Financials as of 4Q23
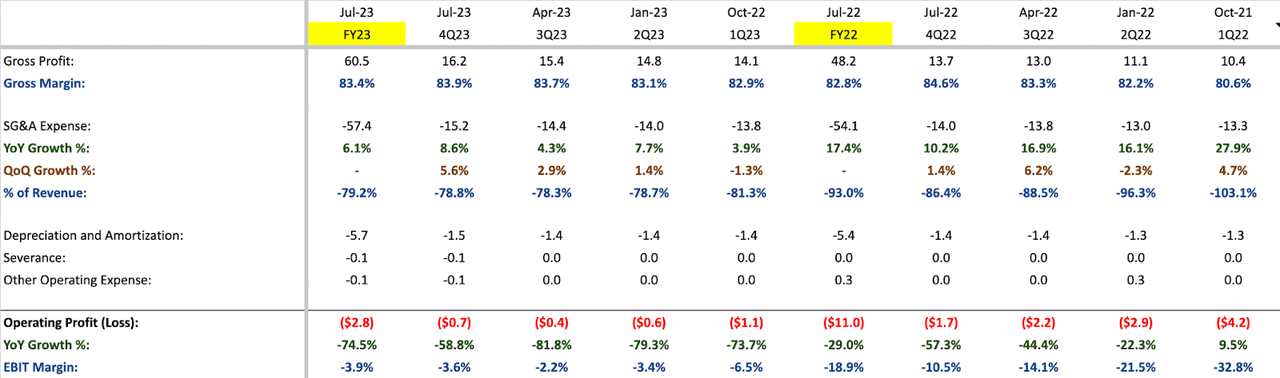
4Q23 gross margin stood at 83.9% compared to 84.6% in 4Q22, likely due to the lower revenue per seat generated from customers in regions outside of the U.S. Although, on an annual basis, FY23 gross margin was 83.4%, marking a 0.6% improvement from 82.8% in FY22 as revenue growth exceeds the growth in direct cost of revenue.
On a quarterly and annual basis, SG&A expenses as a proportion of revenue also declined due to faster revenue growth. FY23 operating margin stood at -3.9% compared to -18.9% in FY22.
3.2 FY24 Valuation
Author’s FY24 Valuation of Net2Phone
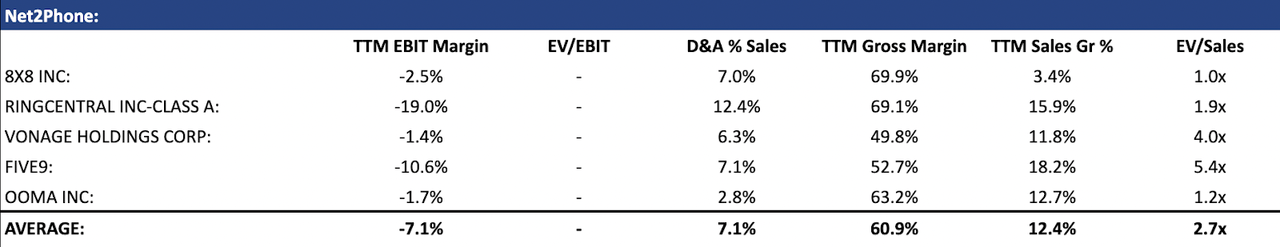
Net2Phone Relative Valuation
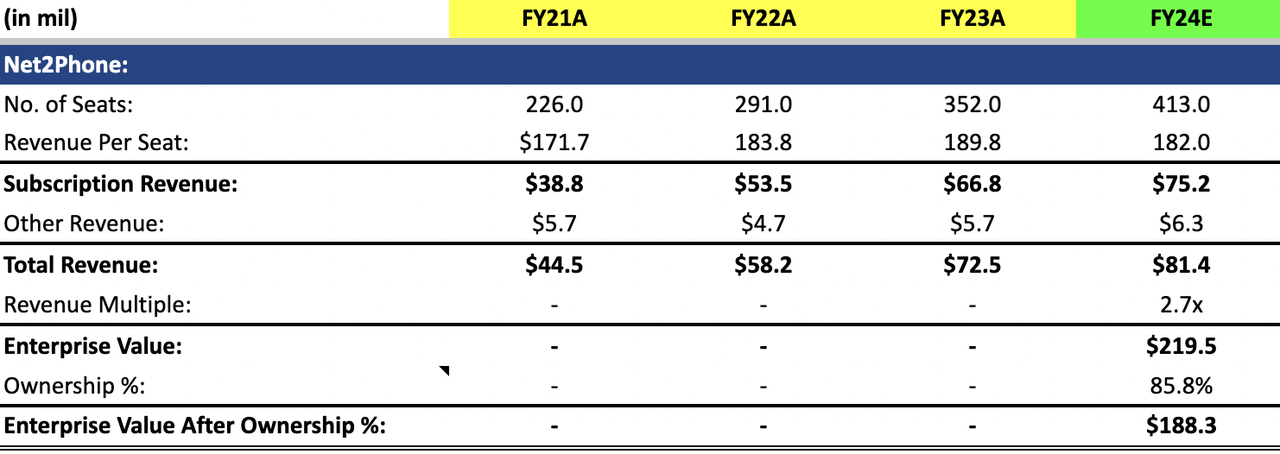
In terms of valuation, I forecast Net2Phone to add 61,000 seats, bringing its total seats to 413,000 in FY24, and with a revenue per seat of $182, this generates a subscription revenue of $75.2 million – a 12.5% growth from FY23. Including an estimated other revenue of $6.3 million, FY24 total revenue adds up to $81.4 million, growing 12.3% from FY23. An implied relative revenue multiple of 2.7x generates an enterprise value of $188.3 million after accounting for IDT’s 85.8% ownership in Net2Phone.
4. Traditional Communication
4.1 Analysis of Financials
Traditional Communication Financials as of 4Q23
Traditional Communication Operating Metrics as of 4Q23
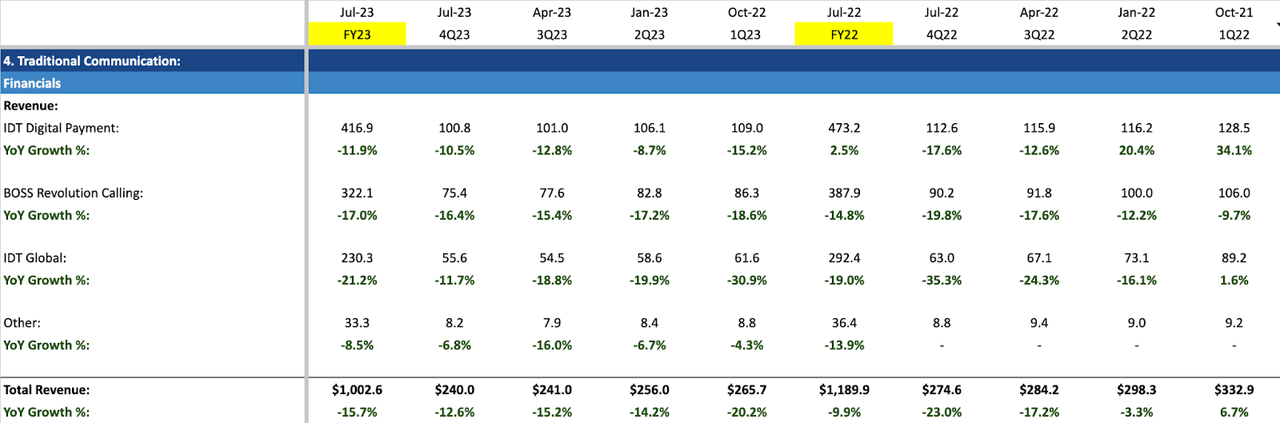
4Q23 Traditional Communication revenue totaled $249 million, marking a 12.6% decline from 4Q22. On an annual basis, FY23 revenue totaled $1,002.6 million, which is a 15.7% decline from FY22. Given the nature of this diminishing legacy business, revenue will continue to decrease, but at a slower rate moving forward.
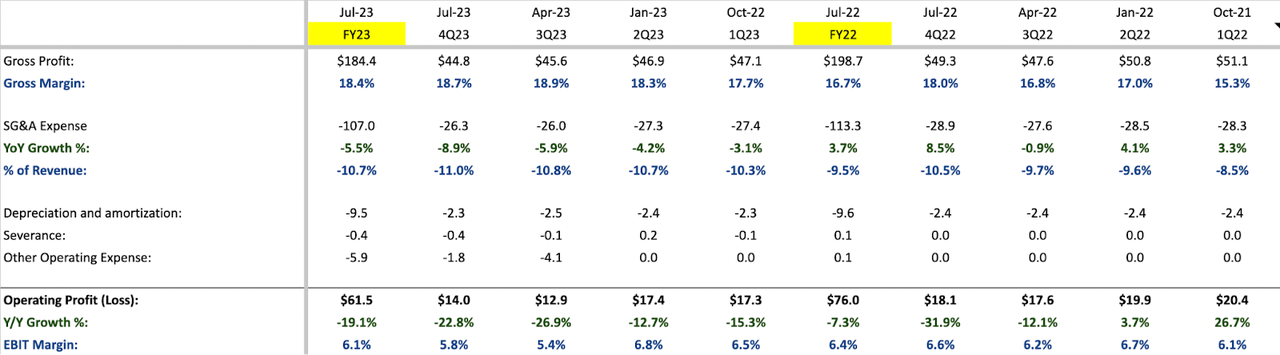
Traditional Communication Financials as of 4Q23
On a quarterly and annual basis, gross margin improved as IDT focused on maximizing unit economics rather than revenue growth. FY23 gross margin rose from 16.7% to 18.4%, growing by 1.7%. Operating margin declined from 6.4% in FY22 to 6.1% in FY23 primarily due to an increase in SG&A expenses and stock-based compensation expenses.
4.2 FY24 Valuation
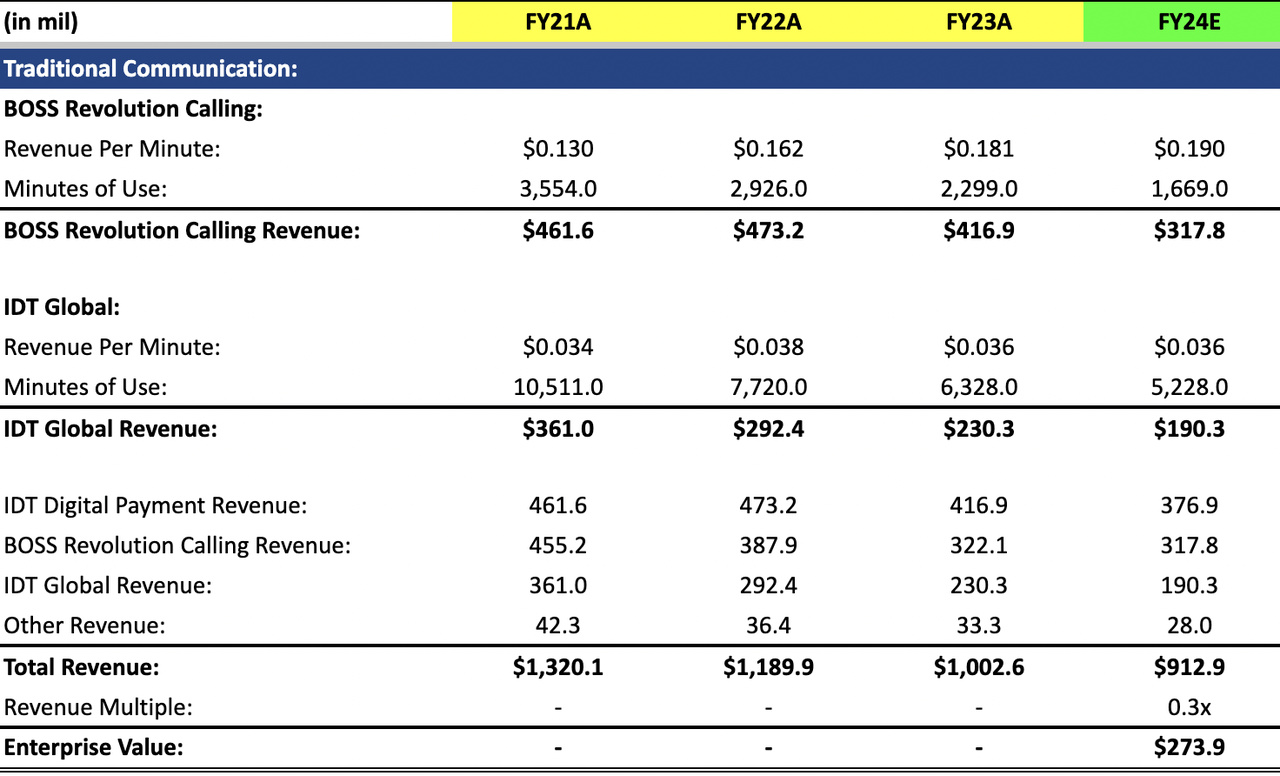
Author’s FY24 Valuation of Traditional Communication
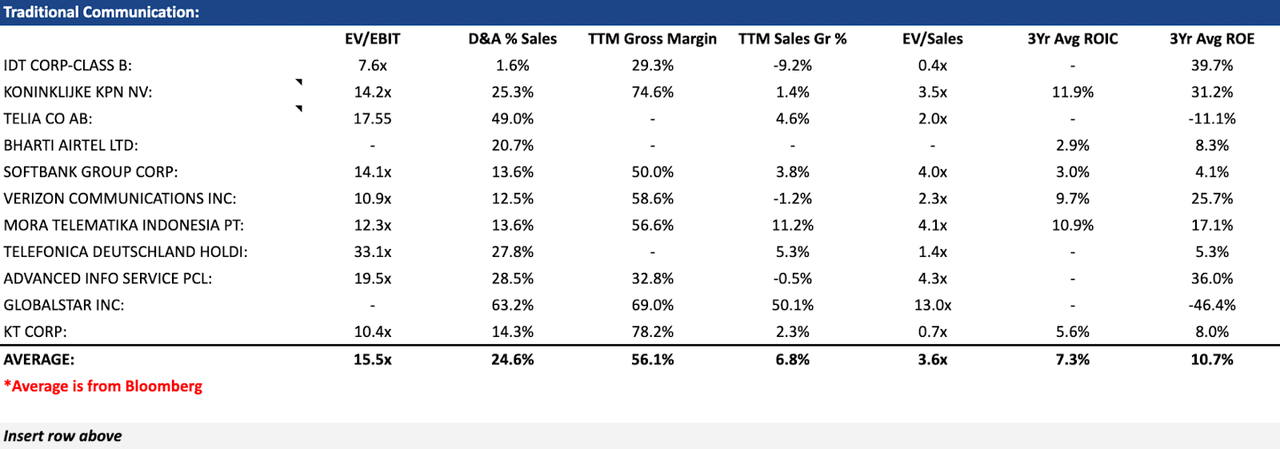
Traditional Communication Relative Valuation
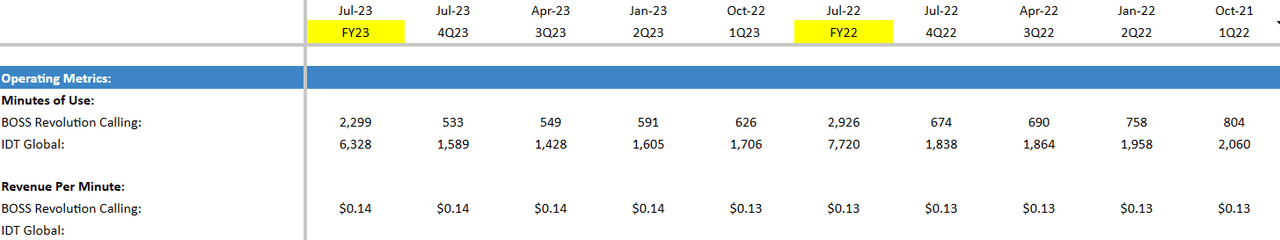
Anticipated for BOSS Revolution calling and IDT Global is an improvement or stability in revenue per minute, driven by the management’s focus on unit economics. Meanwhile, the projection includes a continued decline in minutes of use. I project a total revenue of $912.9 million in FY24 – an 8.9% YoY decline from FY23. Since it possesses a lower margin, and growth rates are declining faster than its peers, applying a revenue multiple of 0.3x results in an enterprise value of $273.9 million.
Summary and Final Thoughts
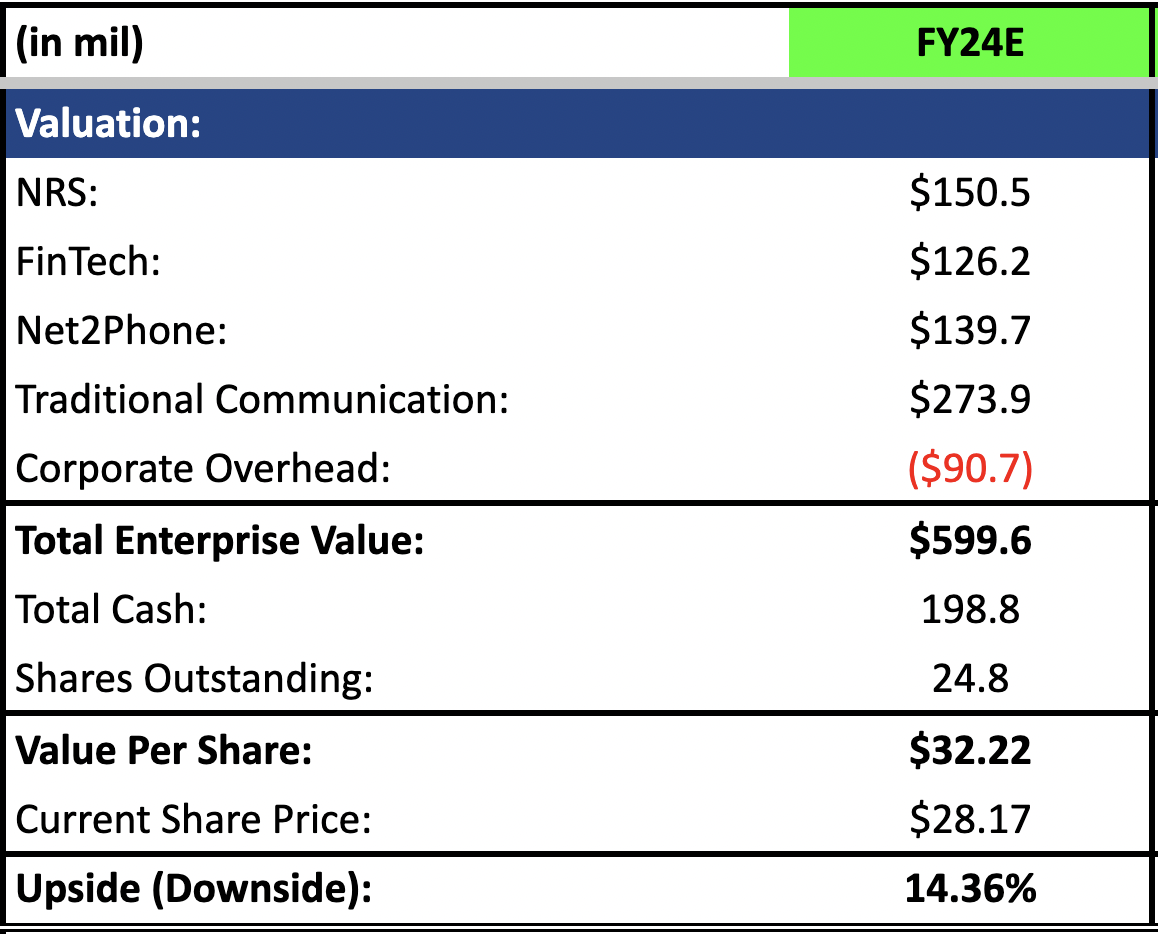
Author’s FY24 Valuation of IDT Corporation
Adding the corporate overhead value of -$90.7 million, based on IDT’s current EV/EBIT of 7.6x, will yield a total enterprise value of $599.6 million. With a current cash and cash equivalent holdings of $198.8 million and an estimated shares outstanding of 24.8 million, this produces a value per share of $32.22 – representing a 14.36% upside from the current share price of $28.17, suggesting continual mispricing of the company.
Furthermore, with the recent news of IDT prevailing in the lawsuit of Straight Path Communication, I believe the downside risks are further mitigated. However, for shareholders, it is important to note that the bulk of returns stem from the spin-off of IDT’s businesses, which will be put off until the macro environment improves and makes it ideal for a spin-off. This investment may not be suitable for inpatient investors, especially given the current economic conditions and the uncertainties surrounding central banks’ decisions on interest rate hikes.
In the meantime, if you have any questions or feedback, do leave a comment down below.
Read the full article here