


In this analysis of the Health Care Providers & Services industry ETF (NYSEARCA:IHF), we delve into an examination of both the industry as a whole and its distinct subindustries: Health Care Distributors, Health Care Services, Health Care Facilities, and Managed Health Care. Our goal is to identify the most promising subindustry within the Health Care Providers & Services sector.
Commencing with an in-depth analysis of the Health Care Providers & Services industry, we scrutinize factors such as market size and the drivers fueling its growth. Furthermore, we conduct a comprehensive assessment of each individual subindustry, meticulously pinpointing the subindustry poised for the most robust expansion.
In addition to our comprehensive analysis, we employ our proprietary Quantitative Factor Score, which ranks the subindustries based on their industry-benchmarked returns. This ranking aids us in ascertaining the most advantageous subindustries to consider for exposure. Ultimately, our evaluation culminates in the identification of the premier companies within each subindustry, accompanied by an exploration of their competitive strengths that set them apart.
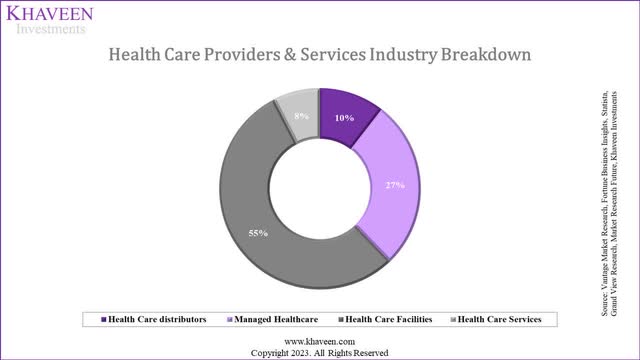
Health Care Providers & Services Industry Breakdown
According to Verywell Health, “a healthcare provider is a person or entity that provides medical care or treatment”. Based on the MSCI GICS classification, the Health Care Providers & Services industry consists of Health Care Distributors, Health Care Facilities, Health Care Service Providers and Managed Care subindustries. In this section, we explain each of the subindustries.
Health Care Distributors
The first subindustry in the Health Care Providers & Services industry is Health Care Distributors which consists of distributors of healthcare products. These companies are distinct from other subindustries as they do not provide healthcare to patients but rather act as the intermediaries between the healthcare providers and manufacturers such as in the Pharmaceuticals and Health Care Equipment & Supplies industries by facilitating the flow of pharmaceutical, healthcare equipment medical devices products from the manufacturers to the healthcare providers such as hospitals, clinics and treatment centers. For example, McKesson (MCK) is a “healthcare company for wholesale medical supplies & equipment, pharmaceutical distribution”. Additionally, AmerisourceBergen (ABC) has over 100 years of experience in “pharmaceutical sourcing and wholesale distribution”. However, these companies are distributors whose main business involves supplying goods to healthcare providers and are different compared to the other subindustries focused more on delivering services.
Health Care Services
Furthermore, the next subindustry within Health Care Providers & Services is Health Care Serviceswhich includes companies that include clinical labs as well as other companies providing pharmacy benefit management services and urology medical services such as dialysis centers according to the GICS. For example, companies such as Fresenius and DaVita operate outpatient kidney dialysis centers. Furthermore, it also includes companies that provide…
business support services to health care providers, such as clerical support services, collection agency services, staffing services and outsourced sales & marketing services.
These groups of companies commonly provide healthcare services that support healthcare providers and offer specialized healthcare services such as providing lab testing services including blood pressure testing and urinalysis. Companies such as CVS Health provide PBM services by working with insurance companies and drug manufacturers to help manage prescription drug plans.
Health Care Facilities
The Health Care Facilities subindustry includes companies that operate healthcare facilities such as hospitals, aged care facilities and rehabilitation centers. This subindustry includes companies such as HCA which operate 184 hospitals. The main difference that we identified with the Health Care Services is these companies generally provide inpatient care for patients or hospitalization via their network of hospitals as well as daily well-being care by nursing homes and rehab centers.
Managed Health Care
Finally, the final subindustry in the Health Care Providers & Services industry is Managed Health Care. This subindustry includes companies that provide managed care. According to Stride, these companies provide various health insurance plans such as “HMO, PPO, EPO, and POS” and exclude other types of insurance companies. Health Maintenance Organization companies are managed care companies that provide healthcare coverage to their insured members through their network of primary care providers (PCPs). Whereas Preferred Provider Organization has a preferred network of care providers whereby members “do not need referrals to see a specialist” and only a lower portion of the bill compared to providers outside the network. On the other hand, Exclusive Provider Network is a hybrid between HMO and PPO. Finally, A Point of Service is also a hybrid between HMO and PPO but members require a referral to visit a specialist.
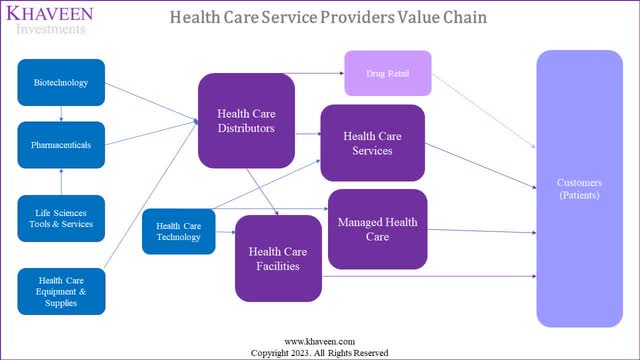
Also, we illustrated the value chain of Health Care Providers and Services below.
Khaveen Investments
Overall, we illustrated the Health Care Providers & Services industry value chain above. As seen, we believe the Health Care Providers & Services industry is a key industry within the Health Care sector as its companies are intermediaries between the manufacturers such as Pharmaceuticals, Health Care Equipment & Supplies and Biotechnology with customers including patents and retailers. Specifically, the Health Care Services, Facilities and Managed Health Care provide services including medical services, treatments, testing and health insurance to patients. The Health Care Distributors are distinct from the rest of the subindustry as they mainly focus on supplying goods rather than services.
Market Breakdown and Growth
|
Health Care Providers & Services Subindustry |
Market Size ($ bln) |
Market Forecast CAGR |
|
Health Care Distributors |
802.72 |
5.90% |
|
Managed Health Care |
2,088.50 |
5.5% |
|
Health Care Facilities |
4,176.42 |
3.6% |
|
Health Care Services |
580.77 |
6.8% |
|
Total |
7,648.41 |
4.6% |
Source: Vantage Market Research, Fortune Business Insights, Statista, Grand View Research, Market Research Future, Khaveen Investments
Vantage Market Research, Fortune Business Insights, Statista, Grand View Research, Market Research Future, Khaveen Investments
According to Vantage Market Research, the global healthcare distribution market was valued at $802.72 bln in 2022 with a forecasted CAGR of 5.90%. Moreover, according to Fortune Business Insights, the health insurance market is also expected to grow from $2.09 tln in 2021 at a CAGR of 5.5%. Furthermore, we based the Health Care Facilities market size on the hospital market which is valued at $4.08 tln in 2023 with a projected CAGR of 3.57% according to Statista.
For Health Care Services, we based its market size on the dialysis centers market size of $26.9 bln in 2022 and a CAGR of 5.29% based on Grand View Research. In addition, the global clinical laboratory tests market size was $103.67 bln in 2022 with a forecast CAGR of 9.4%. Furthermore, the pharmacy benefit management services market is valued at $475.23 bln in 2023 and has a CAGR of 5.56% according to Market Research Future.
Based on the table, the larger the market size, the lower the forecasted market growth rate. The Health Care Facilities have the largest market size but have the lowest growth rate among the sub-industries at 3.6%. In contrast, Health Care Services have the highest CAGR and the smallest market size among the subindustries which indicates higher demand for healthcare services such as clinical laboratory testing, dialysis and pharmacy benefit management services.
Growth Drivers
In this section, we examine the growth drivers of the Health Care Providers & Service industry including rising healthcare spending, aging population, rising incomes, rising insured population and life expectancy.
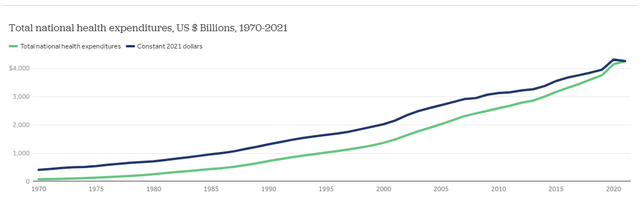
Rising Healthcare Spending
KFF
According to KFF, total healthcare spending in the US grew at a CAGR of 4.76% from $2.7 tln in 2011 to $4.3 tln in 2021. Based on the source…
Total health expenditures represent the amount spent on health care and related activities (such as administration of insurance, health research, and public health), including expenditures from both public and private funds.
Thus, we believe the rising healthcare spending on healthcare benefits Health Care Providers & Services companies’ top-line growth.
Aging Population
According to the Administration on Aging, there were 55.7 mln people aged 65 years and above in the US in 2020. In 2021, the number increased to 55.8 mln which is a CAGR of 3.3% from 40.4 mln in 2011. Furthermore, the Administration on Aging projects the number of residents 65 and older by 2040 to increase to 80.8 mln, a CAGR of 3.5%. According to the CDC, “aging increases the risk of chronic diseases such as dementias, heart disease, type 2 diabetes, arthritis, and cancer.” Also, according to the National Institute of Aging…
The risk of Alzheimer’s disease and other dementias increases with age, and these conditions are most common in adults 65 and older”.
Thus, we believe that the aging population could be a growth driver for the industry as demand for healthcare increases as people age.
Real Income Growth
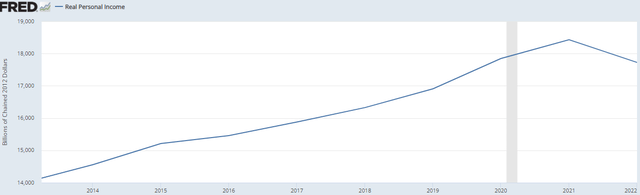
U.S. Census Bureau, FRED
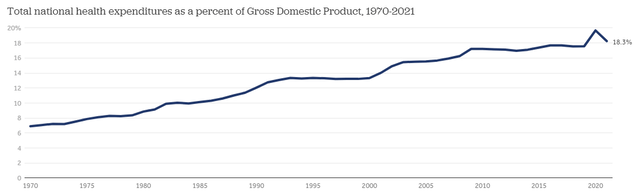
Based on the chart above by FRED, the US average real income has grown continuously except in 2022 with an average growth rate of 2.3% in the past 10 years. Additionally, healthcare spending as a % of GDP has been increasing since the 1970s as seen in the chart below. In 1970, the healthcare spending % of GDP increased from 6.9% to 18.3% in 2021, a CAGR of 1.9%. We believe this highlights the growing spending on healthcare-related services which could benefit the Health Care Providers & Services industry.
KFF
Healthcare Insurance
US Census Bureau, Statista, Khaveen Investments
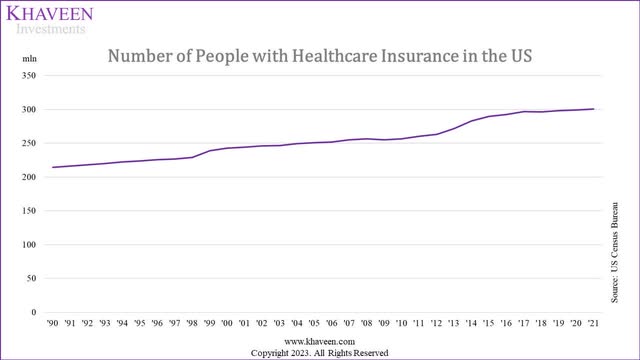
Based on Statista, as of 2021, over 300 mln people in the US had some kind of health insurance, a CAGR of 1.6% from around 257 mln insured people in 2010. We believe the rising number of insured populations is beneficial for Health Care Providers & Services by providing greater access to healthcare services.
As of 2020, about 9.4 percent of people were uninsured in the U.S., compared to 16 percent in 2010. The Affordable Care Act (‘ACA’) significantly reduced the number of uninsured people in the United States, from 44.8 million uninsured people in 2013 to 28.6 million people in 2015. – Statista
Increasing Life Expectancy
MacroTrends
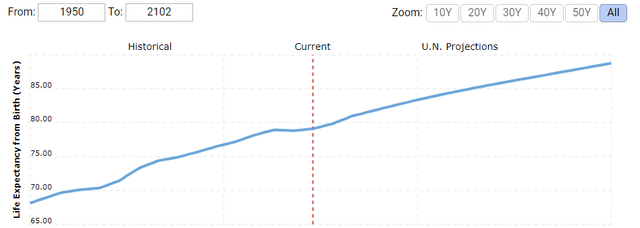
Based on MacroTrends, the average life expectancy in the US has been increasing from 78.7 years in 2011 to 79.11 years in 2022, a CAGR of 0.05%. Furthermore, the UN projected the US life expectancy to continue increasing to 80.73 years by 2032, which represents a CAGR of 0.2%. We believe this could benefit the Health Care Providers & Services industry with the increasing life expectancy as the average person would live longer and require more healthcare services over their lifetime compared to in the past with lower life expectancy.
Overview
|
Driver |
Past CAGR |
Future CAGR |
|
Rising Healthcare Spending |
4.76% |
4.76% |
|
Real Income Growth |
2.3% |
2.3% |
|
Number of Insured |
1.6% |
1.6% |
|
Aging population |
3.3% |
3.5% |
|
Increasing Life Expectancy |
0.052% |
0.2% |
Source: Khaveen Investments
Overall, we analyzed the Health Care Providers & Services industry which consists of Health Care Distributors, Health Care Facilities, Health Care Service Providers and Managed Health Care subindustries. We determine the growth outlook at a 4.6% CAGR for the $4.6 tln industry and drivers which include rising healthcare spending, aging population, rising incomes, rising insured population and life expectancy.
Managed Health Care as the Best Subindustry
Furthermore, we derived our Quantitative Score and compiled the returns of each subindustry in Health Care Providers & Services to determine which subindustry in healthcare providers is the best to have exposure to.
Quant Score
|
Subindustry |
Khaveen Investments Quantitative Factor Score |
Returns |
|
Health Care Distributors |
4 |
8.4% |
|
Managed Health Care |
7 |
20.8% |
|
Health Care Facilities |
4 |
15.9% |
|
Health Care Services |
4 |
8.8% |
*The Khaveen Investments Quantitative Factor Score is formulated by evaluating the historical return performances of each Subindustry. A heightened score signifies a noteworthy outperformance of returns when compared to their corresponding Industry, Industry Group, and Sector.
Source: Company Data, Seeking Alpha, Khaveen Investments
Based on the table above, Managed Health Care has the highest quantitative score of 7 while the rest of the subindustries are tied at a score of 4. In addition, the Managed Health Care subindustry has the highest average returns compared to the rest of the subindustries in Health Care Providers & Services. Health Care Facilities have the second highest returns, above 10%, while Health Care distributors have the lowest.
Overall, we believe Managed Health Care is the best subindustry within Health Care Providers & Services due to it having the highest quantitative score and the highest average returns.
Fundamentals
Furthermore, within the Health Care Providers & Service industry, we examined 13 Health Care Facilities companies, 6 Managed Care, 15 Health Care Services companies and 2 Health Care Distributors companies and compiled the average revenue CAGR (10 years) as well as profitability metrics such as gross, net and FCF margins based on a 5-year average.
|
Summary Table |
Revenue CAGR (10 years) |
Gross Profit Margins (5-yr Average) |
Net Margins (5-yr Average) |
FCF Margins (5-yr Average) |
|
Health Care Services |
10.02% |
30.78% |
3.22% |
7.94% |
|
Health Care Facilities |
7.51% |
8.42% |
0.95% |
1.81% |
|
Health Care Distributors |
9.04% |
31.44% |
2.55% |
4.03% |
|
Managed Health Care |
19.10% |
26.32% |
4.17% |
5.69% |
|
Average |
11.26% |
24.24% |
2.72% |
4.87% |
Source: Company Data, Seeking Alpha, Khaveen Investments
Based on the table, Managed Health Care companies have the highest historical revenue CAGR of 19.1% followed by Health Care Services and Health Care Facilities and are the only subindustry with above-average growth. In terms of profitability, the Health Care Distributors subindustry has the highest gross margins with an average of 31% but has the second lowest net and FCF margins. Health Care Facilities have barely positive net margins, while Health Care Services have the highest FCF margins among the subindustries. Overall, we believe that the best subindustry is Managed Health Care as it has by far the highest average revenue CAGR as well as the highest net margins despite slightly lower gross and FCF margins compared to Health Care Facilities which we believe is the second-best subindustry best on our comparison.
Breakdown of Health Care Providers ETF
Moreover, we compiled and derived the % breakdown of the Health Care Providers & Service industry ETF in the chart below to analyze its exposure to the subindustries in the Healthcare Providers & Service industry.
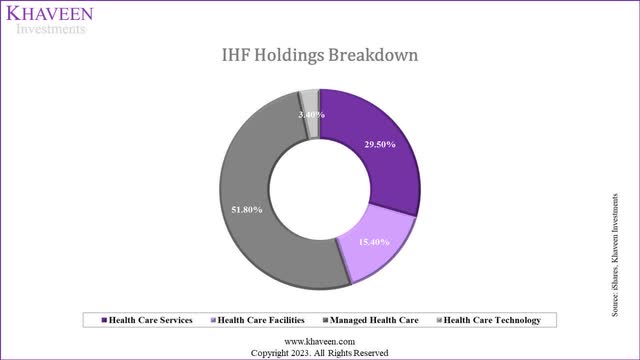
iShares, Khaveen Investments
As seen in the chart, the Managed Health Care subindustry has the highest breakdown of the total ETF at 52% of the total weightage. This is followed by Health Care Services at 29.5% of the total while Health Care Facilities are third at 15%. Thus, we believe the ETF provides the best exposure to the Managed Health Care Services subindustry as it is 52% of the total. Furthermore, we derived a weighted average growth rate based on the market CAGR from the previous point at 5.4% which is higher compared to our derived total Health Care Providers & Service industry forecast CAGR of 5.6%
All in all, we believe the best subindustry in the Health Care Providers & Services is Managed Health Care due to it having the highest quantitative score and the highest average returns. Also, it has the highest average revenue CAGR as well as the highest net margins. In terms of the IHF breakdown, we identified that Managed Health Care is the largest at 52% of total holdings, which reflects positively as we believe it to be the best subindustry.
Top Health Care Providers & Services Companies
Finally, in this section, we looked at the top 2 companies within Managed Health Care and the top companies for the other subindustries in the Health Care Providers & Service industry which are UnitedHealth Group (UNH) (Managed Health Care), Elevance Health (ELV) (Managed Health Care), CVS (CVS) (Health Care Services), HCA (HCA) (Health Care Facilities), McKesson Corporation (Health Care Distributors) and identified their strengths.
UnitedHealth Group
UnitedHealth Group is a large healthcare company offering healthcare services and insurance. The company is classified in the Managed Health Care subindustry and is the largest holding in the ETF at a 22% weightage. We believe some of its advantages are:
- Extensive Network: The company has an extensive network of healthcare providers as it has “70,000 employed or aligned physicians serving over 20 million people”, which allows customers access to a wide range of healthcare services.
- Leverages Technology and Innovation: With Optum Insight, the company offers data analytics, research, and technology solutions to reduce administrative costs and improve clinical performance.
- More Affordable Healthcare: Optum Rx provides pharmacy care services that make medications more affordable and helps benefit sponsors reduce costs, “filling more than 1.5 billion adjusted retail, mail and specialty drug prescriptions annually”.
Elevance Health
Elevance Health is a health benefits company, and its services include medical, pharmaceutical, dental, behavioural health, long-term care, and disability plans. This company is classified under the Managed Health Care subindustry and is the second largest holding of the ETF at 13%. We believe some of its advantages are:
- Leverages Technology and Innovation: The company has its Carelon digital health platform which features “digital tools and data-driven insights enabled” and brings together various healthcare services brands and associates to improve outcomes and lower costs “through personalized, proactive, and precise interactions”.
- More Affordable Healthcare: The company also has Carelon RX, a home delivery pharmacy that provides cost-effective healthcare products. The company claims that it has 92% customer satisfaction.
CVS
CVS Health Corporation offers pharmacy services, operates health clinics, provides prescription management solutions, offers health insurance plans, specializes in complex medications, leverages digital health technologies, and provides health and wellness products. This company is classified under the Health Care Services subindustry and is the third largest holding of the ETF with a weightage of 8.32%. We believe some of its advantages are:
- Integrated Healthcare Model: The company combines retail pharmacies, pharmacy benefit management (PBM) services, and healthcare clinics. The company stated that its “unique integrated model increases access to quality care, delivers better health outcomes, and lowers overall health care costs”.
- Ecosystem For Personalized Care: The company focuses on personalized care such asCVS Pharmacy providing face-to-face counseling and convenient access to prescriptions at 9,700 locations. Moreover, over 1,100 MinuteClinic locations offer a range of health services by medical professionals.
HCA
Based in the US, HCA Healthcare operates hospitals that offer medical and surgical services as well as outpatient facilities. This company is categorized under the Health Care Facilities Subindustry and is the fourth largest holding of the ETF with a weightage of 4.93%. We believe some of its advantages are:
- Extensive Network: The company has a vast network of hospitals and healthcare facilities across multiple states as seen in the chart below. This allows them to serve diverse communities and provide comprehensive healthcare services.
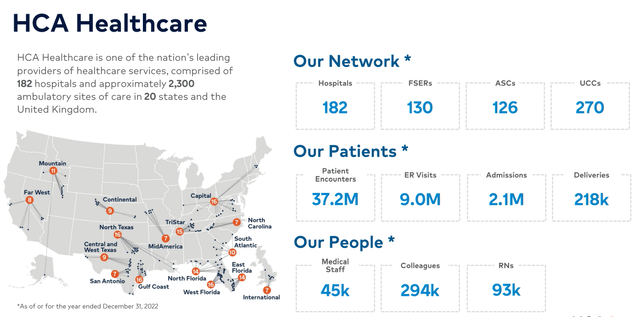
HCA Healthcare
- Strong Physician Relationships: The company has strong relationships with over 45,000 active medical professionals and 54,000 physicians, leading to improved collaboration and care coordination.
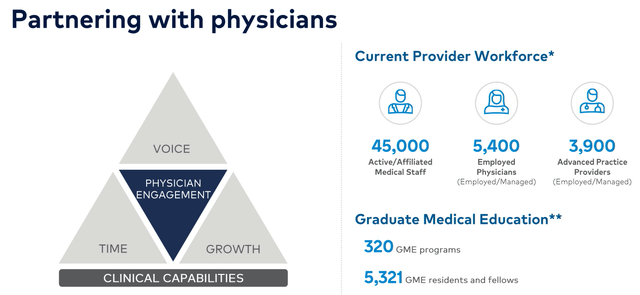
HCA Healthcare
McKesson Corporation
McKesson Corporation provides pharmaceutical distribution, supply chain management, and pharmacy management systems. The company is categorized under the Health Care Distributors subindustry.
- Extensive Network: The company has a long-standing history in pharmaceutical distribution spanning almost two centuries. Based on its website, the company supplies pharmaceutical products to over 40,000 customers including pharmacies and healthcare providers.
- Leverages Technology and Innovation: The company leverages digital solutions such as its Prescription Technology Solutions (RxTS) which help healthcare providers streamline operations and enhance patient care.
Overall, we identified and examined the top companies of each subindustry within the Health Care Providers & Services industry which as UnitedHealth Group, Elevance Health, CVS Health, HCA Healthcare, and McKesson Corporation. We believe these companies have strengths, including an extensive network, leveraging technology and innovation, enabling more affordable healthcare, integrated models and strong relationships with medical professionals. We believe these strengths reflect positively on the ETF as these companies, except for McKesson Corporation, represent a combined weightage of 48.5% of the total.
Risk: Concentration Risk of Top Holdings
As mentioned in the previous point, the top companies UnitedHealth Group, Elevance Health, CVS Health and HCA Healthcare represent a high concentration of the total IHF weightage at 48.5%. While we believe these top companies possess several strengths, the industry is highly dependent on these companies’ performance and could be affected if these companies’ growth were to slow down. However, based on analyst consensus’ these companies have an average revenue growth rate of 9.1% for 2023, thus highlighting a solid outlook for the year.
Verdict
In summary, we anticipate robust growth of 4.6% CAGR in the Health Care Providers & Services industry, encompassing subindustries like Health Care Distributors, Healthcare Facilities, Healthcare Service Providers, and Managed Health Care. This projection is driven by factors such as increased healthcare expenditure, an aging population, rising incomes, expanded insurance coverage, and heightened life expectancy. Within this landscape, we believe Managed Health Care stands out as the best subindustry with the strongest returns, highest average revenue growth and net margins among the subindustries.
Additionally, Managed Health Care represented the largest subindustry based on the weightage of the ETF at 52% of the total. Furthermore, we examined the top companies in the industry including UnitedHealth Group, Elevance Health, CVS Health, HCA Healthcare, and McKesson Corporation. We believe these companies possess noteworthy strengths, such as expansive networks, utilization of technology and innovation, enabling more affordable healthcare, integrated models, and robust relationships with medical professionals. Moreover, these top companies represent 48.5% of the ETF holdings. Based on our quantitative assessment, we have assigned IHF a Buy rating.
Read the full article here