


The big news out of India last week was its new government’s first budget, which saw some rather market-unfriendly tax surprises, including a hike in the short-term (up 5 ppt to 20%) and long-term capital gains tax rate (up 2.5 ppt to 12.5%), as well as for securities transactions (near double the previous rate for futures and options). Yet there were positive macro offsets from the budget, most notably higher capex growth and a lower projected fiscal deficit path, both of which entail policy continuity from Prime Minister Modi’s last two terms (‘Modi 1.0’ and ‘Modi 2.0’).
Economic Times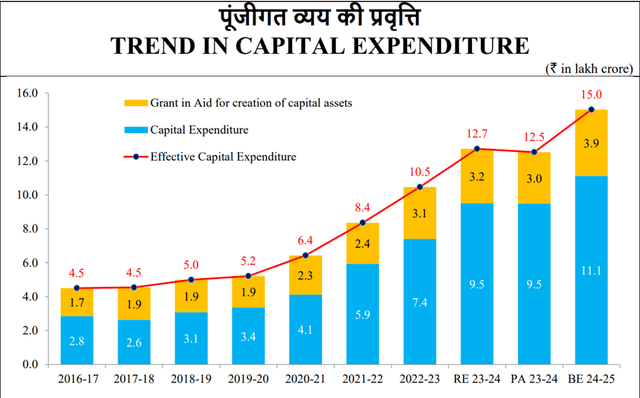
Few sectors have benefited from ‘Modi 1.0’ and ‘Modi 2.0’ quite as much as the Indian consumer. Hence, confirmation of more of the same in ‘Modi 3.0’ bodes well for the sector – directly investable in the US via the Columbia India Consumer ETF (NYSEARCA:INCO). Also benefiting the near-term sector fundamentals, particularly on the discretionary side, are a more favorable monsoon this year, as well as a post-Budget push for employment growth and custom duty cuts. Momentum is weaker on the staples side for now, though the massive returns on capital many of INCO’s blue chips are able to sustain mean they aren’t as pricey as they might first appear. Though there are drawbacks, as I discuss later in the article, there’s more than enough to keep INCO flying high from here.
INCO Overview – An Increasingly Liquid Indian Consumer Pure-Play
Most US-listed India ETFs are broad-based tracker funds, so within this universe, Columbia Threadneedle’s sector-focused India Consumer ETF stands out. Relative to prior quarters, INCO’s fundamentals haven’t changed too much; the benchmark remains the market cap-weighted Indxx India Consumer Index, a thirty-stock basket of Indian blue-chip consumer staples and discretionary names subject to concentration limits.
Columbia Threadneedle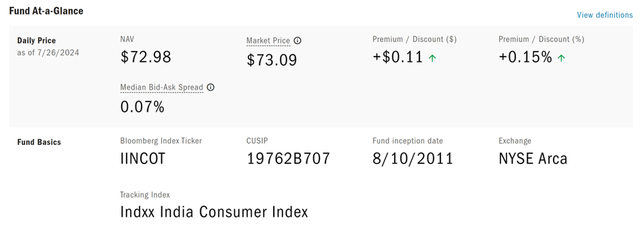
On the cost side, the fund has kept a reasonable ~0.8% expense ratio (0.77% gross; 0.75% net of fee waivers) – above conventional India trackers like iShares’ MSCI India ETF (INDA) but below factor ETFs like WisdomTree’s India Earnings Fund (EPI). More positive, though, is that INCO has seen its median bid-ask spread narrow to ~7bps (vs. ~2bps for best-in-class INDA), no doubt helped by the significant inflows into India funds post-election. Thus, when factoring in total cost (i.e., both execution and fees), INCO now screens even more favorably than before.
INCO Portfolio – Discretionary Overweight Trimmed but Intact
By sub-sector, INCO’s allocation isn’t as skewed toward consumer discretionary as before, though at 58.9% (vs. 60.5% previously), there remains a clear bias. By comparison, the consumer staples sub-sector stands at 41.2% – up from 39.5% previously, but well below discretionary due to the relative earnings underperformance of the staples group. While there is a rebalancing process to keep the staples/discretionary balance in check, this only happens on an annual basis; thus, don’t expect any meaningful shifts here anytime soon.
Columbia Threadneedle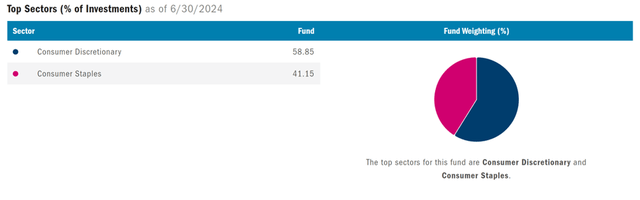
At the industry level, the discretionary sub-sector continues to be led by Automobiles and Automobile Components (combined 40.7%), followed by Hotels, Restaurants & Leisure (8.4%); both industries continue to outperform on earnings and have thereby rallied strongly this year. On the other hand, it’s been more mixed on the staples side, with the underperformance of key allocation, Food Products (down to 14.3%), balanced out by Personal Care Products (up to 12.2%).
Columbia Threadneedle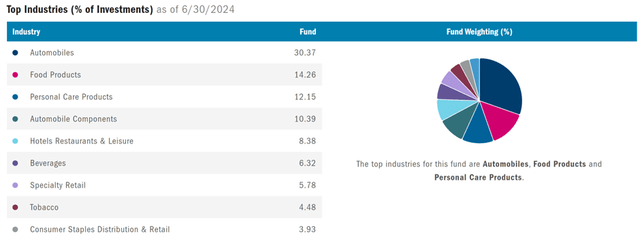
In line with recent quarters, INCO’s portfolio also skews heavily toward automotive franchises like Mahindra & Mahindra (OTC:MAHMF), though the fund’s latest rebalancing has led to lower % single-stock allocations. Still, outperformance in recent months means four stocks (Mahindra & Mahindra, food delivery platform Zomato, retailer Trent, and conglomerate ITC) have crossed the 4.9% weighting cap; with rebalancing only taking place once a year, INCO’s concentration will be worth keeping an eye on.
Columbia Threadneedle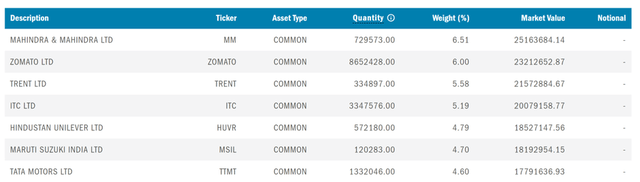
INCO Performance – The Power of Compounding Shines Through
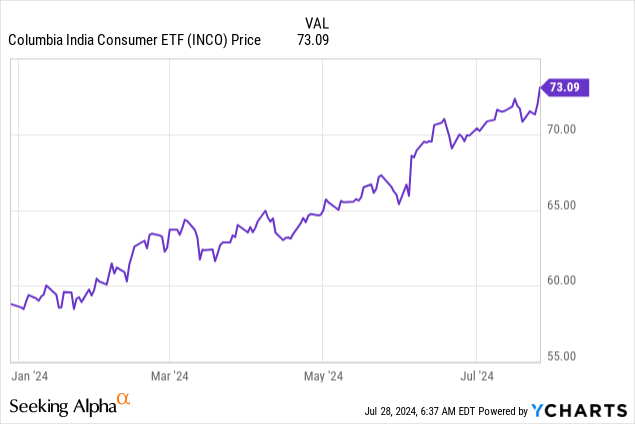
It’s been full steam ahead for INCO this year, with year-to-date gains now up to +19.0% NAV. Note that this comes off a very strong 2023, which saw the fund deliver +34.1% NAV returns. Zooming out, this moves INCO’s rate of compounding up to an impressive +12.0% pace since inception in 2011, though a large chunk of that came in Prime Minister Modi’s last term (+15.8% five-year NAV return). Also worth noting is that INCO, unlike most other India tracker funds, actively distributes its gains; as a result, investors get an income component in the form of a very solid low-single-digits % yield.
Columbia Threadneedle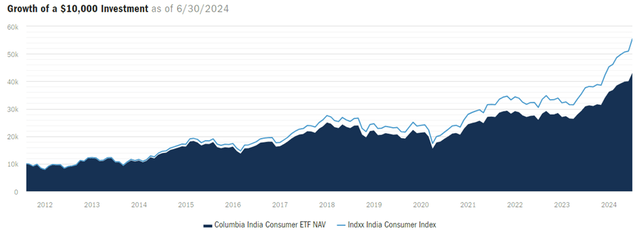
That said, there are some important caveats. The first is that INCO doesn’t track its benchmark Indxx India Consumer Index very efficiently at all. Note that in a bull market like last year, the fund gave up 6-7 ppt, while year-to-date, the tracking error stands at over 3 ppt.
The bad news from this year’s Budget is that capital will be taxed at an even higher rate going forward; as foreign capital invested via INCO won’t benefit from tax exemptions, expect the tracking error to be an even bigger issue from here. Besides taxes, there are a range of other costs that come with investing in India, including transaction costs, currency movements, and so on; thus, it’ll be more important than ever for investors to keep an eye on the full extent of costs (visible and invisible) going forward.
Columbia Threadneedle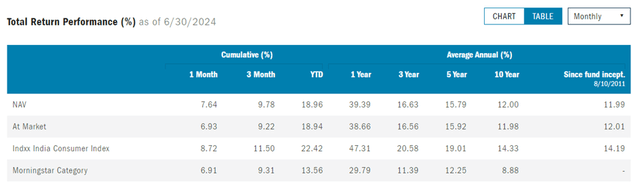
The other catch is the valuation – INCO’s 30-stock portfolio is currently priced as richly as it’s ever been at ~44x. It’s worth noting, though, that the headline multiple is skewed by the increased weight of Zomato (>400x P/E) and new portfolio addition, Patanjali Foods (>60x P/E), both of which also offer very strong one-year forward earnings growth at +233% and +93%, respectively.
More broadly, the rest of INCO’s blue-chip portfolio justifies their multiples with a combination of earnings growth and very high returns on capital. Per consensus numbers (see top 15 holdings in table below), INCO’s current constituents average returns on equity of nearly 30% and earnings growth of ~26% over the next year. These metrics aren’t one-offs, as India remains an extremely challenging place to operate at scale (hence the high ROEs); this leaves incumbents especially well-placed to benefit from massive secular tailwinds like the massive ‘demographic dividend’ India will come into over the coming years.
|
Description |
2025e ROE (%) |
1-year EPS Growth |
|
MAHINDRA & MAHINDRA LTD |
20.6% |
11.5% |
|
ZOMATO LTD |
5.4% |
232.5% |
|
TRENT LTD |
33.5% |
6.9% |
|
ITC LTD |
29.4% |
7.0% |
|
HINDUSTAN UNILEVER LTD |
21.3% |
8.4% |
|
MARUTI SUZUKI INDIA LTD |
16.6% |
10.2% |
|
TATA MOTORS LTD |
25.2% |
-19.6% |
|
BAJAJ AUTO LTD |
32.4% |
19.4% |
|
AVENUE SUPERMARTS LTD |
16.2% |
29.5% |
|
NESTLE INDIA LTD |
92.4% |
-13.4% |
|
TATA CONSUMER PRODUCTS LTD |
9.20% |
35.6% |
|
VARUN BEVERAGES LTD |
31.2% |
26.9% |
|
TITAN CO LTD |
25.4% |
18.4% |
|
HERO MOTOCORP LTD |
25.1% |
20.3% |
|
BRITANNIA INDUSTRIES LTD |
55.4% |
12.4% |
|
Average (30 Stocks) |
29.1% |
26.1% |
Source: Columbia Threadneedle, Consensus Estimates
India’s Kings of (Return on) Capital
No sector has performed quite as well as the Indian consumer through ‘Modi 1.0’ and ‘Modi 2.0’, so early indications of policy continuity make INCO a great bet as we enter ‘Modi 3.0’. On the macro side, things should only get better from here, as rural demand recovers and a post-Budget push for more employment and custom duty cuts add impetus to overall consumption. Add to that the massive (and sustained) returns on capital generated by INCO’s blue-chips and it becomes clear why the fund still has a long growth runway from here. Net-net, INCO remains a great long-term bet.
Read the full article here