

Investment Summary
Avid readers of this channel will know that we have been scouring the basic materials sector for 1) well-priced compounders, with 2) mouth-watering economics, and 3) throwing off piles of free cash flow. So far, there have been several names that fit this mould.
It is not all rainbows and butterflies, however. Finding companies that fit this strict economic criteria is tremendously difficult and compounded by the fact that, oftentimes, all of a business’s “good news” is fully embedded into current market expectations.
In the search for selective opportunities in the material sector, we turn to the specialty chemicals industry. Here, International Flavors & Fragrances Inc. (NYSE:IFF) has become a potential candidate for the equity bucket.
Figure 1.
Tradingview via Seeking Alpha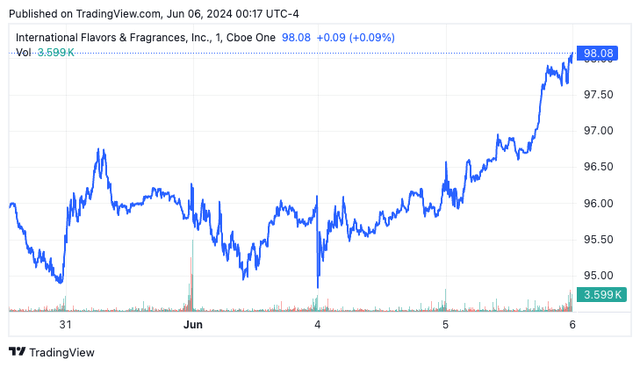
The question is whether IFF is an investment-grade company at the time of writing, and, if the price/value equation is skewed to the upside. Based on the facts pattern presented here, I do not believe the company is a compelling buy on a risk/reward basis, compared to similar opportunities with a similar level of risk. In that regard, I rate the company a hold for reasons stated here today.
Background fundamentals
IFF is in the business of manufacturing and distributing ingredients for consumer health and cosmetic products. Its sales footprint is global. It completed a merger with the Nutrition & Biosciences (“N&B”) segment of chemical giant DuPont in 2018. This was seconded by the acquisition of Frutarom Industries in the same year.
The company serves the food and beverage markets alongside the health, personal care, and wellness markets. It also has niche exposure to enzymes, cultures, taste texture, additives, and probiotics, making it a highly specialized operator in my view.
It operates across four segments, namely:
-
Nourish – this is the company’s natural ingredient line, which sells to the food & beverage, dairy, and bakery markets. You can think of things like flavours and ingredients as the key outcome for its customers here.
-
Health and biosciences – this segment produces a portfolio of enzymes, food cultures and probiotics for the food and beverage industry. These end up in products like fermented foods, yoghurts, cheeses, and so forth.
-
Scent-The scent business produces fragrances and fragrance compounds, which are then used as ingredients in “the world’s finest perfumes and best-known household and personal care products,” per the 2023 10-K. A part of this business was the cosmetic ingredient operation, which management divested from as of April 2024.
-
Pharmaceutical solutions – finally, the pharmaceutical solutions business is in the operation of seaweed-based pharmaceutical excipients. These are used to unlock the delivery of pharmaceutical compounds – for example, in the use of extended-release formulations.
Founded in 1909, the company has not created substantial value for its shareholders over the last 10 years or so, beyond its impressive dividend growth. I am not surprised to see the company of this age trading sideways. Moreover, companies in this maturity cycle can still have mouthwatering economics.
In 2014, the company produced around $3.1 billion in sales on $601 million in operating income. It had stretched this to $$3.9 billion in revenue by 2018, on roughly $607 million in operating earnings. After completing the N&B merger, the top line has expanded substantially. Operating earnings haven’t. For instance, in 2021, sales were $11.7 billion – almost 3x that in 2018 – but this was against operating earnings of $660 million, in-line. Last year, it printed $11.5 billion at the top line, on operating earnings of $612 million. Based on this record, I question if the restructuring has added economic value for the company’s investors.
Q1 2024 financials
1. Key insights
The company put up $3 billion in quarterly revenues in Q1 2024, down 400 basis points year over year. It pulled this to adj. EBITDA of $503 million, down 15%. This compressed operating margins by 300 basis points. Despite the pullback, management retained full-year guidance and is projecting $10.8 billion to $11.1 billion in revenues this year. It also suggests that product volumes will lift 300 basis points at the upper end of the range, coupled with a circle 1% lift in pricing. This result also bakes in a 3% to 4% forex headwind. Management is eyeing $2.1 billion in adjusted pre-tax earnings on this.
As to the divisional breakdown, the nourish segment clipped 3% sales growth to $1.5 billion on adj. operating income of $216 million (up 13%). Health and biosciences revenues grew 6% to $531 million, lifting pre-tax earnings by 21% to around $160 million. This was underscored by both volume and productivity gains.
Meanwhile, the scent and pharmaceutical solutions were up 16% and down 11%, respectively. Management noted that inventory stocking in the pharmaceutical solutions business continues to be a headwind that compressed adjusted operating earnings by 22% year over year to $46 million. Finally, it left the period with total debt of $10.3 billion against cash on hand of $764 million.
2. Appraisal
My view of the first quarter results from IFF was mixed. Management’s language on the call was fairly muted, in my opinion, despite noting the “improved financial and operating performance” of the company. In the slides, the forward outlook says that “it is still early, and uncertainty remains” concerning 2024.
This could be management being correctly cautious, but I would still like to see some conviction regarding where it intends to allocate capital moving forward. Thankfully, it has been clear on recent uses of cash. It mentioned that it has reduced debt by ~$1 billion over the past 12 months, bringing the leverage ratio to 4.4x by the end of Q1. Meanwhile, capital expenditures ran at 4% of sales in the quarter at $118 million, and it returned $207 million of capital to shareholders through its dividend.
Based on this appraisal, it would appear 1) the investment runway for IFF is relatively small, 2) opportunities exist only to mine the acquisition pipeline, or 3) to reinvest into current operations for things like efficiencies and production advantages.
Business economics underlying hold thesis
One advantage IFF enjoys being in the fragrance and biopharmaceutical space is that these are highly differentiated domains. This means the company should typically be able to sell its offerings higher than industry averages and enjoy some form of consumer advantage (especially in the fragrance space).
We see this when comparing IFF to the specialty chemicals industry. The company has around 350 basis points higher gross margins (indicating the higher selling prices) but has higher than average operating margins too (Figure 2).
This would suggest it has lower operating costs as a percentage of revenues and, in my opinion, squares off with the economics of the business: (i) It is a diversified operation conducting business across distinct segments, (ii) acquisitions are one primary means to growth, meaning (iii) it can amalgamate operating costs of its various assets through “synergies”.
Given the highly intangible nature of the business’s invested capital, I am not surprised to see a competitive advantage in free cash flow margin either – 17.4% compared to the industry median of 6.8% – incremental capital requirements should be relatively low, with investments reserved for things like acquisitions and maintenance expenditures.
In that respect, it is quite surprising that this company produces such small post-tax earnings relative to the capital employed in the business. This is an industry where substantial capacity exists, and many operators incur the commodity-like economics I like to avoid. Presumably, IFF would benefit from this, given its different differentiated products in fragrances and so forth. At least, this is what I had assumed originally.
Figure 2.
Company filings, Author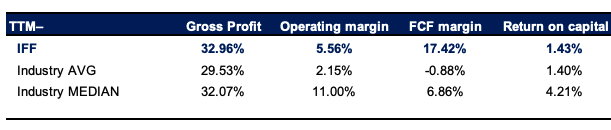
This is a classic case of why one simply cannot assume in capital markets and equity analysis. I wanted to understand why FF runs such an intensive, unprofitable enterprise (profitability is measured here, not in terms of net margins, earnings per share, or growth – it is measured in the context of net operating profit against invested capital, otherwise, return on invested capital).
Figure 4 illustrates the net operating profit after tax IFF has produced on capital invested in the business and free cash flow left over after considering all reinvestment needed to maintain its competitive position. It does this on a rolling 12-month basis.
As observed, the company has wound back total capital at risk in the business from $142 per share in September 2021 to $102 per in the last 12 months. Against this, the company has grown post tax earnings from $4.90 per share up to $5.12 per share in the trailing 12 months, a 5% ROIC. All dividends paid up; this tallies $9.80 per share, a trailing yield of 10.2% as I write.
The result has been less than 5% to 6% rolling returns on capital each period. Analysis of the drivers of this slack return is revealing. It enjoys reasonably high post-tax margins of 10%. This squares off with the economics I outlined earlier, in the consumer advantages it has with branding and specialty products with relatively short product cycles.
However, on the $26.1 billion of capital employed into this business, the ratio of sales to capital is just 0.43x, indicating that for every $1 invested into the business, only $0.43 in revenues return.
Said another way, the investment required to produce one dollar of revenues is tremendously high, indicating this is a capital intensive exercise.
Figure 3.
Company filings, Author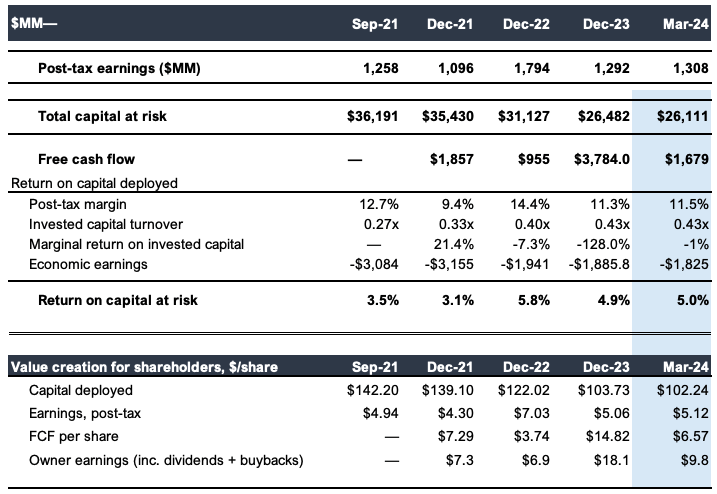
Objectively, the current trailing free cash flow is attractive. It is also one that the company is likely to maintain, in my opinion. Figure 5 shows the trailing free cash for yield IFF has conducted business on over the last three years, on a rolling 12-month basis. Investors have been able to purchase the company at multiple points along this horizon at a >6% trailing free cash for yield.
Here is where the value is in this name in my opinion. This cash flow supports a steady stream of dividends which have increased consecutively for 21 years, and been paid consecutively for 34 years (Figure 6).
This is certainly one for consideration for income-oriented investors. In my opinion, with the combination of 1) incremental capital requirements and 2) IFF’s sheer size, investors can expect hearty dividends in years to come. This is a balancing factor in the investment debate.
Figure 4.
Company filings, author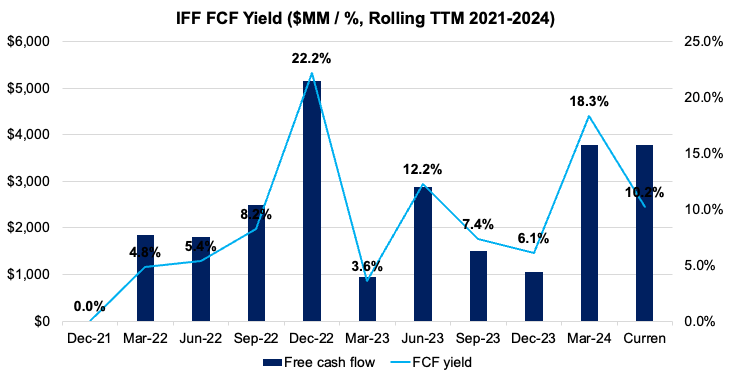
Figure 5.
Seeking Alpha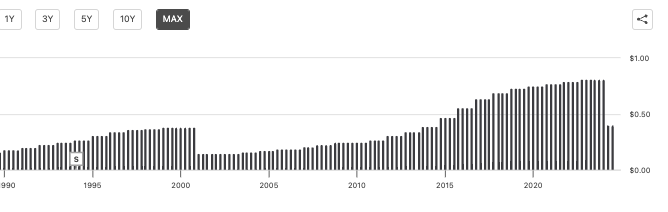
As for the economic value – that is, the propensity for capital appreciation – my views flat for IFF. This is built on the premise management is not creating economic value for shareholders in the first place.
I measured this as the return on invested capital relative to a hurdle rate, in this instance, 12%, measuring the long-term market averages. Anything above this 12% rate is an economic profit, and vice versa. Applying this benchmark to the company’s earnings shows it has not elicited economic profit across the testing period (Figure 7).
For instance, in the 12 months to March 2024, we needed net operating profit after tax of $3.1 billion on invested capital of $26.1 billion. The company produced $1.3 billion instead, causing an economic loss of $1.8 billion, or $7.15 per share. Over the period shown, management has produced an economic loss of $23.8 billion. At the same time, IFF’s market value has decreased by $14.5 billion – unsurprising when benchmarked against economic value added.
Figure 6.
Company filings, author calculations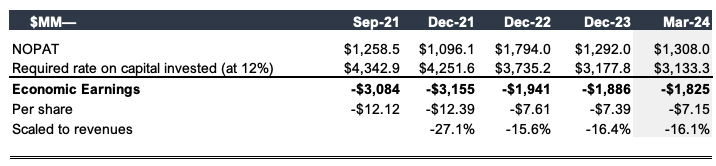
Projections of value at steady state of operations
To understand the intrinsic value of IFF and the business assets’ worth, I am going to analyse how management has been running and growing the business over the past three years. Figure 8 illustrates management’s capital allocation decisions from 2021 to 2024 on a rolling 12-month basis. It then compares this against the financial performance over this time. I have also included all acquisition activity under the investment drivers.
As observed, to create a new dollar of revenues, the company has invested most of its available funds towards working capital, but reduced capital density in acquisitions, fixed assets and intangibles. This has followed key divestment over the recent years. In my opinion, it would be unreasonable to assume this trend might continue over a five or ten-year period. The company does shed capital through dividends, but it does need operating assets to produce free cash flow in the first place. I have subsequently revised my assumptions to those shown in Figure 9.
Figure 7.
Company filings, author calculations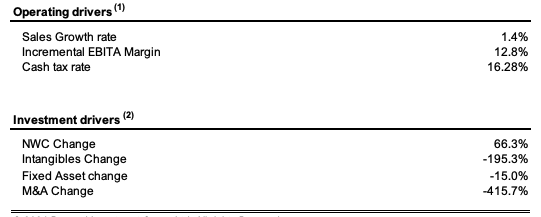
Here, I presume that a new dollar in revenues will require a $0.05 investment to fixed capital and acquisitions. I believe this is a fair set of assumptions as it aligns with more recent trends of incremental investment observed in the last 12 months, and factors in expenditures at a rate of 4% of sales (in line with Q1 2024).
Figure 8.
Author’s calculations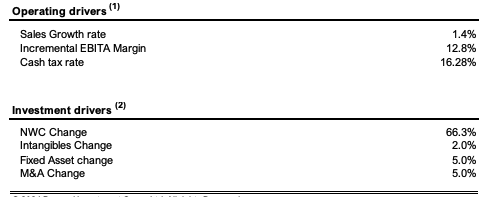
The projections built from this model are shown in Figure 10, below. I have carried the average tax rate of 16.3% forward through the series as well.
My numbers have the company to produce around $11.8 billion in sales this year, ahead of consensus estimates of $11.16 billion. These estimates have the company to throw off anywhere from $1.12 billion to $1.17 billion in free cash flow over this time, with capital turnover of 0.4x and tax margins above 10%. Under these assumptions, I estimate the company could compare its intrinsic valuation at around 140 basis points each quarter. As discussed in more views on valuation below, this is not a compelling picture.
Figure 9.
Author’s estimates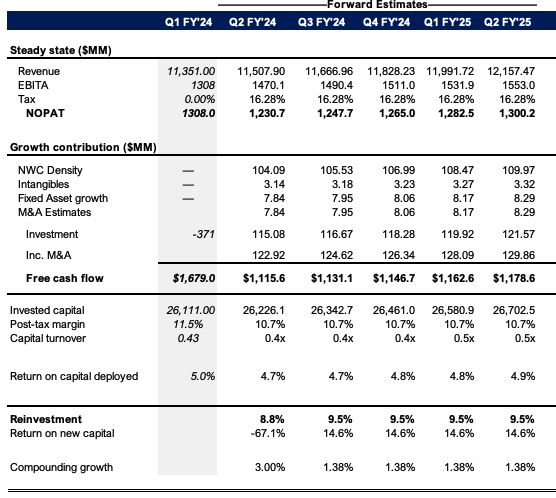
Valuation
The stock sells quite expensively to the sector at 26x trailing non-GAAP earnings and 55x EBIT. It also sells at 1.7 times the net assets employed in the company, and this tight multiple is correct in my opinion, given the negligible returns on tangible capital. Immediately, I am suspicious of this valuation, as I haven’t identified management as creating substantial economic value – only through the persistent stream of dividends. This is not reflected in multiples of earnings or assets.
Moreover, you would have just seen the company sells at a higher price relative to the earnings of the business, but a low price relative to the assets of the business, telling me there is a dislocation in the market’s views on productivity of the firm’s capital.
To get a sense of whether these multiples are fair or not, I have projected my estimates of free cash flow out over the next 10 years and discounted them back at the 12% rate to arrive at a present value today. I have blended this with a view on intrinsic valuation that looks at the estimated return on capital and reinvestment rates. I have done this across two scenarios, one with the steady state of operations, and one with the revised assumptions listed earlier. Here, I get a valuation range of $78-$82 per share, ranging from 18-20x earnings. This supports a neutral view, in my opinion.
Figure 10.
Author’s assumptions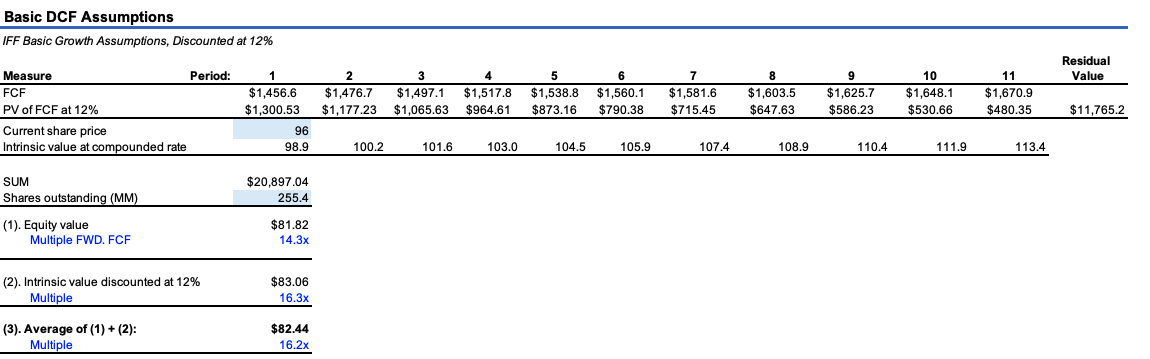
Figure 11.
Author’s assumptions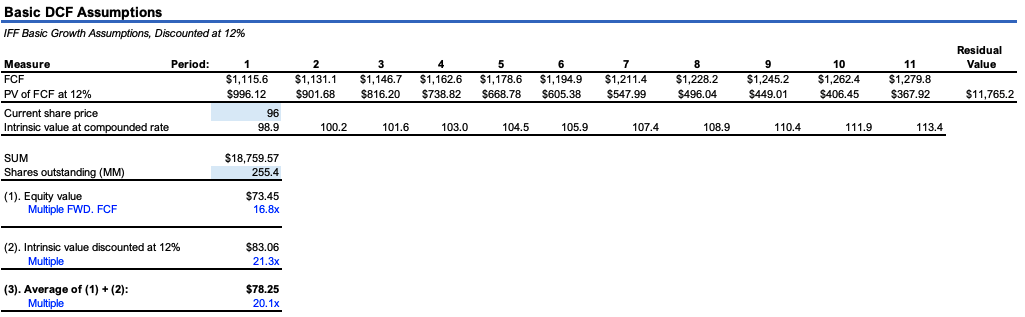
I also wanted to assess the sensitivity of the valuation to changes in the P/E multiple and earnings growth.
If management does hit the projected growth numbers of 20% in EPS this year, and the P/E multiple does not change, then the company is worth $108 to us today, a marginal upside on where it sells as I write.
The issue is, however, if the multiple contracts down to, say, the sector median of 16x, even if it hits the stipulated growth rates, implied valuation drops to $64 per share. Similarly, if it misses, but investors continue to pay this multiple, it is worth around what we pay for it today, illustrating how much the valuation is tight up to the P/E multiple versus the company’s fundamentals. This supports a neutral rating, in my view.
Figure 12.
Author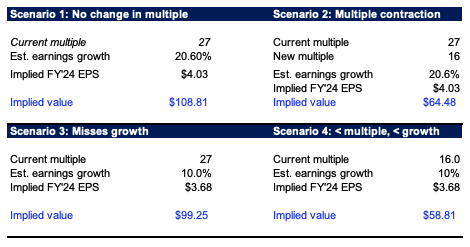
In short
IFF has an extensive history of increasing dividends and expanding its footprint in the specialty chemicals industry. It enjoys a few competitive advantages relative to peers in pricing and on the consumer side. However, these are balanced by the business economics at show, producing less than 5% returns on capital. The free cash flows it can throw off are, therefore, not of a great enough magnitude to warrant the current valuation, in my opinion. Rate hold.
Read the full article here