This is a follow-up to the May 12th article, “The Bear Market Time Limit Is Up.”
Bear markets and bear market rallies
As everyone knows, a bear market is a major decline in stock prices. While there is no exact definition, it’s usually defined as a decline of 20% or more from all-time highs. There is no duration or time limit to a bear market. It can last two months or as long as five years, which is the longest bear market since 1928.
They can be a prelude to an economic recession, or not. For example, the 1987 crash was driven by market derivatives and was not associated with any economic problems. So was the 1962 crash.
Sometimes the price decline occurs in one fell swoop; at other times it occurs in two or three declining waves. The declining waves are separated by rallies, which are called bear market rallies.
History’s longest bear market and bear market rallies
The three, longest, bear market rallies since 1928 are:
5.06 Months (Nov 12, 1929 to Apr 18th, 1930)
5.8 Months (September 21, 2001 to Apr 19th, 2002)
7.2 Months (Mar 31, 1938 to Nov 10, 1938)
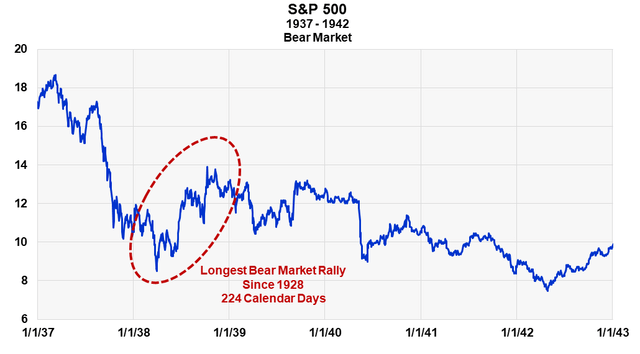
The last one (7.2 months) was also part of the longest bear market in history – the five year, 1937 to 1942 bear market (as an aside, I think Warren Buffett bought his first stock around 1942).
Both this bear market and the bear market rally are shown in the chart below. The red oval circles history’s longest duration bear market rally.

the 1937-42 bear market and record bear market rally (Sentiment King)
How does the current bear market rally compare?
Many people still consider the current rally to be a bear market rally. But if it is how does its length or time compare to the record? Let’s see.
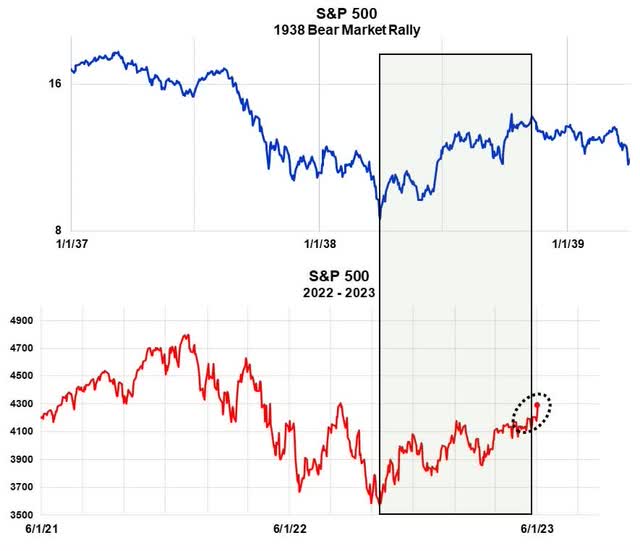
It’s all shown below. The red line plots the S&P 500 for the last two years. The first declining wave of the 2022 bear market lasted nine months and hit a low on October 10th. Since then, prices have been rising, reaching a new high for the rally this Friday.
To compare the two rallies, we’ve aligned the October low of last year with the March low of the 1938 bear market. The blue curve is the 1937-38 bear market. The time scale at the bottom is the same.
The width of the green box encompasses the 1938 record rally. As you can see by the black oval, if it is still a bear market rally the current rally is now five days longer than the record.

Comparing the Time Length of Bear Market Rallies (Sentiment King)
The time limits of bear market rallies
There are time and price limits to bear market rallies. Time wise, they should be on the same order of magnitude as the declining waves. For example, you wouldn’t have a six month decline followed by a two-year rally and then another six months decline. The rally would be too big and long. A rally that size would be considered a new bull market.
We think we’ve passed the time limits of the current rally this week. In other words, almost by definition, the nine month, 2022 bear market of last year is over.
So, it’s a new bull market, right?
If it’s no longer a bear market, it has to be a new bull market, right? The correct answer is, “No.” We had this to say on this question in an article last week:
The simple answer is that it’s the start of a new bull market. But the incompleteness of the economic picture suggests the rally could be part of something a lot more complex. We think it’s a mini bull market that lasts maybe a year and separates two declining waves or bear markets. A mini bull market that doesn’t go to new highs but brings prices back to the previous high on the S&P 500 of 4,800. It would then form a double top.
In the article, we explained why we thought this might be the case.
Summary
The record length of the current rally suggests it’s no longer a bear market rally and we’re no longer in a bear market. So, this rally is something else. Many now say it’s the start of a new bull market. We, however, thinks it’s a mini bull market that it will lift the S&P 500 back up to its previous high of 4,800 before it turns down again.
Read the full article here


