


Tech, tech, tech. It’s all any investor wants, and has been where all the momentum has gone (primarily due to the AI/Nvidia craze). We are in an age of innovation, but also in an age of FOMO, where the tech sector looks to have gotten way ahead of itself. I am negative on the sector overall at this point in the cycle, but also recognize I’ve been wrong so far. If you believe, unlike me, that the tech sector still has more leadership in it and room to run, you may want to consider the iShares U.S. Technology ETF (NYSEARCA:IYW).
This fund tracks the Russell 1000 Technology RIC 22.5/45 Capped Index, which is made of a series of stocks within the software, computer services, technology hardware, and equipment industry segments. The fund has been around since May 15 of 2000, making it one of the veteran ETFs out there given how long its track record has been, and the AUM shows it with $19 billion under management.
A Look At The Holdings
The top 10 names are all the ones you’d expect, with the top 3 (Microsoft, Nvidia, and Apple) alone making up 50% of the portfolio. Yes – significant concentration risk here (and admittedly, it has worked).
iShares.com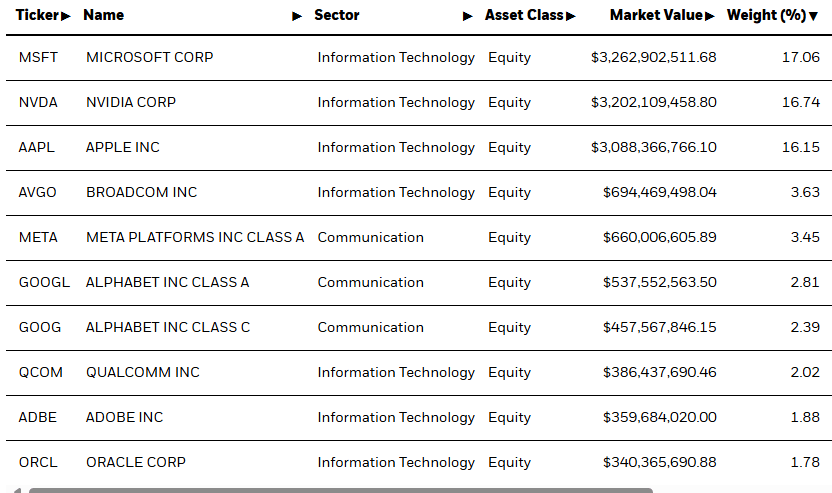
I’m sorry, but I’m just not a fan of this. I know these are the drivers of AI and innovation, but 50% exposure to just 3 stocks, no matter how strong fundamentals are and momentum is, to me isn’t representative of diversification whatsoever. At some point, any one of these companies can stumble and be a large source of risk to the fund.
Sector Composition
When we look at the breakdown, Software & Services make up 36%, followed by Semiconductors at 35%. Basically, you can’t have one without the other, so in some ways, it makes sense that those are nearly the same large weighting in the fund.
iShares.com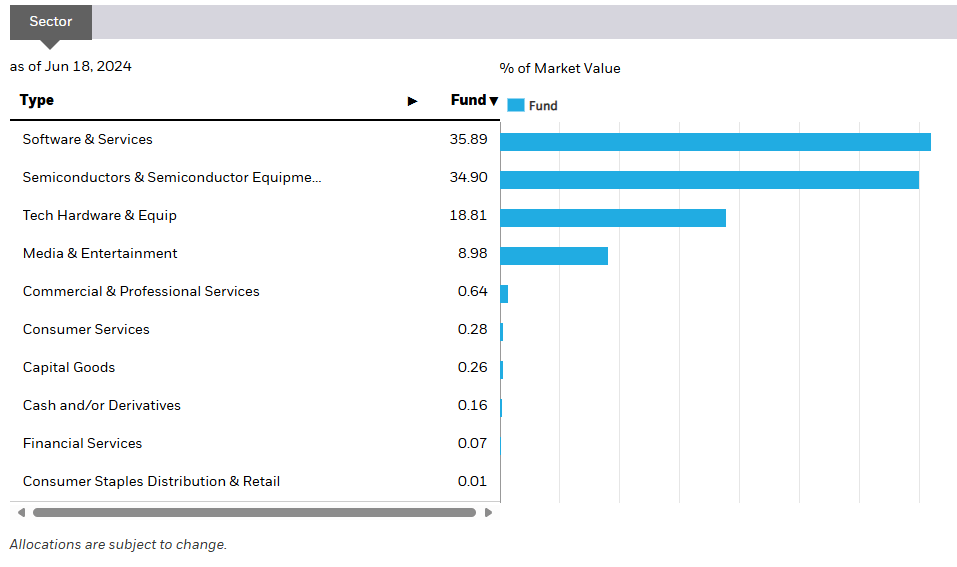
Again – I totally understand that this is where all the momentum has been. But this is insanely expensive at a Price-to-Earnings ratio on the fund of a whopping 44. Valuations, despite popular opinion, still matter.
Peer Comparison
A good fund to compare this against is The Technology Select Sector SPDR Fund ETF (XLK). IYW to XLK, we find that IYW has outperformed since the October bottom of 2022. Why? The biggest difference between the two funds is one stock and one stock alone – Nvidia, which in XLK makes up as of writing 5.9% of the fund, versus the 16.74% allocation in IYW.
StockCharts.com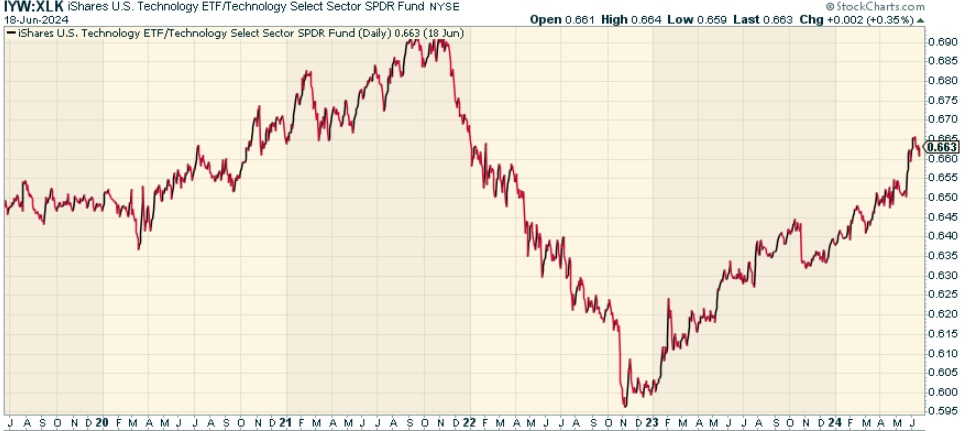
Ultimately, I don’t know how anyone can comfortably choose one fund over the other. There seems to be no sustainable outperformance in either over time.
Pros and Cons
On the positive side, investing in IYW is a clean way of getting access to the very mega-cap tech names that have been pulling the stock market higher over the past year and a half. You can invest in it, or trade it, but this basically focuses on what’s been driving literally all gains broadly. Investing in IYW gets you exposure to companies focused on innovation, primarily through AI, given the market’s belief that this is our future.
On the negative side, I really do worry about not just the sector overall (from a mean reversion perspective) but the high concentration at the top, particularly in the biggest 3 names of the fund. To have a fund where 50% of the holdings are made up of just 3 companies seems like a dangerous game. In addition, the dynamics of the tech sector are historically volatile and cyclical, prone to rapid growth followed by sharp corrections.
Conclusion
It’s not a bad fund, but I’m just anti-concentration risk now in any market average, sector-specific or not. The fund does get you access to all the right areas and weights them at the top, but at the same time, the fund has already crushed it in terms of performance and is very expensive fundamentally. If you disagree, have at it. It’s as good as any other fund out there that’s got all the love, without realization of all of the risk.
 Anticipate Crashes, Corrections, and Bear Markets
Are you tired of being a passive investor and ready to take control of your financial future? Introducing The Lead-Lag Report, an award-winning research tool designed to give you a competitive edge.
The Lead-Lag Report is your daily source for identifying risk triggers, uncovering high yield ideas, and gaining valuable macro observations. Stay ahead of the game with crucial insights into leaders, laggards, and everything in between.
Go from risk-on to risk-off with ease and confidence. Subscribe to The Lead-Lag Report today.
Click here to gain access and try the Lead-Lag Report FREE for 14 days.
Read the full article here