


Foreword
As supplement to this article, please note that The Motley Fool, which sourced this latest list, and SureDividend both update their lists periodically.
While most of this collection of 54 Kings is too pricey to justify their skinny dividends, five of the top-ten, by yield, and three more outside of the top ten, live up to the ideal of offering annual dividends (from a $1K investment) exceeding their single share prices, and this month there are four more to watch.
In the current market adjustment, it is now possible for these eight, Altria Group Inc. (MO), Leggett & Platt Inc. (LEG), Canadian Utilities Ltd (OTCPK:CDUAF), Northwest Natural Holding Co. (NWN), Fortis Inc. (FTS) (five inside the top ten), and United Banckshares Inc. (UBSI), Kenvue Inc. (KVUE), and Hormel Foods Corp. (HRL) (the three outsiders) to stay fair-priced with their annual-yield (from $1K invested) meeting or exceeding their single-share prices.
The five to watch are: Black Hills Corp. (BKH); National Fuel Gas (NFG); 3M Corp. (MMM); Federal Realty Investment Trust (FRT); Universal Corp. (UVV).
BKH is $3.97 over-priced, UVV is $10.77 high, MMM is $31.85 overweight, FRT needs to lose $37.03 in price to join the ideal eight.
As we blog past the three-year and three quarter mark of the 2020 Ides of March dip, the time to snap-up those eight lingering top-yield dividend King dogs is at hand… unless another big bearish drop in price looms ahead. (At which time your strategy would be to add to your position in any of those you then hold.)
Actionable Conclusions (1-10): Analysts Predict 13.56% To 25.83% Top-Ten Kingly Net Gains To January 2025
Two of the ten top Kings by yield were verified as being among the top-ten gainers for the coming year based on analyst 1-year target prices. (They are tinted gray in the chart below.) Thus, this yield-based December 29 forecast for January Kings (as graded by Brokers) was 20% accurate.
Estimated dividend returns from $1000 invested in each of these highest-yielding stocks and their aggregate one-year analyst median target-prices, as reported by YCharts, produced the following 2023-24 data points. (Note: target-prices from lone-analysts were not used.) Ten probable profit-generating trades projected to December, 2024 were:
Source: YCharts.com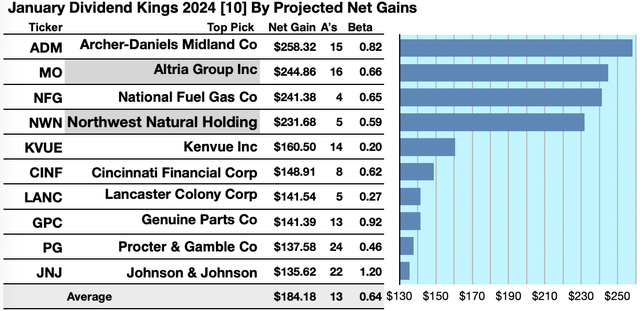
Archer Daniels Midland Co. (ADM) was projected to net $258.32, based on the median of target price estimates from 15 analysts, plus dividends, less broker fees. The Beta number showed this estimate subject to risk/volatility 18% less than the market as a whole.
Altria Group Inc was projected to net $244.86, based on dividends, plus the median of target price estimates from 16 analysts, less broker fees. The Beta number showed this estimate subject to risk/volatility 34% under the market as a whole.
National Fuel Gas Co. was projected to net $241.38 based on dividends, plus the median of target price estimates from 4 analysts, less broker fees. The Beta number showed this estimate subject to risk/volatility 35% less than the market as a whole.
Northwest Natural Holding Co. was projected to net $231.68, based on a median of target estimates from 5 analysts, plus dividends, less broker fees. The Beta number showed this estimate subject to risk/volatility 41% less than the market as a whole.
Kenvue Inc. was projected to net $160.50, based on dividends, plus the median of target price estimates from 14 analysts, less broker fees. The Beta number showed this estimate subject to risk/volatility 80% less than the market as a whole.
Cincinnati Financial Corp. (CINF) was projected to net $148.91, based on dividends, plus the median of target price estimates from 8 analysts, less broker fees. The Beta number showed this estimate subject to risk/volatility 38% less than the market as a whole.
Lancaster Colony Corp. (LANC) netted $141.54 based on a median target price estimate from 5 analysts, plus dividends, less broker fees. The Beta number showed this estimate subject to risk/volatility 83% less than the market as a whole.
Genuine Parts Co. (GPC) was projected to net $141.39 based on target price estimates from 13 analysts, plus annual dividend, less broker fees. The Beta number showed this estimate is subject to risk/volatility 8% less than the market as a whole.
Procter & Gamble Co. (PG) was projected to net $137.58, based on the median of target price estimates from 24 analysts, plus the estimated annual dividend, less broker fees. The Beta number showed this estimate subject to risk/volatility 54% less than the market as a whole.
Johnson & Johnson (JNJ) was projected to net $135.62, based on the median of target price estimates from 22 analysts, plus dividends, less broker fees. The Beta number showed this estimate subject to risk/volatility 20% over the market as a whole.
The average net gain in dividend and price was estimated to be 18.42% on $10k invested as $1k in each of these ten stocks. The average Beta ranking showed these estimates subject to risk/volatility 36% under the market as a whole.
Source: Open source dog art from dividenddogcatcher.com
The Dividend Dogs Rule
Stocks earned the “dog” moniker by exhibiting three traits: (1) paying reliable, repeating dividends, (2) their prices fell to where (3) yield (dividend/price) grew higher than their peers. Thus, the highest yielding stocks in any collection became known as “dogs.” More precisely, these are, in fact, best called, “underdogs”, even if they are “Kings.”
Top 39 Dividend Kings By Broker Targets
Sources: motleyfool.com/YCharts.com 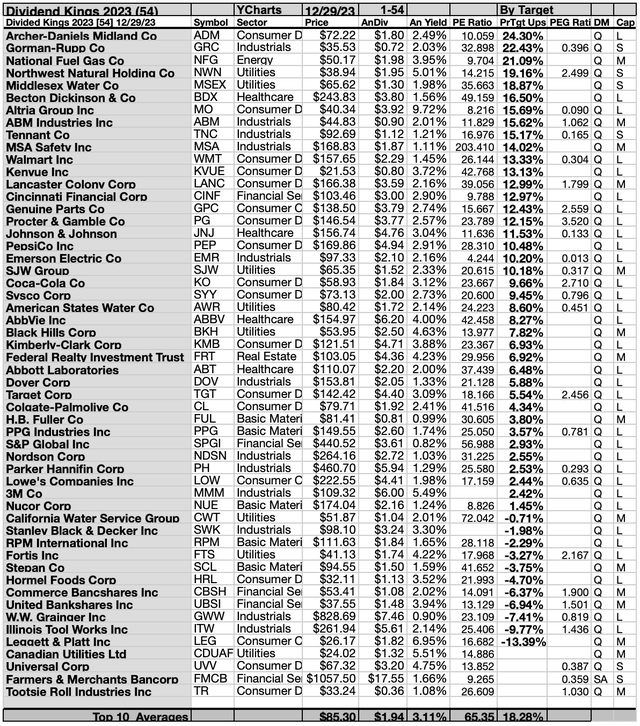
This scale of broker-estimated upside (or downside) for stock prices provides a measure of market popularity. Note: no broker coverage or single broker coverage produced a zero score on the above scale. These broker estimates can be seen as the emotional component (as opposed to the strictly monetary and objective dividend/price yield-driven report below). As noted above, these scores may also be regarded as contrarian.
Top 54 Dividend Kings By Yield
Source: motleyfool.com/YCharts.com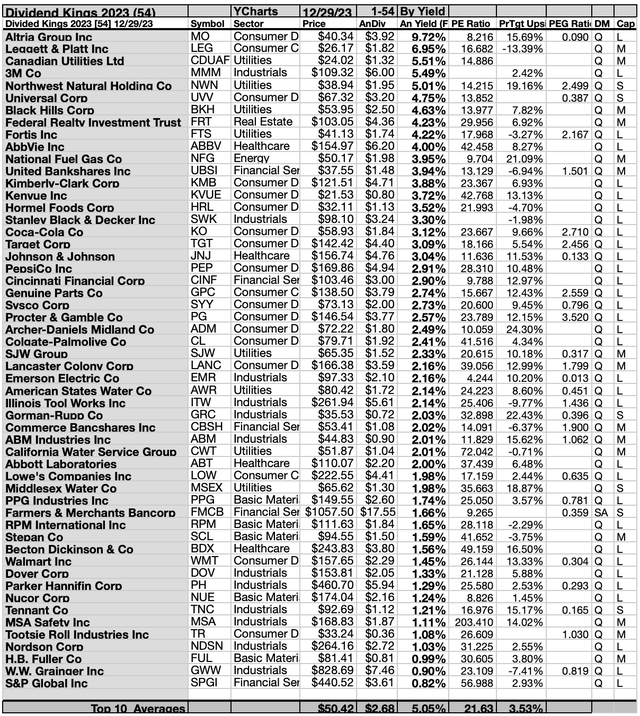
Actionable Conclusions (11-20): Ten Top Stocks By Yield Are The January Dogs Of The Dividend Kings
Top ten Kings selected 12/29/23 by yield represented six of eleven Morningstar sectors. In first place was Altria Group Inc. [1], the tops of two consumer defensive representatives in the top ten. The other placed sixth, Universal Corp [6]. Then, one consumer cyclical representative took second place, Leggett & Platt Inc [2].
In third place, was the first of four utilities, Canadian Utilities Ltd [3]. Thereafter, in fifth, seventh, and ninth places, were Northwest Natural Holding Co [5], Black Hills Corp [7], and Fortis Inc [9].
A lone industrials sector representative placed fourth, 3M Co [4]. Finally, eighth place was claimed by the lone real estate representative, Federal Realty Investment Trust [8], and tenth place went to the lone healthcare sector member, AbbVie Inc (ABBV) [10], to complete these January top-ten Kings, by yield.
Source: YCharts.com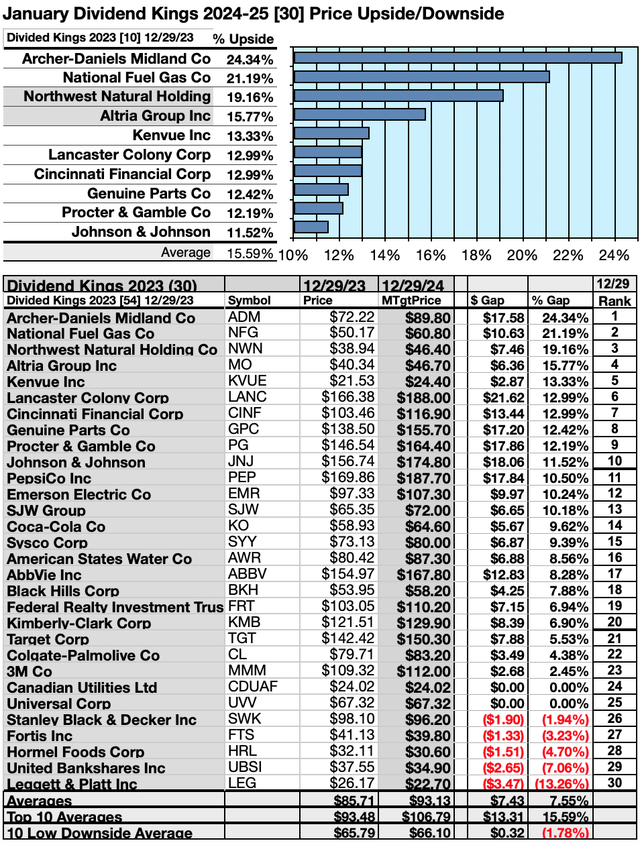
Actionable Conclusions: (21-30) Top Ten Kings Showed 24.61% To 37.22% Upsides Into December 2023; (31) On The Downside Were Two At -3.61% & -5.05%
To quantify top-yield rankings, analyst median price-target estimates provided a “market sentiment” gauge of upside potential. Added to the simple high-yield metrics, analyst median price-target-estimates became another tool to dig-out bargains.
Analysts Estimated A 1.35% Advantage For 5 Highest Yield, Lowest Priced, of Top-Ten Dividend Kings By January, 2025
Ten top Kings were culled by yield for their monthly update. Yield (dividend/price) results verified by YCharts did the ranking.
Source: YCharts.com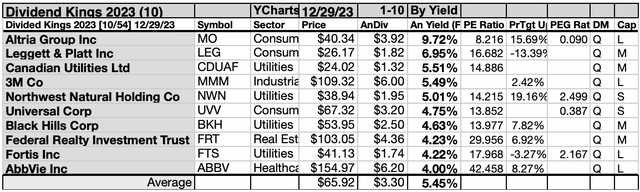
As noted above, top ten Kings selected 12/29/23 showing the highest dividend yields represented seven of eleven in the Morningstar sector scheme.
Actionable Conclusions: Analysts Estimated The 5 Lowest-Priced Of Ten Highest-Yield Dividend Kings (32) Delivering 8.97% Vs. (33) 8.85% Net Gains by All Ten by January, 2025
Source: YCharts.com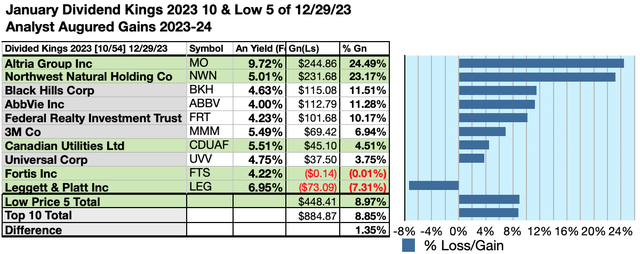
$5000 invested as $1k in each of the five lowest-priced stocks in the top ten Dividend Kings kennel by yield were predicted by analyst 1-year targets to deliver 1.35% LESS gain than $5,000 invested as $.5k in all ten. The fourth lowest-priced top-yield King stock, Altria Group Inc, was projected to deliver the best net gain of 24.49%.
Source: YCharts.com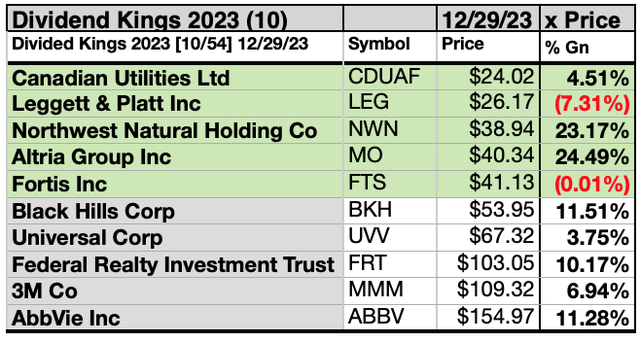
The five lowest-priced top-yield Dividend Kings as of December 29 were: Canadian Utilities Ltd; Leggett & Platt Inc; Northwest Natural Holding Co; Altria Group Inc; Fortis Inc, with prices ranging from $24.02 to $41.13
The five higher-priced top-yield Dividend Kings by the December 29 accounting were: Black Hills Corp; Universal Corp; Federal Realty Investment Trust; 3M Co, and AbbVie Inc, whose prices ranged from $53.95 to $154.97.
This distinction between five low-priced dividend dogs and the general field of ten reflected Michael B. O’Higgins’ “basic method” for beating the Dow. The scale of projected gains based on analyst targets added a unique element of “market sentiment” gauging upside potential. It provided a here-and-now equivalent of waiting a year to find out what might happen in the market. Caution is advised, however, since analysts are historically only 15% to 85% accurate on the direction of change and just 0% to 15% accurate on the degree of change.
Afterword
If somehow you missed the suggestion of the seven stocks ripe for picking at the start of the article, here is a repeat of the list at the end:
The following 8 (as of 12/29/23) realized the ideal of offering annual dividends from a $1K investment exceeding their single share prices: five of the top-ten, by yield, plus one out on those top ten, live up to the ideal of offering annual dividends (from a $1K investment) exceeding their single share prices, and there are five more to watch.
Source: YCharts.com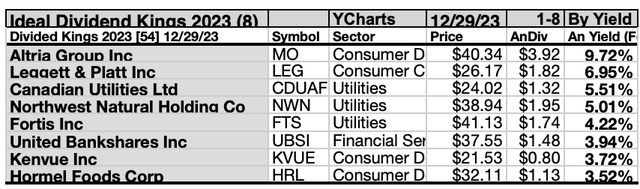
The five to watch are: Black Hills Corp; National Fuel Gas; 3M Corp; Federal Realty Investment Trust; Universal Corp.
BKH is $3.97 over-priced, UVV is $10.77 high, MMM is $31.85 overweight, FRT needs to lose $37.03 in price to join the ideal eight.
As we blog past the three-year and three quarter mark of the 2020 Ides of March dip, the time to snap-up those ten lingering top-yield dividend King dogs is at hand… unless another big bearish drop in price looms ahead. (At which time your strategy would be to add to your position in any of those you then hold.)
Price Drops or Dividend Increases Could Get All Ten Top Dividend Kings Back to “Fair Price” Rates For Investors
Source: YCharts.com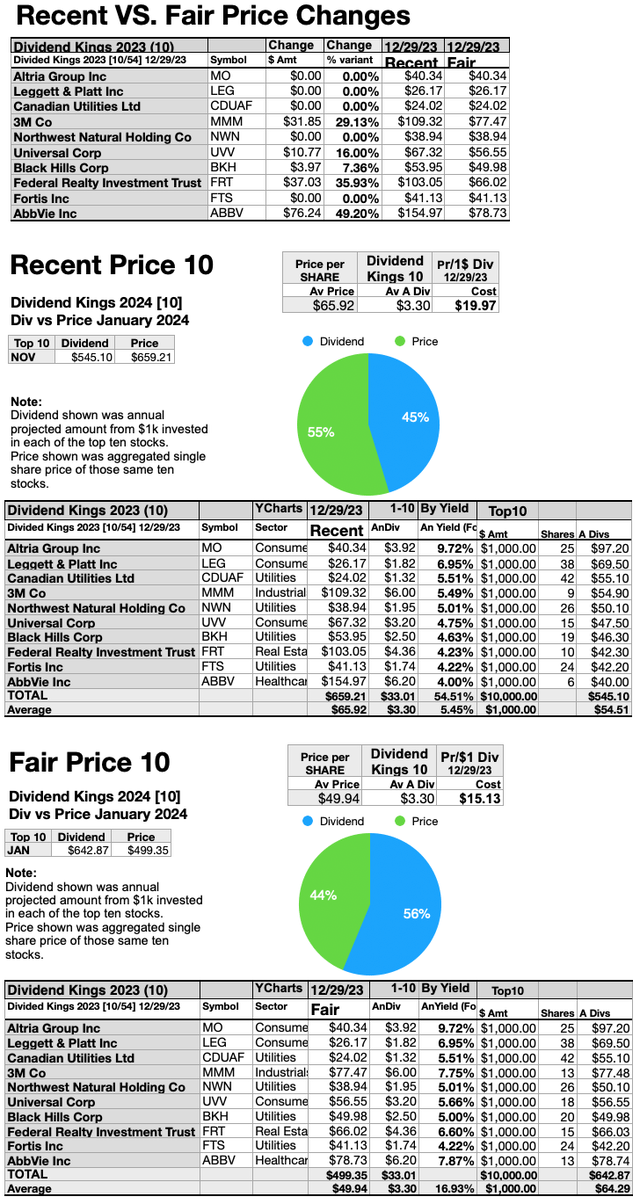
Since five of the top ten Dividend K&P shares are now priced less than the annual dividends paid out from a $1K investment, the top chart below shows the dollar and percentage differences between recent and fair prices. Note that five others are within $1.21 to $59.71 of being there. The middle chart compares the five ideals with five at recent prices. Fair pricing (when all ten top dogs conform to the ideal) is displayed in the bottom chart.
Jnuary Dividend Kings by Years Increasing Dividends
Source: Motleyfool.com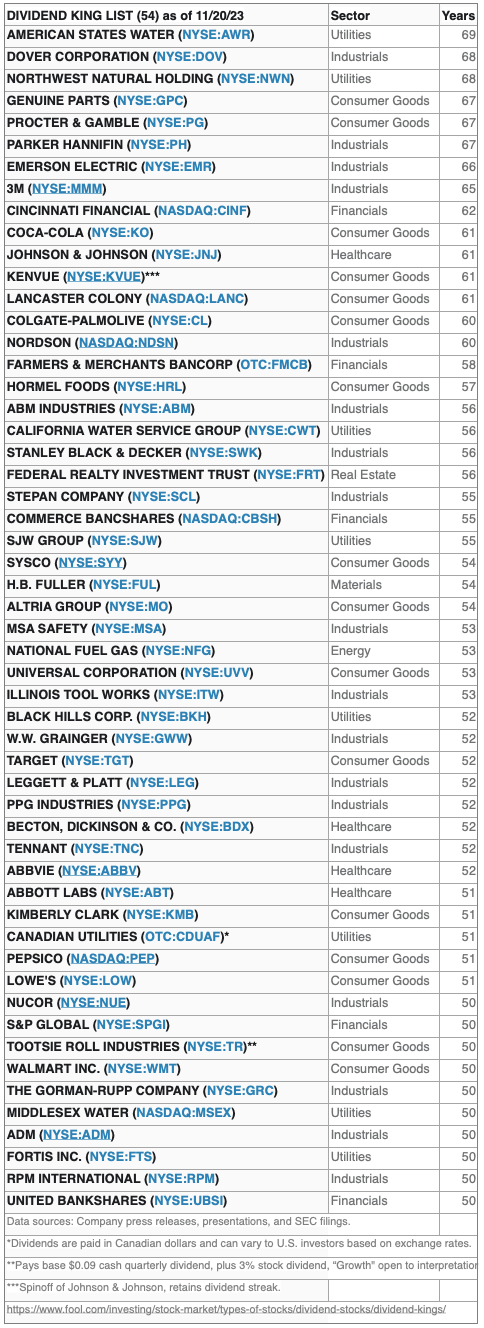
The net gain/loss estimates above did not factor in any foreign or domestic tax problems resulting from distributions. Consult your tax advisor regarding the source and consequences of “dividends” from any investment.
Stocks listed above were suggested only as possible reference points for your Dividend Aristocrats dog stock purchase or sale research process. These were not recommendations.
Graphs and charts were compiled by Rydlun & Co., LLC from data derived from www.indexarb.com; YCharts.com; Yahoo Finance – Stock Market Live, Quotes, Business & Finance News; analyst mean target price by YCharts. Dog art: Open source dog art from dividenddogcatcher.com.
Editor’s Note: This article discusses one or more securities that do not trade on a major U.S. exchange. Please be aware of the risks associated with these stocks.
Read the full article here