


Introduction
Kayne Anderson launched the Kayne Anderson BDC (NYSE:KBDC) in late 2021, entering the investment that has many established firms launching their first Business Development Corporation. Founded in 1984, Kayne Anderson is a prominent alternative investment management firm focused on real estate, credit, energy infrastructure and energy. Investment vehicles managed or advised by Kayne Anderson have $36 billion in AUM. For more on Kayne Anderson, use this link.
As with almost all BDCs or funds I have reviewed, I give KBDC a Hold rating until it proves itself.
Advantages and disadvantages of BDC investing
The Pros include high dividend yields, liquidity over other loan-investment options, and diversity provided by the portfolio. Cons include high risk from lower-rated debt, interest-rate sensitivity, the CEFs holdings themselves are illiquid, and no tax advantage that other dividend-paying assets enjoy. If the CEF uses leverage, losses can be magnified.
Kayne Anderson BDC review
Seeking Alpha describes this BDC as (edited):
Kayne Anderson BDC, Inc. is business development company and an externally managed, closed-end, non-diversified management investment company. The fund seeks to make investments in middle-market companies. It also makes debt investments in middle-market companies and investing primarily in first lien senior secured, unitranche, and split-lien loans to privately held middle-market companies.
Source: seekingalpha KBDC
The managers list the following points in defining their investment strategy for KBDC:
KBDC’s investment objective is to generate current income and, to a lesser extent, capital appreciation. We intend to achieve our investment objective by investing primarily in first lien senior secured loans, with a secondary focus on unitranche and split-lien loans to middle market companies.
Under normal market conditions, we expect at least 90% of our portfolio (including investments purchased with proceeds from borrowings under credit facilities and issuance of senior unsecured notes) to be invested in first lien senior secured, unitranche and split-lien loans. We expect that a majority of these debt investments will be made in core middle market companies and will generally have stated maturities of three to six years. We expect that the loans in which we principally invest will be to companies that have principal business activities in the United States.
We intend to execute on our investment objective by (1) accessing the established loan sourcing channels developed by Kayne Anderson’s middle market private credit platform (“KAPC” or “Kayne Anderson Private Credit”), which includes an extensive network of private equity firms, other middle market lenders, financial advisors, intermediaries and management teams, (2) selecting investments within our middle market company focus, (3) implementing KAPC’s underwriting process and (4) drawing upon its experience and resources and the broader Kayne Anderson network.
Source: kaynebdc
Fees schedule
As explained in the KBDC Annual Report, the BDC incurs several fees, some being flexible in nature. A quick summary of these are:
- Management fee will be calculated at an annual rate of 1.50% of the fair market value of our investments.
- The above fee will be 1.00% of the fair market value of the portion of our investments financed with borrowed funds or other forms of leverage above a 1.0x debt-to-equity ratio.
- Incentive Fee on Income: 100% of our pre-incentive fee net investment income for the immediately preceding calendar quarter in excess of 1.50% of our NAV at the end of the immediately preceding calendar quarter until the Advisor has received 15% of the total pre-incentive fee net income for that calendar quarter and, for pre-incentive fee net investment income in excess of 1.7647%, 15% of all remaining pre-incentive fee net investment income for that quarter.
- Incentive Fee on Capital Gains: 15% of our realized capital gains, if any, on a cumulative basis from formation through the end of a given calendar year or upon termination of the Investment Advisory Agreement, computed net of all realized capital losses and unrealized capital depreciation on a cumulative basis, less the aggregate amount of any previously paid capital gain incentive fees.
The CEFData site listed KBDC’s fees like this:
| Expense Ratio | 7.76% |
| Non Lev Exp Ratio | 2.07% |
| Gross Asset Expense Ratio | 3.78% |
| Gross Asset Non Lev Exp Ratio | 1.01% |
| Rel Lev Cost | 8.65% |
For comparison purposes, the Main Street Capital (MAIN), a popular BDC, has these fees:
| Expense Ratio | 7.11% |
| Non Lev Exp Ratio | 2.49% |
| Gross Asset Expense Ratio | 3.62% |
| Gross Asset Non Lev Exp Ratio | 1.27% |
| Rel Lev Cost | 5.31% |
As of the end of June, the NAV was $16.51, down $.06 from the prior quarter. Their Revolving Funding Facility saw a cost reduction of 25-50bps depending on the quality of the loans used as collateral. For the quarter, new private credit investment commitments of $141.8 million, fundings of $136.2 million and sales and repayments of $40.5 million, thus resulting in a net funded private credit portfolio increase of $95.7 million. While NII was flat, the EPS was down $.15 due to a net realized loss this quarter versus a gain the prior quarter. QoQ financial data were:
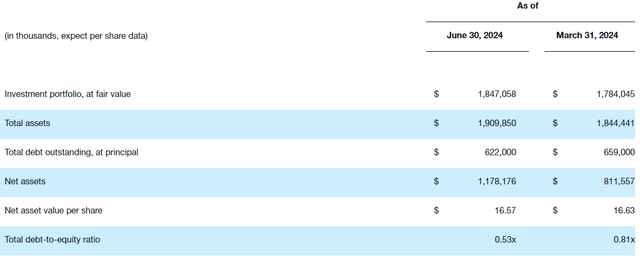
kaynebdc
While, as mentioned above, the NAV was down slightly, KBDC improved the Total debt-to-equity ratio thanks to a second quarter IPO, some of which was used to reduce the Funding Facility. The various yield measurements were basically unchanged, with the weighted average yield on the total debt portfolio remaining unchanged at 11.7%.
Holdings review
I failed to find a list of the holdings by portfolio weight, but this list by industry gives investors an idea of what terms KBDC is getting.
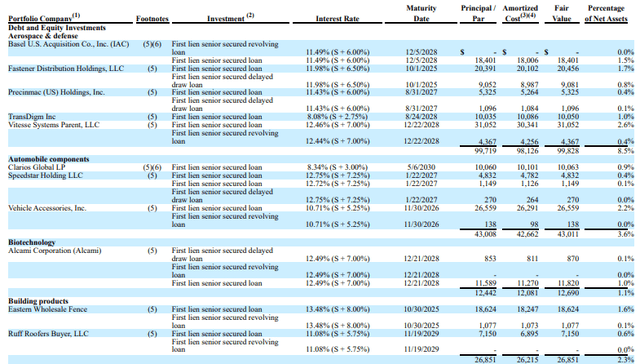
KBDC 10-Q
They did provide the following portfolio analytic data. Note that these show data from 6/30/24 and 12/31/23.
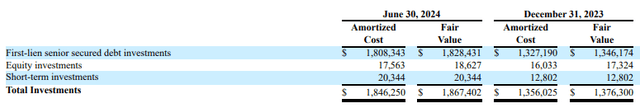
KBDC 10-Q
The portfolio, except for a minor equity exposure most likely from defaulted loans, is first liens with senior rights to assets that back them. To help measure the portfolio’s risk, each asset must be placed in a pricing level, as shown next.
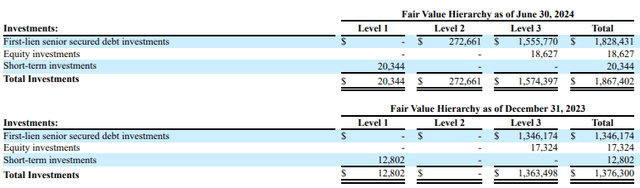
KBDC 10-Q
Level 3 is defined as in that 10Q document as: Model derived valuations in which one or more significant inputs or significant value drivers are unobservable. Unobservable inputs are those inputs that reflect the Company’s own assumptions that market participants would use to price the asset or liability based on the best available information. This table provides some detail behind the above table.
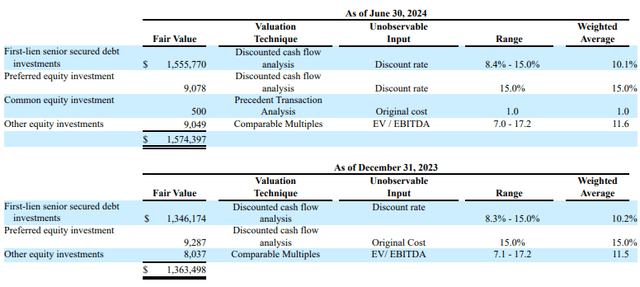
KBDC 10-Q
Industry allocations were also provided, which shows only two with a weight over 10%, another four with a weight greater than 5%. There are about 30 different industries represented, helping to reduce that factor in the portfolio’s risk composition.
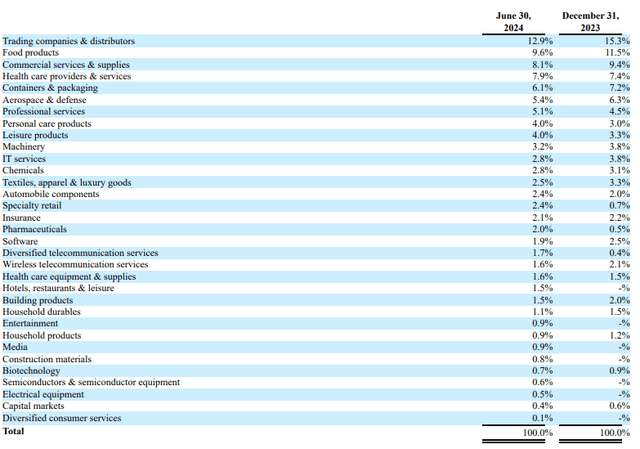
KBDC 10Q
Distributions review
KBDC has made one $.40 quarterly distribution. Assuming that rate continues, the yield would be around 10%.
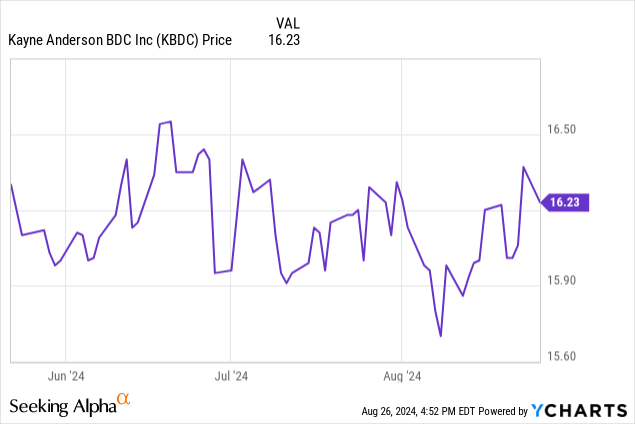
Comparing BDC price results
This is how KBDC price movement compares to four popular BDCs.
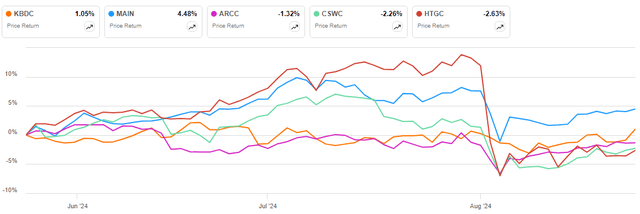
seekingalpha charting
So far, KBDC is holding its own, trailing only Main Street Capital.
Portfolio strategy
Owning a BDC gives us small-time investors the opportunity to have exposure to assets not directly available to us. They also provide selection expertise (hopefully) as not all these investments will work out. Also, like owning a MF or CEF, overall default risk is less when holding a multi-asset investment than building a personal portfolio one asset at a time. With most BDCs having a large percent of their loans/liens with floating rates, one would think investors would see payouts float with the change in rates. Looking at 10-year data for several prominent BDCs, that has not been the case: more increase as rates roses, less correlation when they declined.
Final thoughts
There are funds, such as the VanEck BDC Income ETF (BIZD), that allow investors to own numerous BDCs with one investment. While I like ETFs for some market segments, I do not for BDCs since each can provide their own diversity with a properly managed portfolio. A BDC like BIZD that bases its portfolio on an index means investors own some lemons too.
Read the full article here