


We recently wrote an article about REIT ETFs.
So maybe it’s a good idea to take a look at REIT ETFs that aim for a higher dividend yield like the Invesco KBW Premium Yield Equity REIT ETF (NASDAQ:KBWY).
KBWY focuses on high yielding small cap ETFs. The current 10% dividend yield is only interesting if we do not get a dividend decrease. Given the focus on higher risk small cap REITs we cannot exclude this possibility. It might even be very probable, given KBWY’s history both regarding total returns and dividend decreases.
Dividend history
The least one can say is that KBWY’s current dividend yield is competitive compared to treasury yields. The yield almost doubled from 5% to 10% the past two years.
Figure 1: Dividend yield (Seeking Alpha)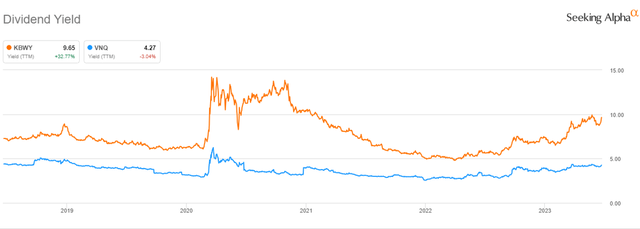
This dividend yield can decrease again in two ways: a sharp rise in the KBWY’s share price or a dividend decrease (or a combination thereof). The former is very interesting, but the latter not. So it’s an important point.
The last time KBWY’s dividend yield was this high (in 2020), the dividend per share halved…
Figure 2: Dividend history (Seeking Alpha)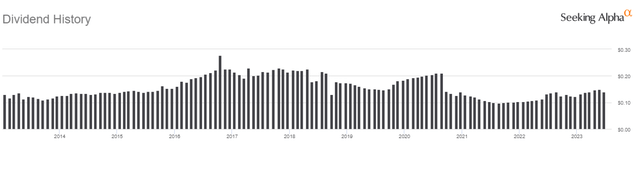
A dividend decrease is always bad news. KBWY’s past returns prove this is indeed the case.
Figure 3: Risk and return metrics (Portfolio Visualizer)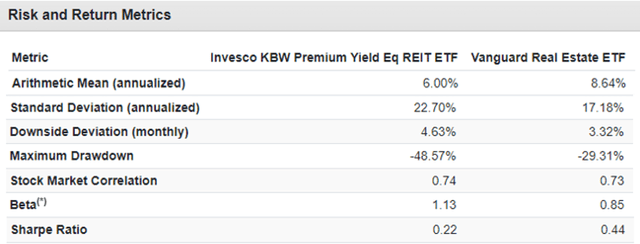
KBWY’s returns (from January 2011 until May 2023) are lower than those of the Vanguard Real Estate ETF (VNQ), while the volatility is higher. The result is a much lower risk-adjusted return. KBWY’s Sharpe ratio is only half VNQ’s. The max drawdown is also much bigger.
Figure 4: Alpha (Finominal)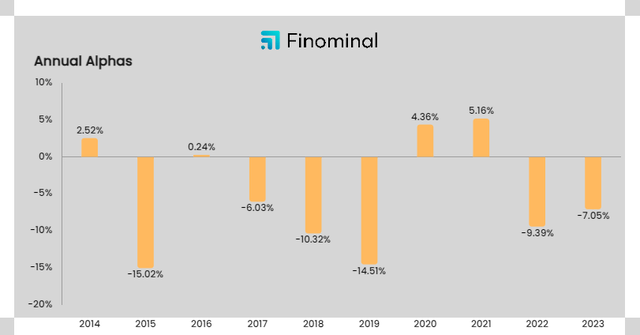
KBWY’s alpha creation history isn’t very strong and this can be explained by its uninspiring dividend history.
Portfolio composition
KBWY is benchmarked to the KBW Premium Yield Equity REIT Index, a dividend yield weighted index that seeks to reflect the performance of small- and mid-cap equity REITs in the United States. Eligible REITs are selected by the Keefe, Bruyette and Woods Index Committee. A security must be classified as a small-and mid-cap Equity REIT to be included in the index.
Figure 5: Stock style (Morningstar)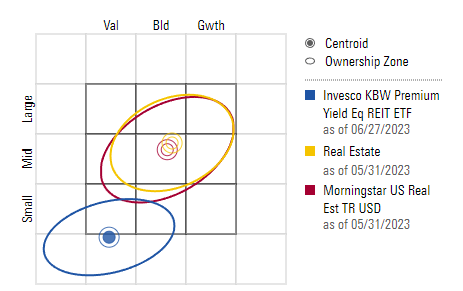
The Index Committee tries to diversify the portfolio over the different REIT sectors such that no one particular REIT sector is overly represented in the Index. It is therefore possible for lower yielding securities from REIT sectors to be included in the index, not simply the highest yielding eligible small-and mid-cap equity REITs.
Figure 6: Sector allocation (Invesco)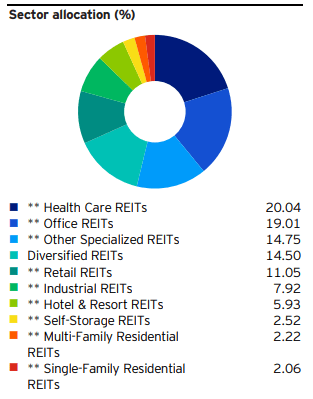
The Index is a modified dividend yield weighted index. Initial weights are determined by comparing each security’s indicated dividend yield to the dividend yield of all eligible REITs.
To further ensure diversification, these initial weights are adjusted such that the maximum weight of any REIT does not exceed 8% and no more than 5 securities are at that cap. The excess weight of any capped REIT is distributed proportionally across the remaining securities. Next, any remaining securities in excess of 4% are capped at 4% and the excess weight is redistributed proportionally across the remaining REITs. The process is repeated, if necessary, to derive the final weights.
Figure 7: Top 10 holdings (Invesco)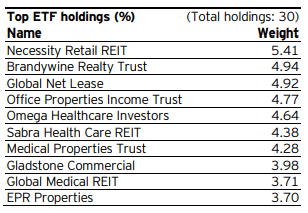
Dividend decrease?
Let’s now take a look at the portfolio composition to see how the big the risk of a dividend decrease is.
Research by S&P Global shows that REITs with a bad balance sheet trade at a bigger discount to NAV compared to REITs with a better balance sheet.
Figure 8: REIT leverage vs premium/discount to NAV (S&P Global)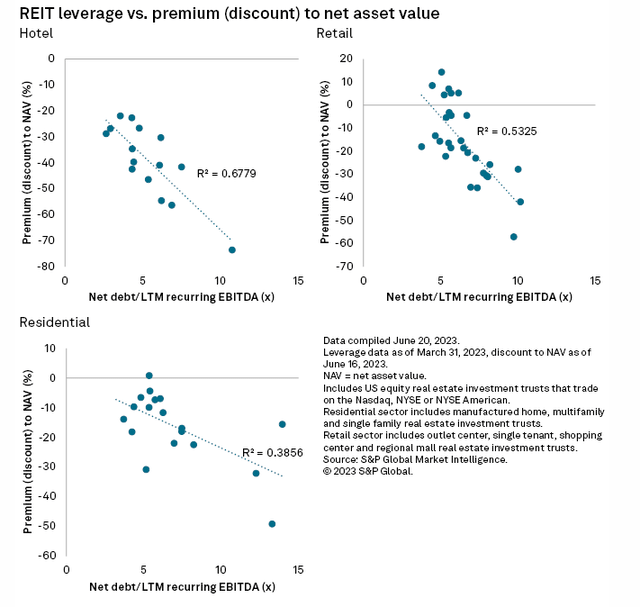
The REIT sectors with the biggest discount to NAV are Office, Hotels and Retail. At the other side of the spectrum we find Casino, Data Center and Industrial.
Figure 9: REIT Premium/ discount to NAV (S&P Global)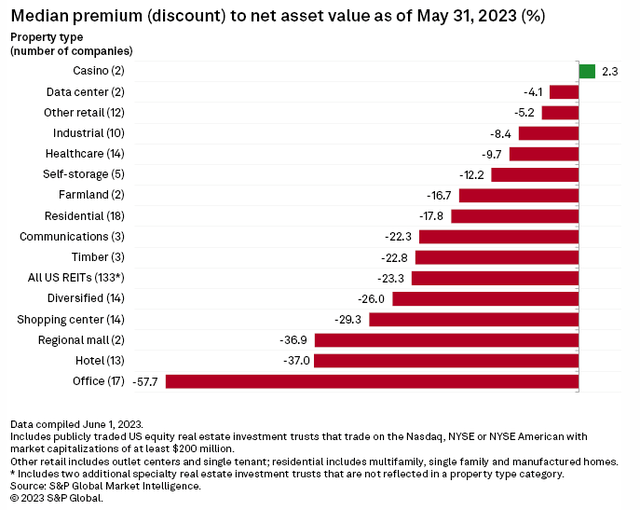
The biggest REIT sectors in KBWY’s portfolio are Healthcare and … Office.
Only four REITs in KBWY’s portfolio are trading at a premium to NAV: Omega Healthcare Investors (OHI), National Health Investors (NHI), Four Corners Property Trust (FCPT) and Getty Realty (GTY).
The average discount to NAV of KBWY’s portfolio is 30.5%, which is bigger than the REIT sector average of 23.3%.
The figures confirm this. The KBWY portfolio has an average debt/EBITDA ratio of almost 10, compared to a REIT average of 7.5. The debt ratio of KBWY stands at 58% versus 46% for the REIT average.
The book ” The intelligent REIT investor” by Stephanie Krewson-Kelly and R. Brad Thomas stresses the importance of REITs trading above NAV in the outlook for growth. When REITs trade above NAV there is a green light on growth and when REITs trade below NAV there is a red light on growth. Trading above NAV allows a REIT to issue new stocks to fund growth. If a REIT trades below NAV it’s advisable to shrink the portfolio and/or buyback shares.
In summary, the average discount to NAV indicates that both the balance sheet and the growth outlook of KBWY is worse than the average REIT market. The risk of a dividend cut is hence above average.
Trends
The risk of a dividend decrease is too big for us to call KBWY’s dividend yield attractive compared to treasury yields. KBWY is also trading at a very big discount to NAV.
The third point we look at to determine if a REIT ETF is worth investing in is the long term trend. Also here the conclusion is negative: KBWY is (still) in a long term down trend.
Figure 10: Trends (Author)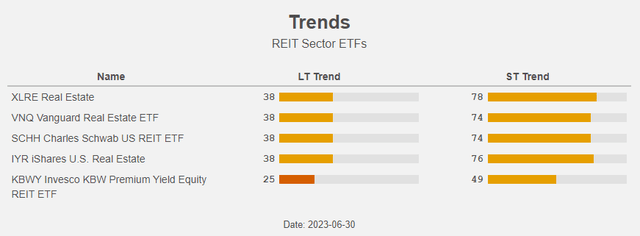
Conclusion
Given KBWY’s history both regarding dividend decreases and lacklustre total returns (probably linked to those dividend decreases) we cannot call KBWY’s dividend yield attractive compared to treasury yields.
The worse than average debt figures and the bigger than average discount to NAV are additional evidence of a possible dividend decrease. The discount to NAV also points to a worse than average growth outlook.
And finally, KBWY’s is still in a long term down-trend. Another red flag. We prefer VNQ, for which we have a hold rating. Conclusion for the Invesco KBW Premium Yield Equity REIT ETF: use the recent strength to sell.
Read the full article here