


Investment Thesis
KeyCorp (NYSE:KEY) is an attractive investment with a strategic focus on lucrative sectors, including healthcare and renewable energy. The bank’s investment in technology and data analytics, coupled with its stable financial performance – highlighted by growing commercial and consumer loan portfolios and controlled non-performing loans – underpin its value proposition.
Despite some pressure on net interest income and temporary investment losses, KeyCorp’s substantial dividend yield is appealing, though its payout ratio should be monitored. Valuation analysis shows that KeyCorp, currently trading at the lower end of its historical range, may be undervalued, suggesting a promising re-rating potential.
While acknowledging risks such as interest rate changes and regulatory shifts, the 22% expected return, weighted against various scenarios, indicates that KeyCorp is a solid choice for investors, offering a favourable balance of growth potential and risk.
Company Insights
KeyCorp, founded in 1958 and headquartered in Cleveland, Ohio, is one of America’s premier bank-based financial services enterprises. It boasts consolidated assets amounting to $188 billion. The chart below shows KeyCorp’s peer group ranked by total assets.
Analysis by: MacroDozer | Data Source: Seeking Alpha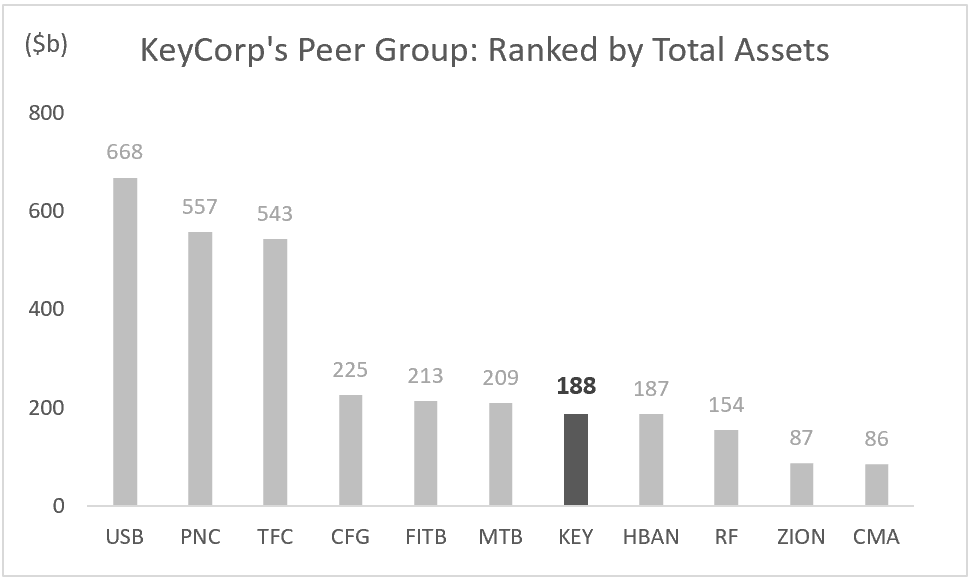
KeyCorp operates mainly through its primary subsidiary, KeyBank National Association, and offers a comprehensive suite of services. These services encompass retail, commercial, and business banking, investment management, consumer finance, and investment banking. They cater to a broad audience, from individual consumers to large institutions. Please refer to the pie charts below for business segmentation.
Analysis by: MacroDozer | Data Source: KeyCorp (SEC Filings)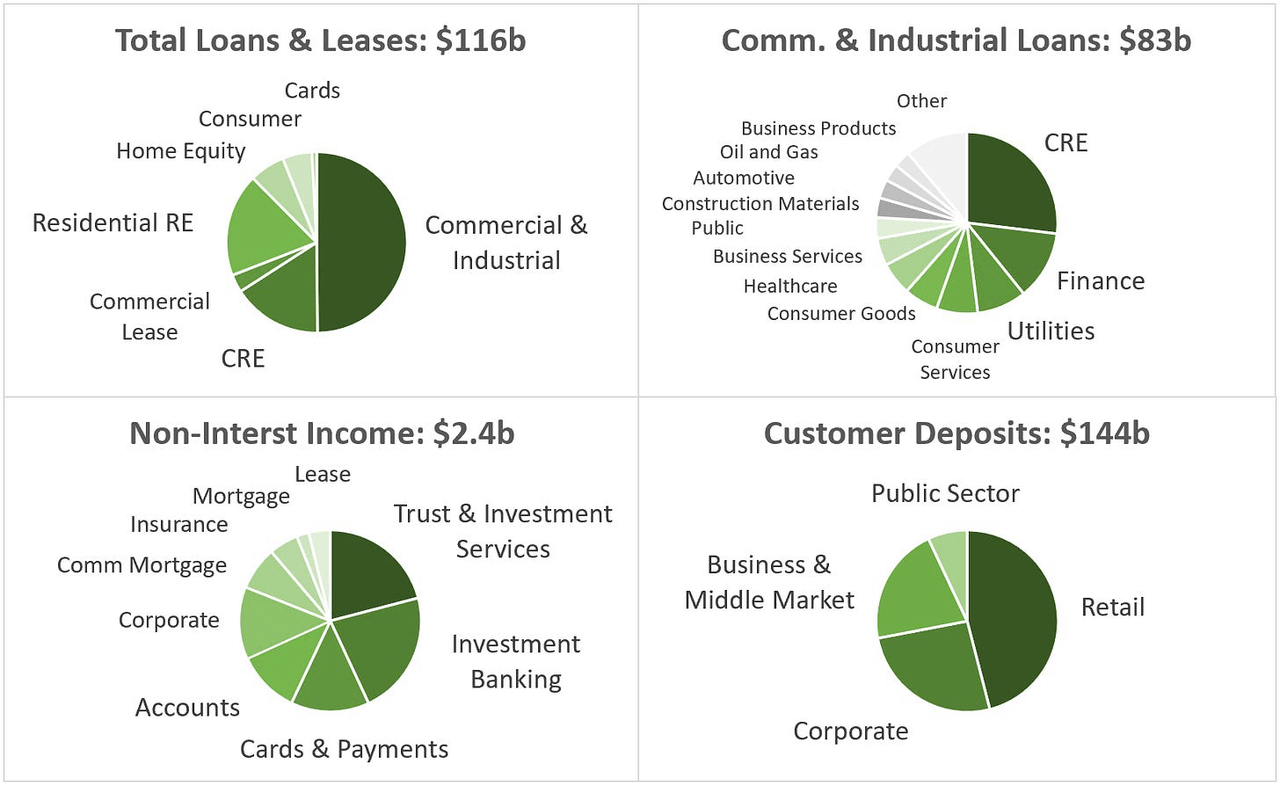
KeyBank has established a presence with approximately 1,000 branches across 15 states and an extensive online and mobile banking infrastructure that reaches the entire nation.
KeyCorp (Investor Presentations)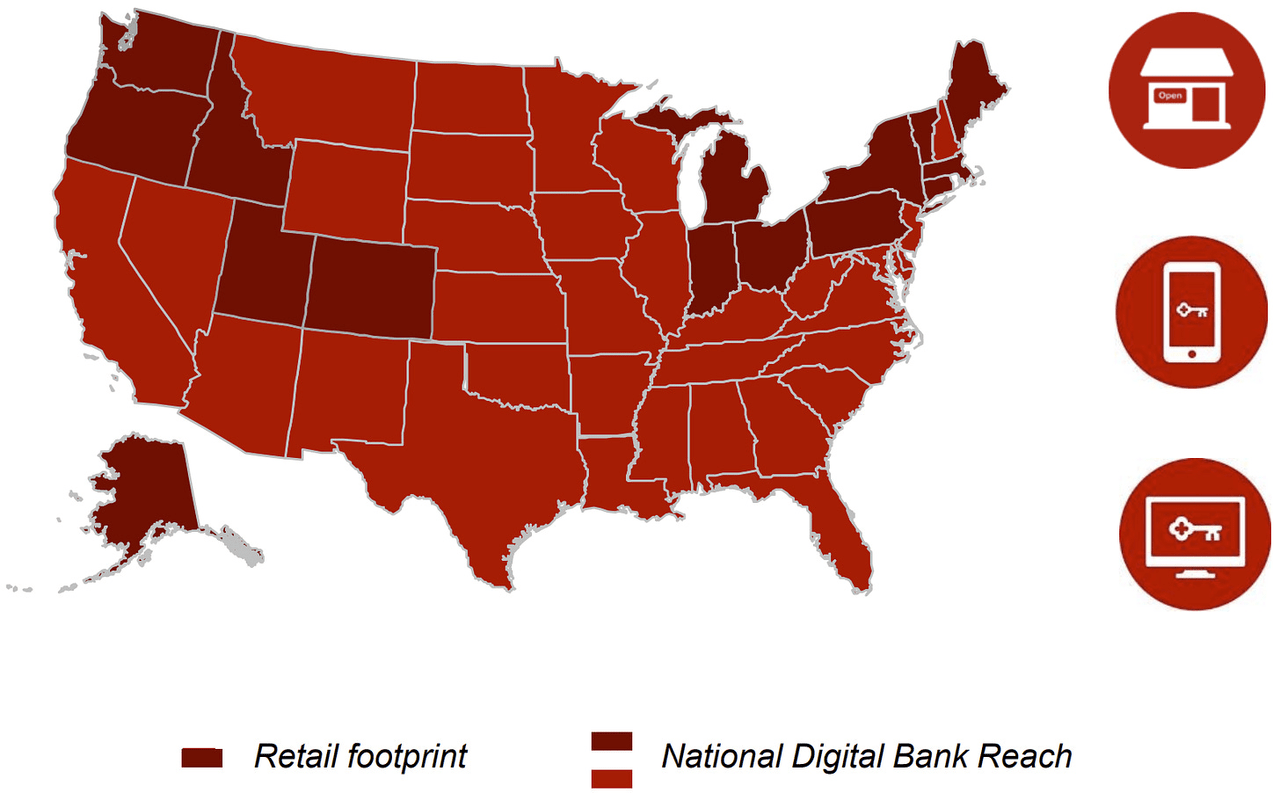
Strategic Focus: The Principle of ‘Targeted Scale’
KeyCorp’s ‘Targeted Scale’ strategy is a focused growth model prioritizing high-potential sectors to ensure sustainable growth and competitive advantage. As a specialist in selected markets, KeyCorp benefits from:
-
Deep Expertise: In-depth industry knowledge to provide customized financial services.
-
Resource Efficiency: Better capital and human resource allocation, enhancing investment returns.
-
Risk Management: Improved risk identification and mitigation in chosen industries.
-
Market Leadership: Strengthened presence and brand equity as a top provider in targeted sectors.
The high-potential sectors for KeyCorp are:
-
Healthcare: #2 in US Healthcare M&A advisory, capitalizing on the sector’s economic significance.
-
Technology: Investment in technology banking to stay ahead in the digital era.
-
Renewable Energy: Leading lender status in line with the global trend toward sustainability.
-
Affordable Housing: A significant player in financing affordable housing solutions.
KeyCorp is committed to these growth areas, leveraging targeted acquisitions, tech investments, and data analytics to deliver value to clients and shareholders. The chart below illustrates KeyCorp’s strategic initiatives and share price development over the last decade.
Analysis by: MacroDozer | Data Source: TradingView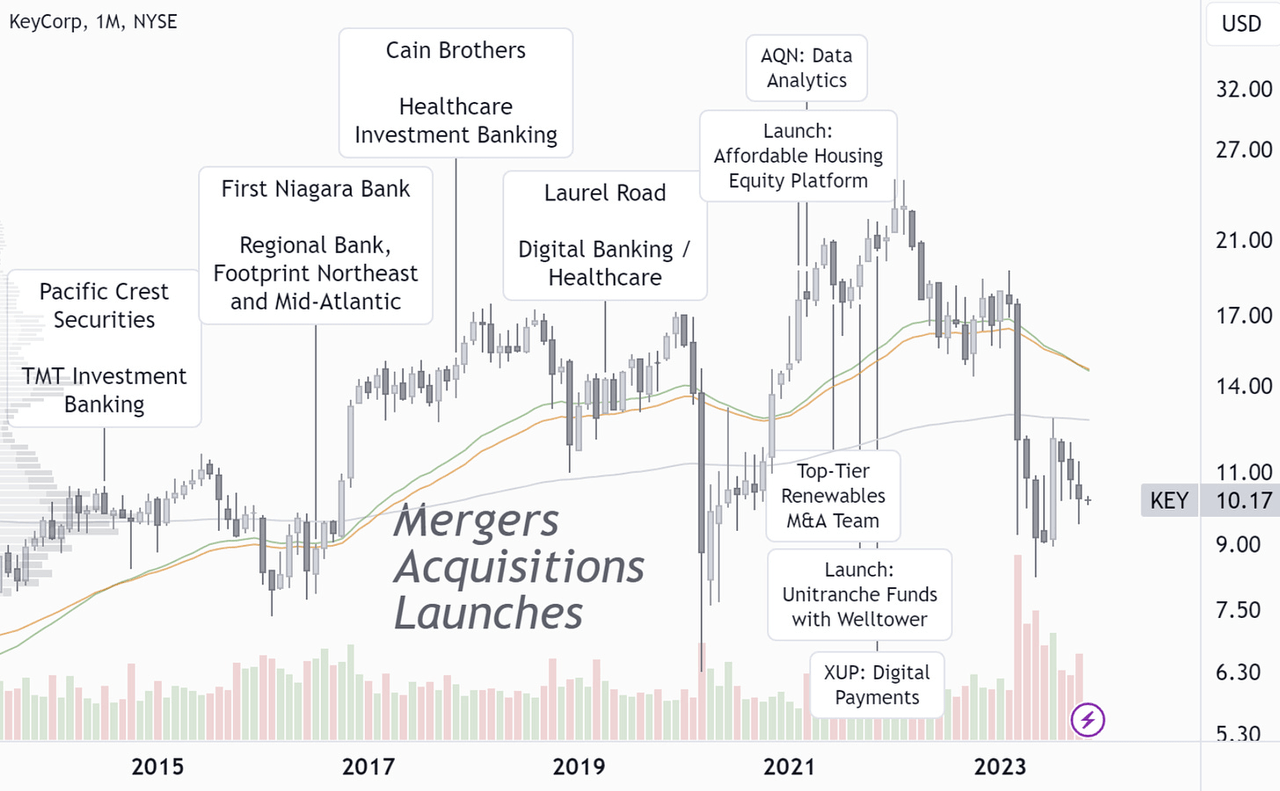
Interest Income & Investments
Moving on to financials, KeyCorp’s net interest income fell from $4.5 billion to $4.0 billion (Q3 annualized), as depicted in the chart below. This drop resulted from a strategic reduction in earning assets and the effect of rising interest rates on deposit costs (see right-hand chart). Higher asset yields could not entirely offset this change.
Analysis by: MacroDozer | Data Source: KeyCorp (SEC Filings)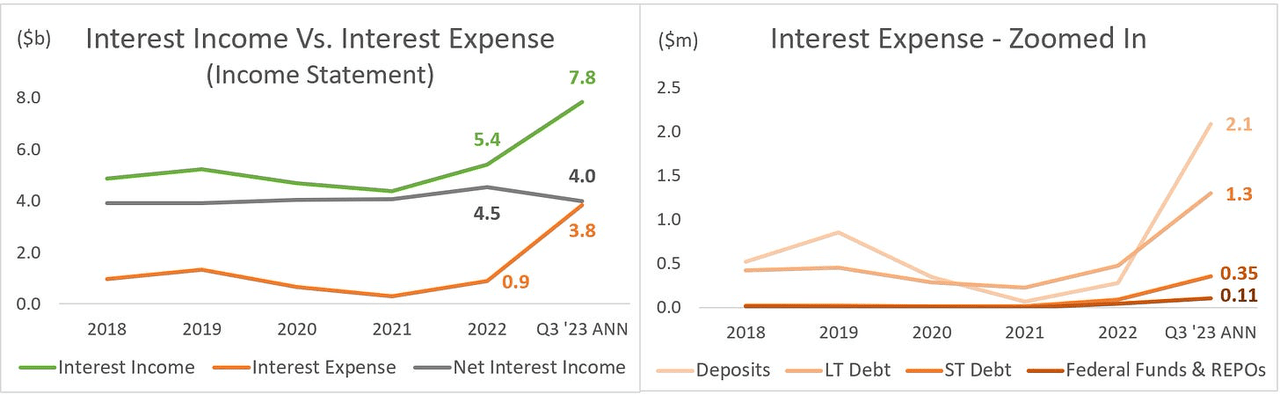
The primary reason for the dip in profits lies in increased funding expenses, coupled with a decline in fees from investment banking and commercial mortgages. Given the challenging market conditions, we consider these results acceptable. Adaptability is critical in response to significant shifts in interest rates. Despite these challenges, the bank remains highly profitable. It’s important to note that with higher funding costs, there often comes an increase in interest and investment income from new ventures.
The significant comprehensive loss in 2022, represented by the orange line in the subsequent chart, stemmed from unrealized losses in the investment portfolio, which we will discuss next.
Analysis by: MacroDozer | Data Source: KeyCorp (SEC Filings)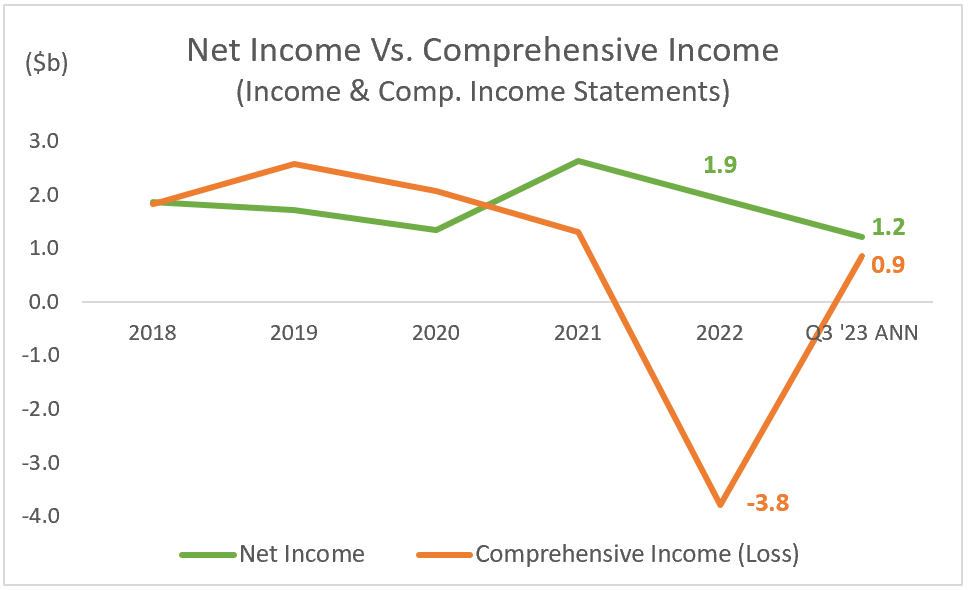
KEY’s investment portfolio consists predominantly of available-for-sale (AFS) securities, which account for more than 80%, while the remainder, 20%, are held-to-maturity (HTM) assets. This split has a significant impact on the company’s comprehensive income as it is sensitive to interest rate fluctuations and changes in the fair value of these investments, as shown above. This sensitivity also affects the equity value. It is, therefore, crucial to take this composition into account when assessing KEY’s book value multiples, particularly in comparison to historical figures or peer companies. Comparable companies with a higher proportion of HTM investments may have more stable book values, which can lead to comparatively lower multiples.
We remain confident that these unrealized losses will remain unrealized and diminish as these investments mature or recover before maturity.
Analysis by: MacroDozer | Data Source: KeyCorp (SEC Filings)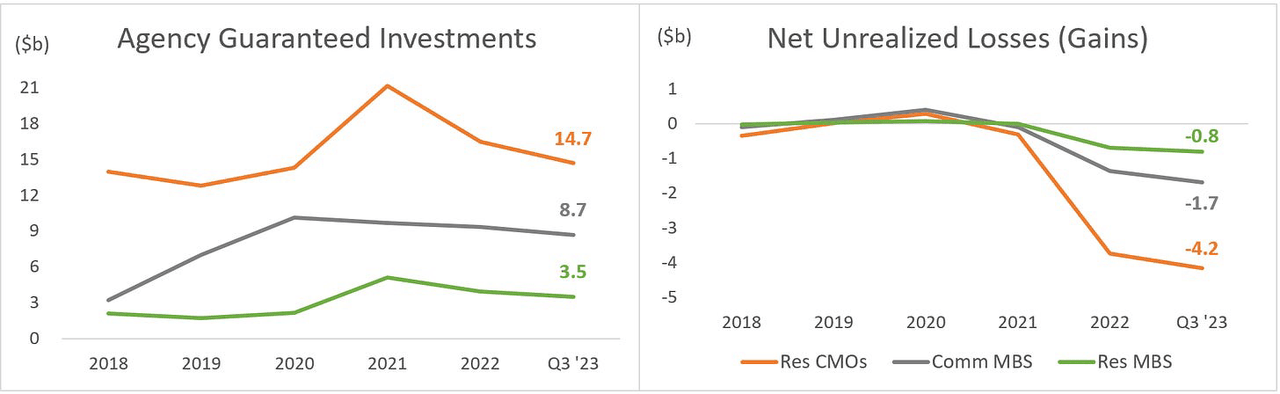
To conclude this section, we compare KEY’s efficiency directly with its industry peers using a scatter plot highlighting the net interest margin (NIM) and efficiency ratio. Based on consensus estimates for 2024E, KeyCorp performs significantly worse on both metrics, with a net interest margin of 2.3% and an efficiency ratio of 66%.
Analysis by: MacroDozer | Data Source: Koyfin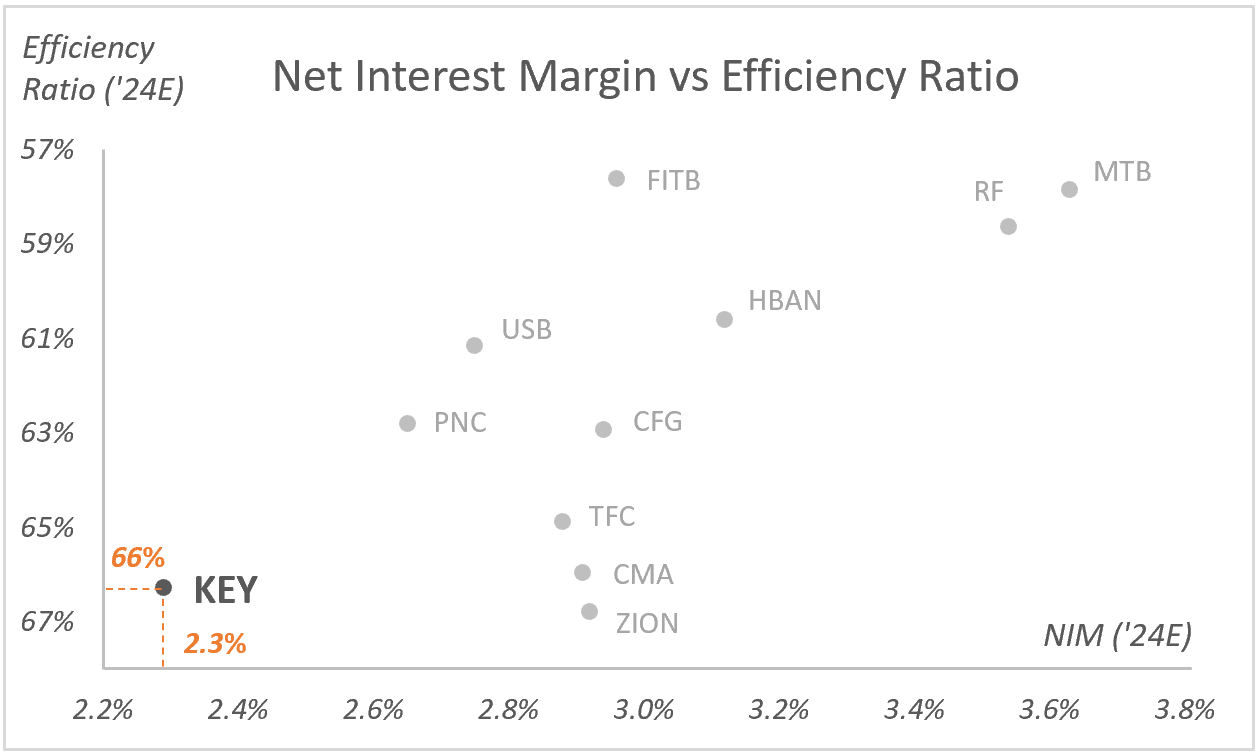
Loan & Lease Portfolio
KEY’s commercial loan and CRE portfolios have expanded by 4.5% from 2018 to Q3 2023, as illustrated in the following chart. The bank consistently boasts a remarkably low rate of non-performing loans (NPL) in both segments.
Analysis by: MacroDozer | Data Source: KeyCorp (SEC Filings)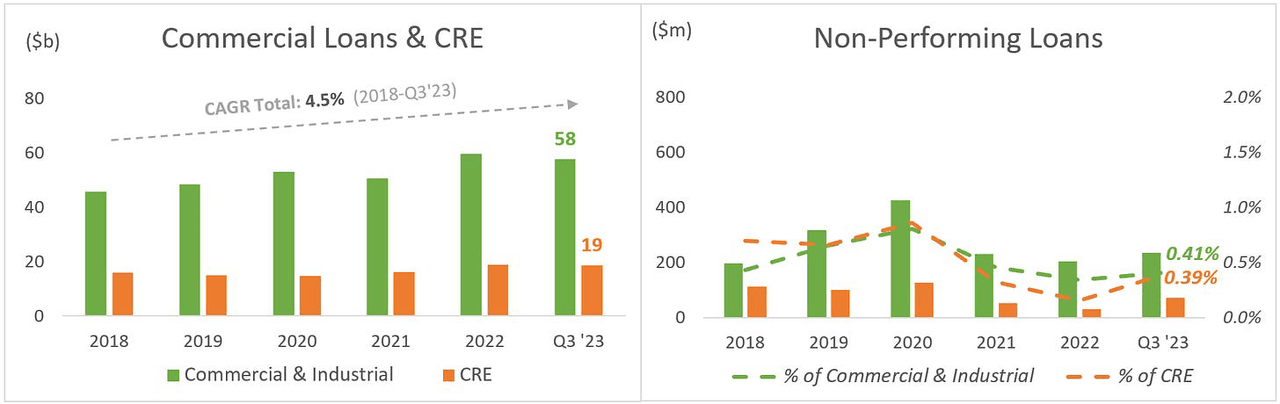
The subsequent chart showcases consumer loans alongside their associated NPLs. These loans saw a significant growth of 14.2% from 2018 to Q3 2023 while effectively managing their NPLs.
Analysis by: MacroDozer | Data Source: KeyCorp (SEC Filings)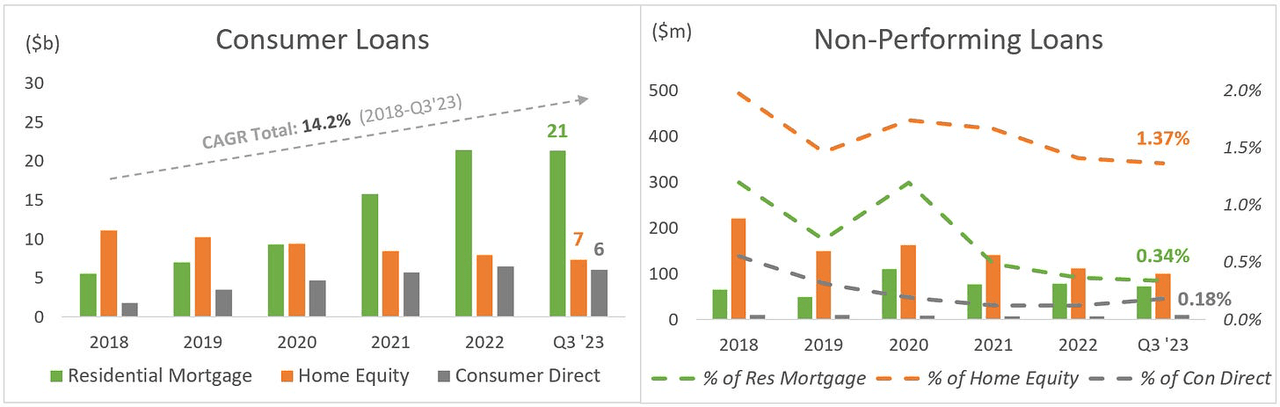
Compared to its peers, KeyCorp is characterized by an exceptionally low NPL and NCO ratio of 0.37% and 0.14%, respectively, as shown in the scatter chart below.
Analysis by: MacroDozer | Data Source: Koyfin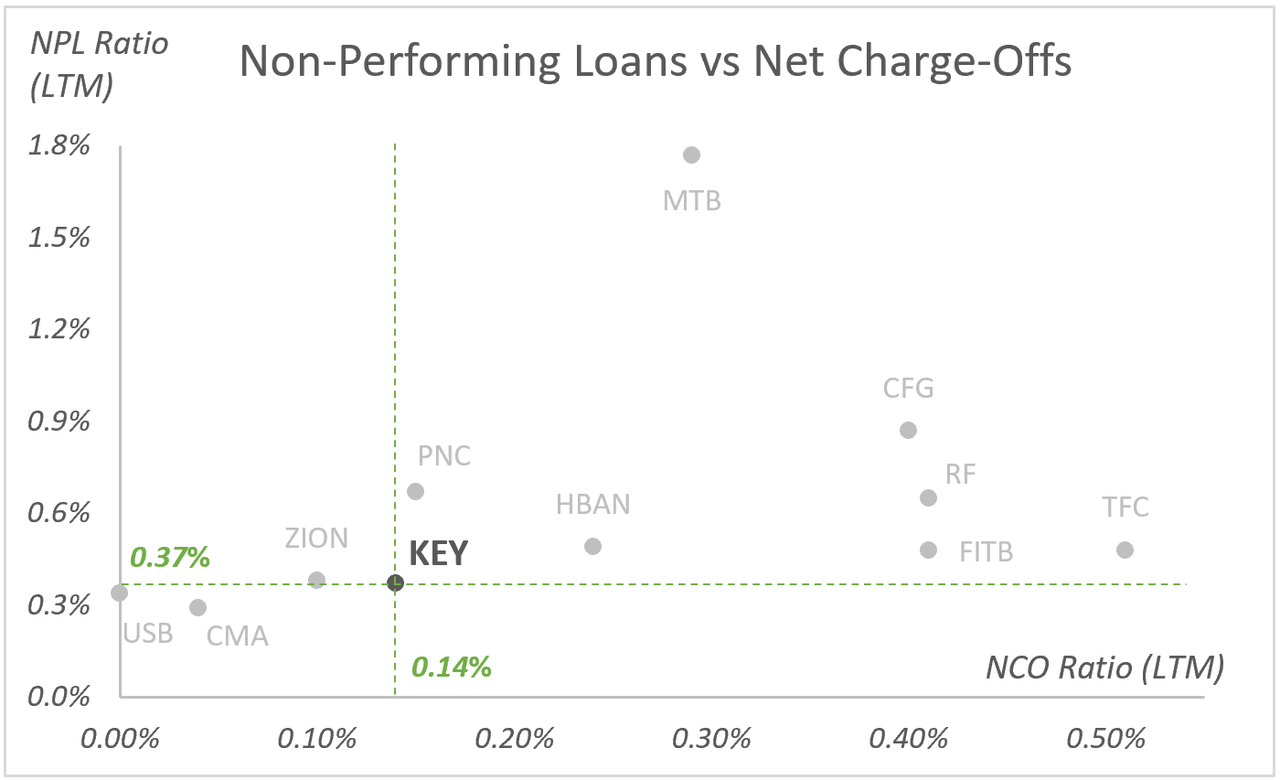
KEY’s coverage ratio, which compares loan loss provisions (ACL) to NPLs, is 3.5x – slightly above average, as shown below.
Analysis by: MacroDozer | Data Source: Koyfin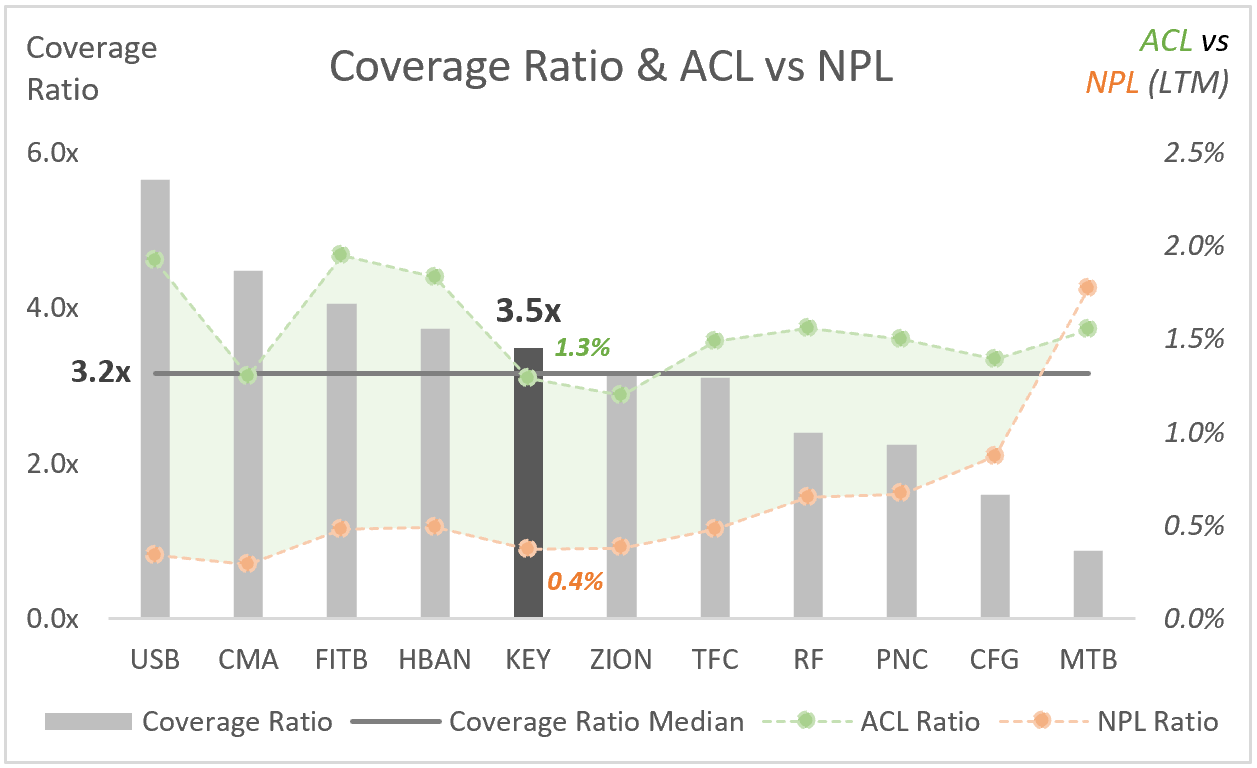
Customer Deposits & Liquidity
Customer deposits saw a notable growth of 7.0% between 2019 and Q3 2023, as illustrated in the chart below. The stability throughout 2022 and 2023 underscores KEY’s effective customer deposits management.
Uninsured deposits were managed down to only 33% of total deposits, and as of June 30, 2023, the bank’s liquidity and borrowing capacity was a commendable $80 billion, 167% of its uninsured deposits.
Analysis by: MacroDozer | Data Source: KeyCorp (SEC Filings)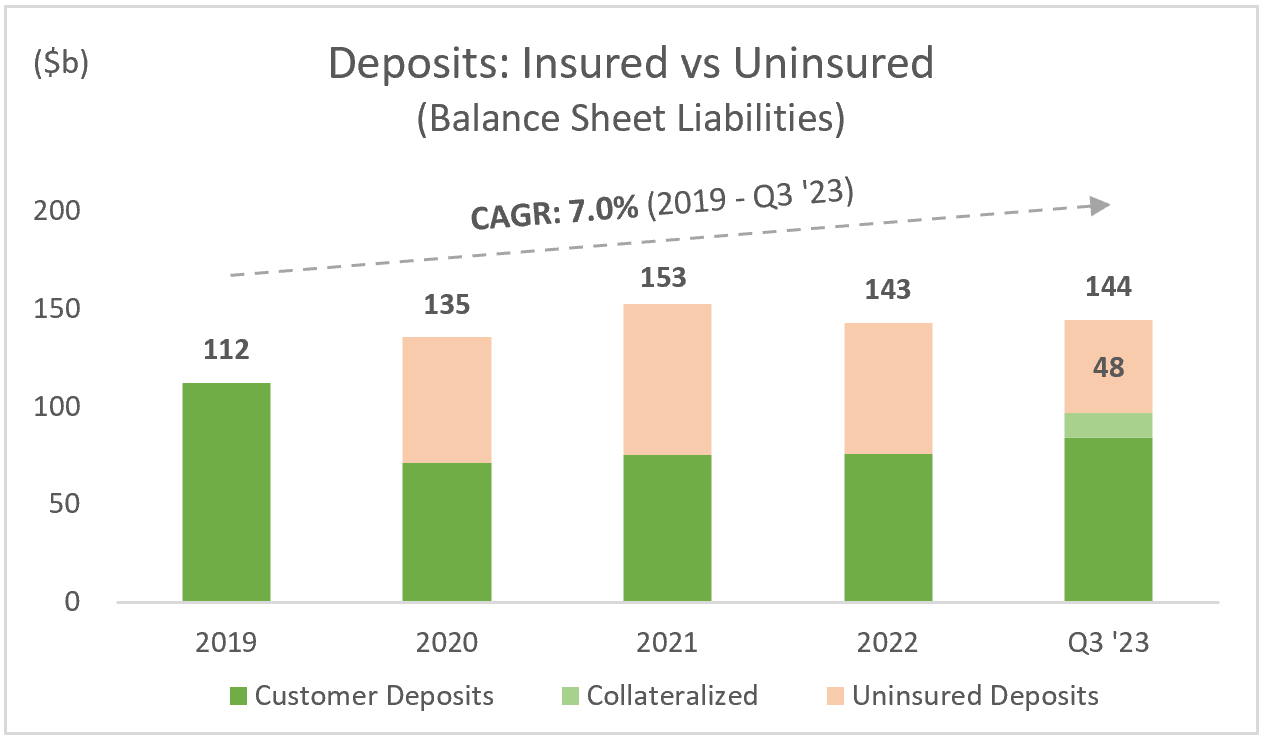
Capital Management
KeyCorp’s Common Equity Tier 1 (CET1) stands at 9.8%, with a Leverage Ratio of 8.9%, positioning it toward the lower end among its peers, as illustrated in the chart below.
Although the company considers a CET1 ratio of 9.8% acceptable – to keep pace with the competition and proactively respond to potential future regulatory burdens, there are three simple ways a bank can address this issue: retain more earnings/cut the dividend, sell or restructure risk-weighted assets, or issue new equity.
Analysis by: MacroDozer | Data Source: Seeking Alpha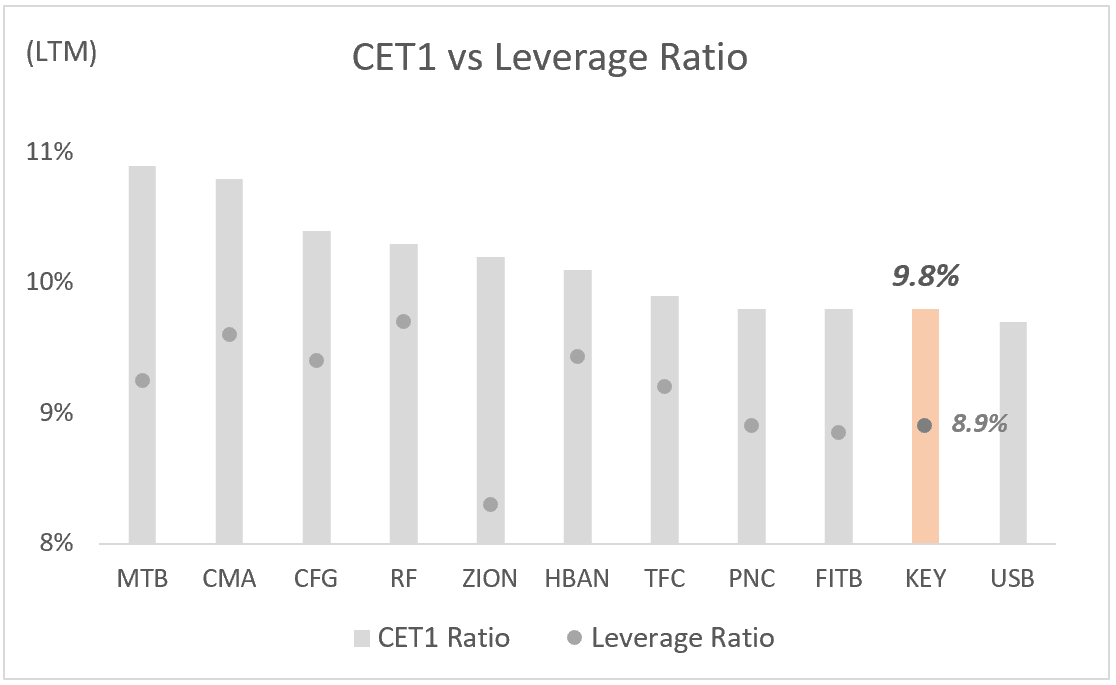
Comprehensive Analysis: Valuation, Growth, and Dividends
Growth Analysis
Below is a scatterplot illustrating the consensus estimates for KeyCorp and its peer group’s revenue and earnings growth for 2023E-2025E.
Broker estimates consistently suggest that KeyCorp will significantly outperform its peers in growth. Specifically, KeyCorp is expected to achieve a compound annual growth rate (CAGR) in earnings of 22% and revenue of 6.0% from 2023 to 2025.
Analysis by: MacroDozer | Data Source: Seeking Alpha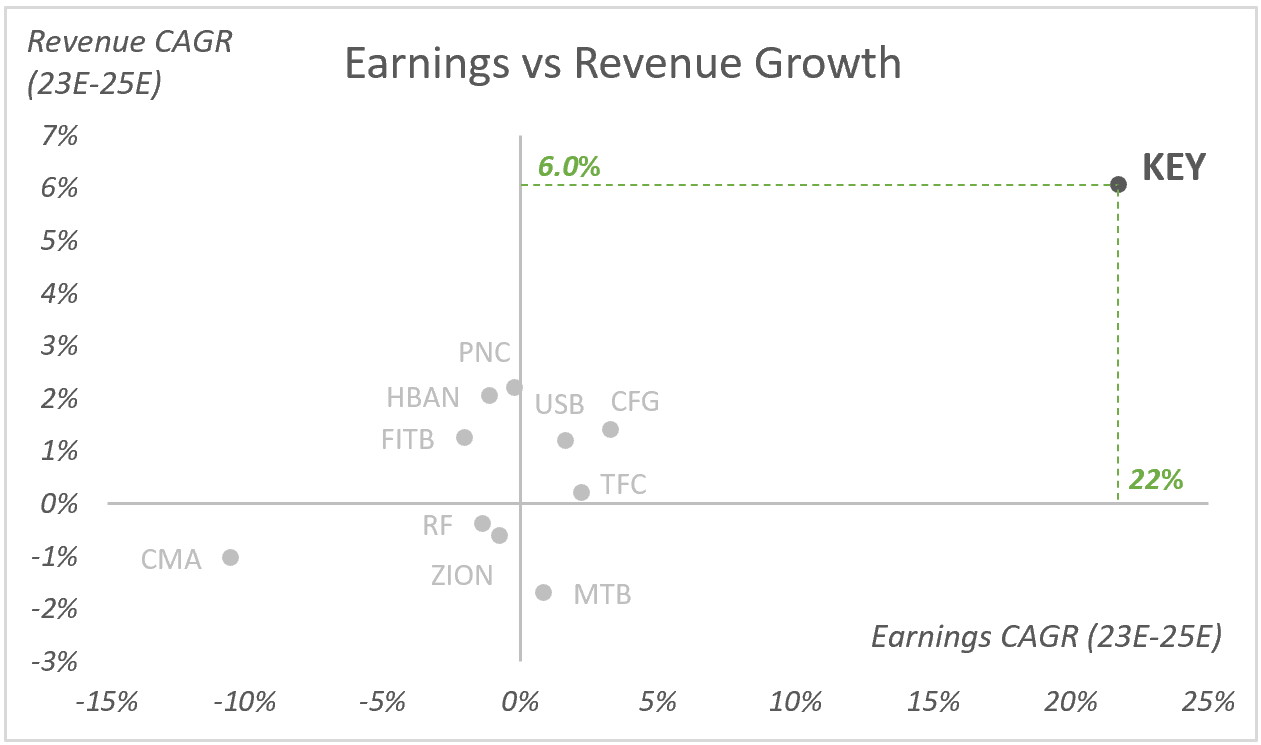
Next, we will determine whether the brokers’ earnings and sales growth estimates match their share price forecasts. The chart below shows the premium of their price targets to the current share prices of the respective peer companies.
Analysis by: MacroDozer | Data Source: Koyfin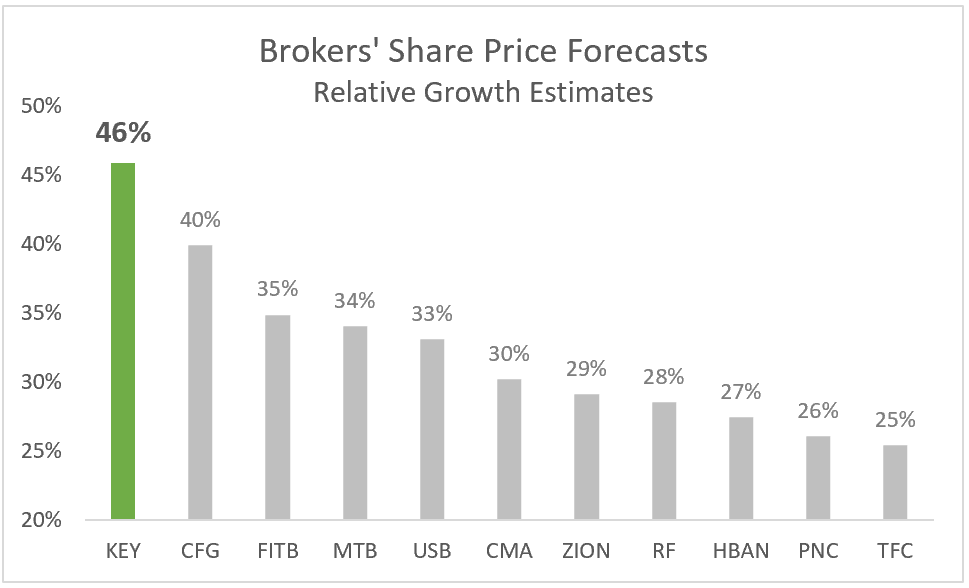
Dividend Perspective
KeyCorp’s dividend yield is an impressive 8.3%, putting it in the 94th percentile compared to the overall US market. However, the 64% payout ratio is somewhat concerning; it is considered high and suggests that a dividend cut could be imminent if net income stagnates or declines further, despite management’s assurances. This concern is consistent with an estimated dividend growth rate of 0% from 2023 to 2025.
Analysis by: MacroDozer | Data Source: Seeking Alpha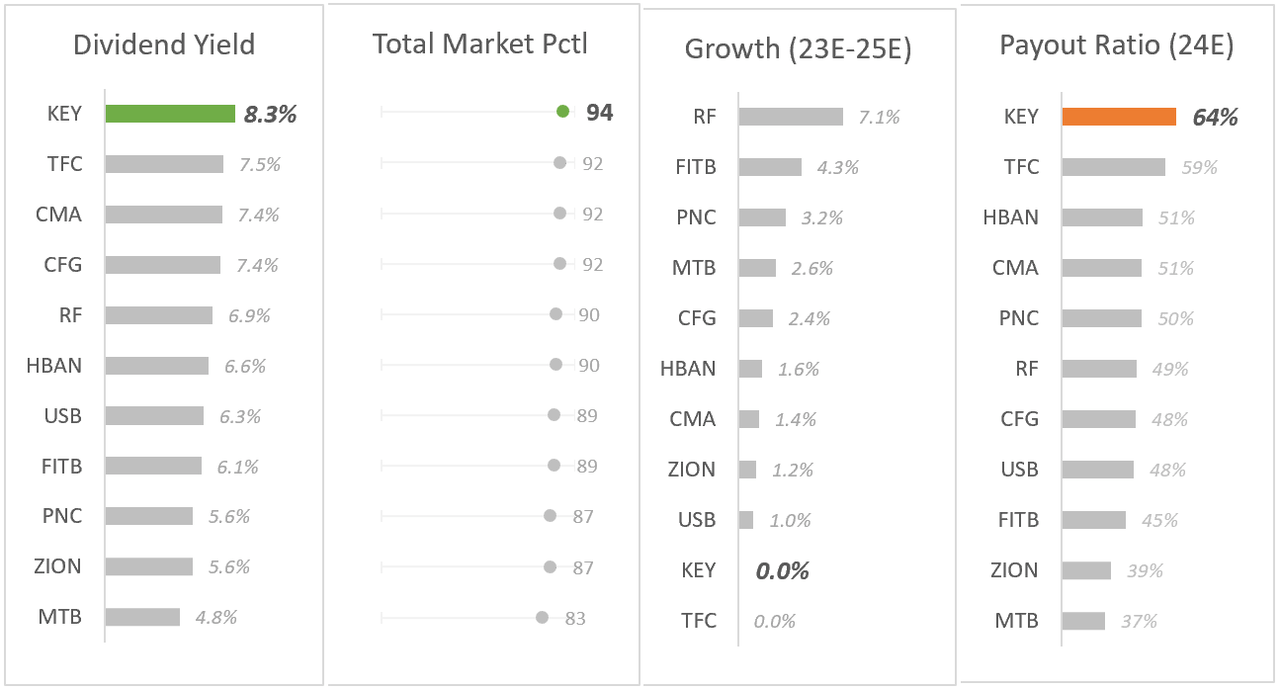
Concerning its historical dividend yield over the past decade, KeyCorp’s present yield stands in the 99th percentile, as the accompanying historical chart below demonstrates.
Analysis by: MacroDozer | Data Source: Koyfin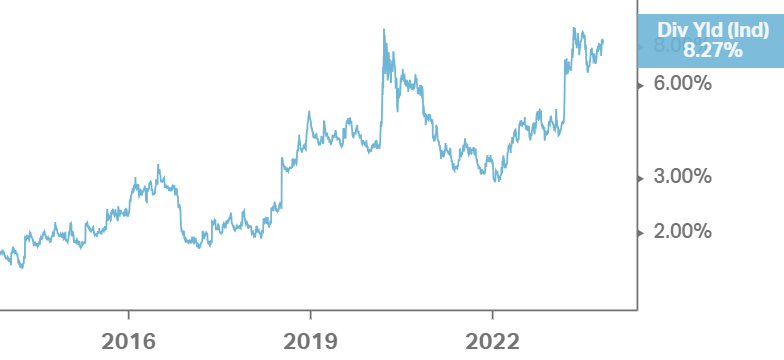
Valuation
Shifting our focus to valuation, the chart below illustrates the P/E and P/S valuation multiples for KEY and its industry peers. The grey dots denote the present market positions of each bank, while the orange and green dots represent the 90th and 10th percentiles based on the last ten years (L10Y). Notably, all banks are trading near the lower end of their L10Y valuation range.
This historical analysis, which provides upper and lower percentiles, allows us to observe typical patterns of multiple contraction and expansion over time.
Analysis by: MacroDozer | Data Source: Koyfin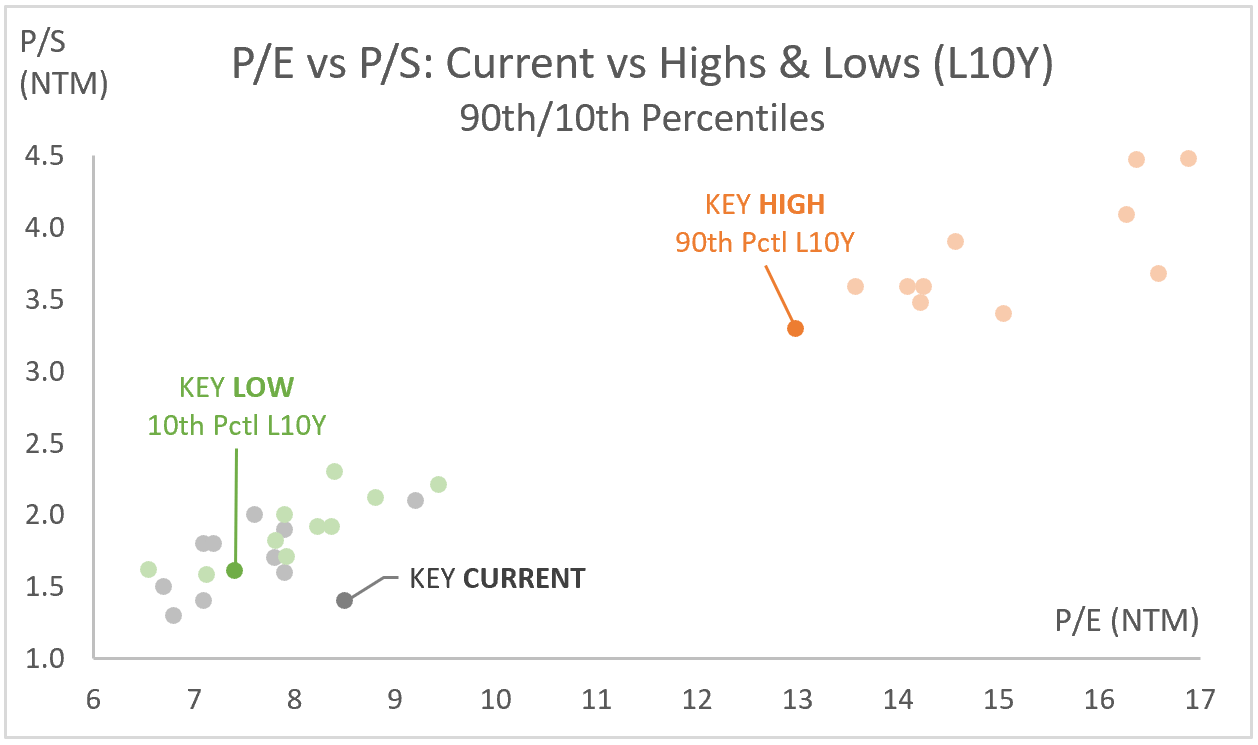
The chart below presents a similar analysis of projected 2024 multiples. KeyCorp trades at the higher end of the price-earnings (P/E) range and the lower end of the price-sales (P/S) range relative to its peers, with multiples of 7.7x and 1.4x, respectively.
Analysis by: MacroDozer | Data Source: Koyfin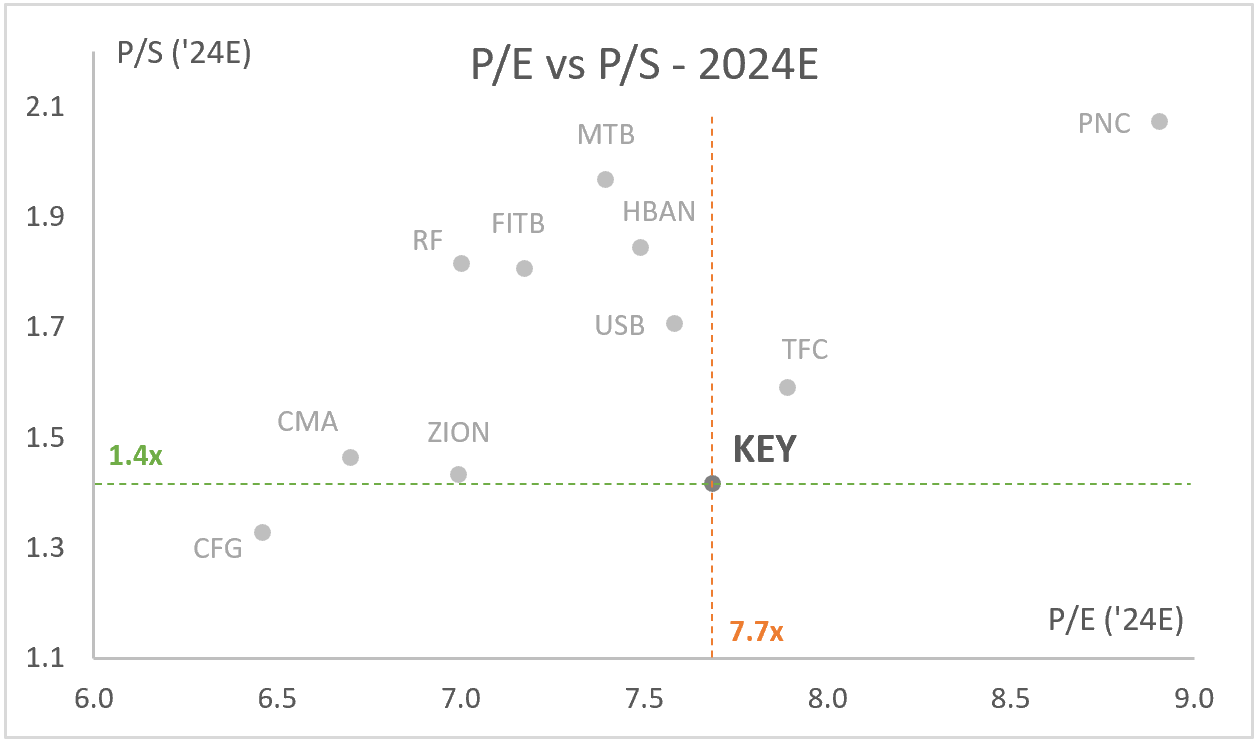
Transitioning to book values, the subsequent chart outlines the P/TBV and P/B valuation multiples for KeyCorp and its peers. Much like the initial valuation chart above, the grey dots pinpoint the current trading positions of each entity. In contrast, the orange and green dots indicate the upper and lower valuation percentiles based on L10Y.
Analysis by: MacroDozer | Data Source: Koyfin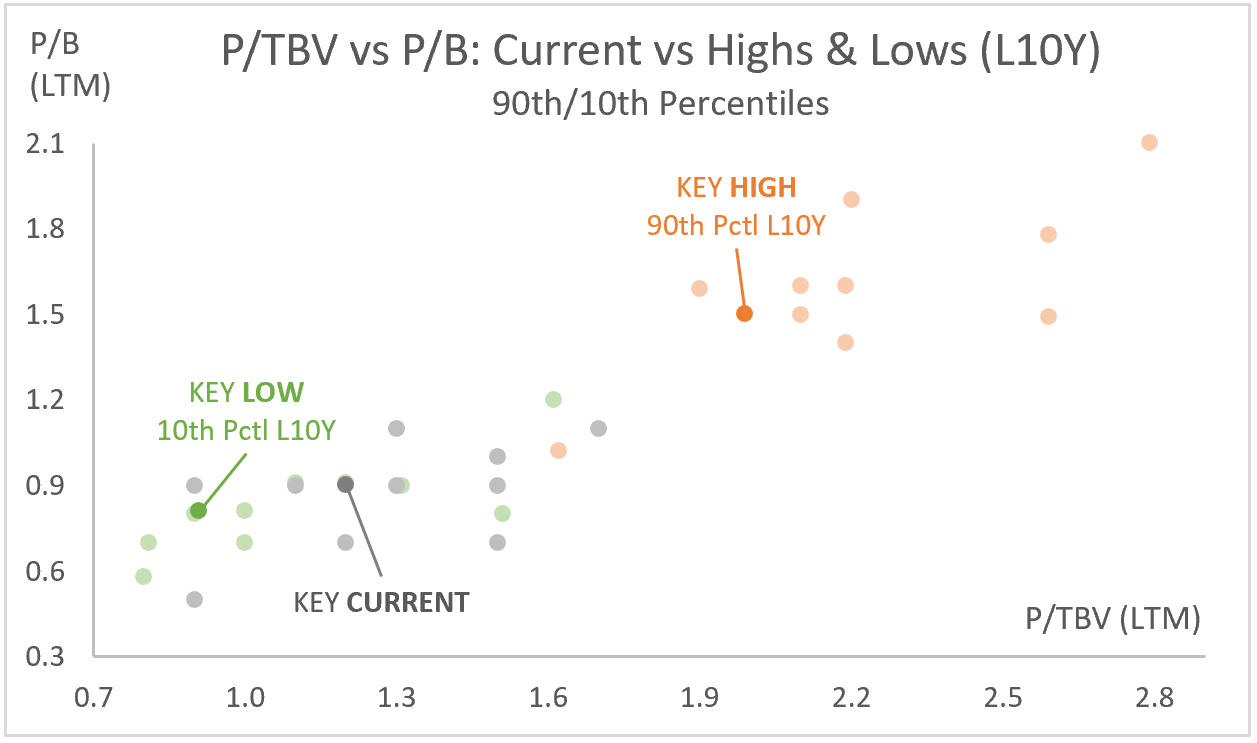
Upon examining the 2024E multiples in the chart below, we see that KEY’s tangible book value multiple of 1.07x trades below the average, while its book value multiple of 0.81x trades around it. Both metrics suggest limited immediate upside potential from this level of analysis.
Analysis by: MacroDozer | Data Source: Koyfin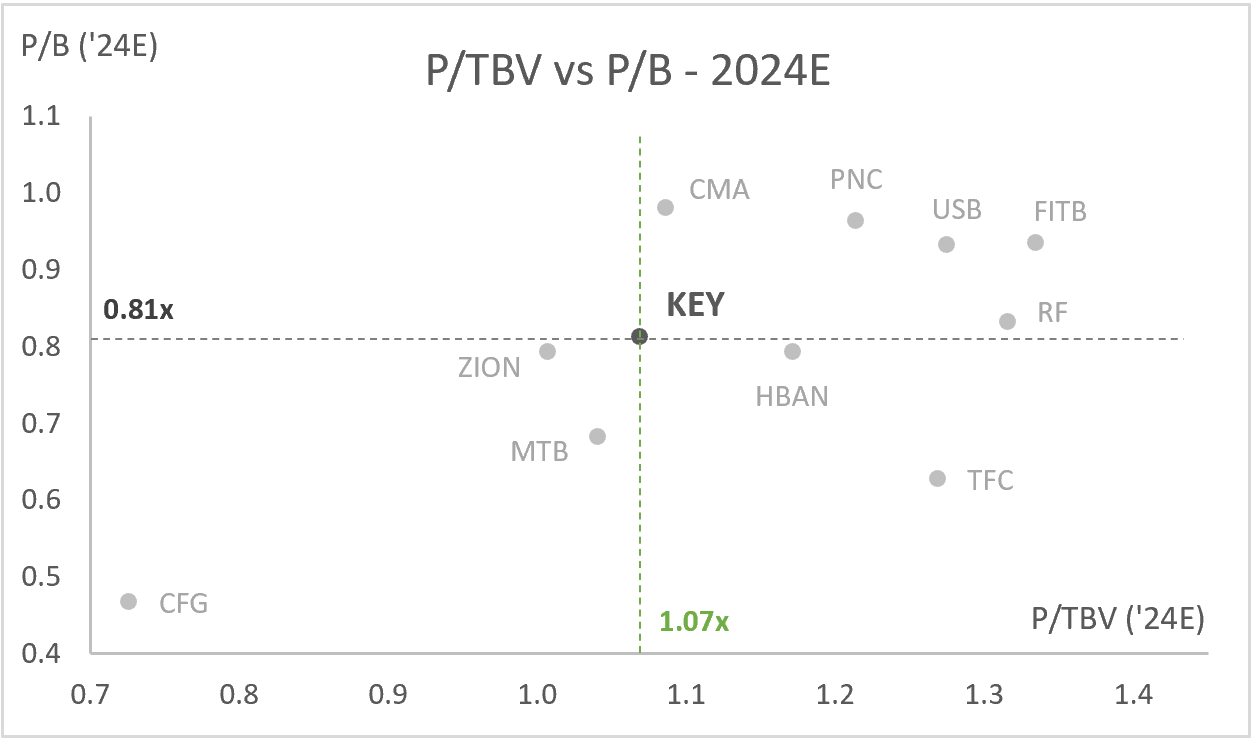
Side note: KEY’s book values are “artificially” compressed due to significant unrealized losses in AFS investments, as discussed earlier, similar to most of its peers.
Verdict
Based on our comprehensive analysis of KeyCorp, examining both standalone performance and peer comparison, and considering past and projected data, we suggest the following estimated multiple ranges for setting a 2024 price target for the bank:
P/E 24E: 9.0x-12.0x
P/S 24E: 1.8x-2.25x
P/TBV 24E: 1.25x-1.50x
P/B 24E: 1.00x-1.25x
In our final valuation chart, we apply each multiple range to today’s share price to determine a fair price range for each metric. Ultimately, we suggest a share price target of $13.50, representing a potential upside of 37% from today’s price.
Analysis by: MacroDozer | Data Sources: MacroDozer & Koyfin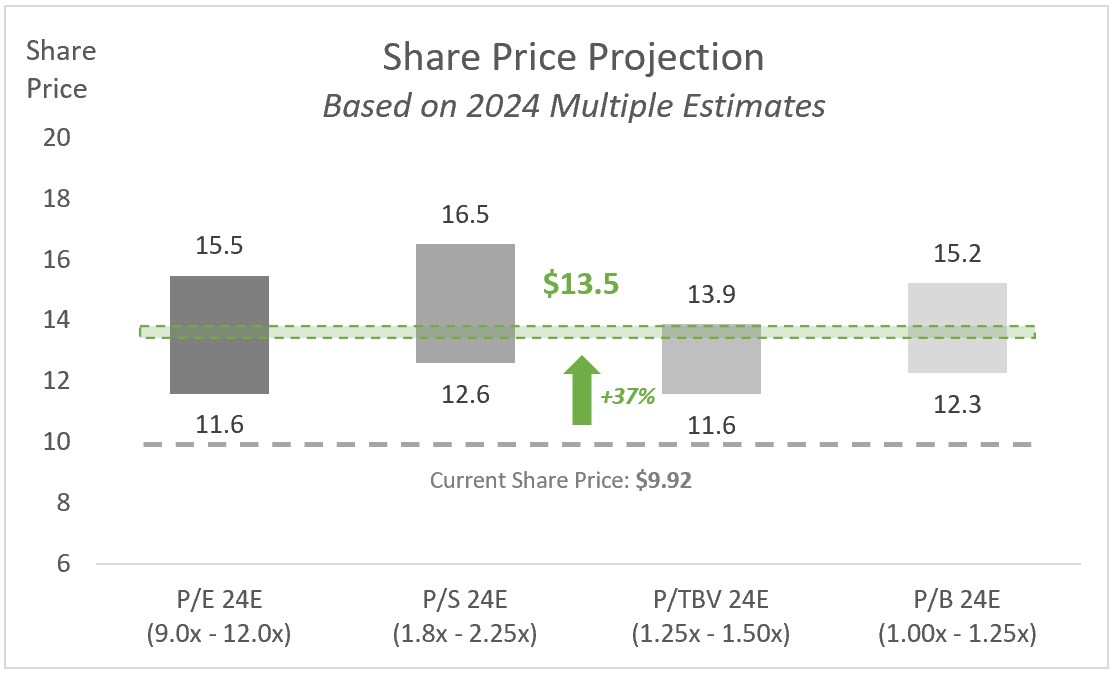
Risk Assessment and Probability Rationale
Our risk assessment of KeyCorp includes various factors that could affect the bank’s financial results, focusing on interest rate volatility, exposure to the real estate market, credit quality, regulatory changes, and general economic challenges.
Interest rate volatility is a moderate risk, given KeyCorp’s historical interest income patterns and asset valuation responses to various interest rate scenarios. The bank’s exposure to commercial real estate, evaluated based on current market and economic trends, presents risks amplified by economic downturns. At the same time, the credit quality of the loan portfolio is reviewed, taking into account the bank’s historical performance in the various credit cycles and the strict underwriting guidelines, as well as the potential increase in non-performing loans in the event of economic stress.
Changes in the regulatory environment are also considered in our model, as they may impact operating costs or capital requirements. We have also incorporated economic forecasts to assess the impact of global tensions and political changes on KeyCorp’s various businesses.
Probability Allocations
We’ve assigned a 75% probability of a favourable outcome for KeyCorp, supported by its historical performance, targeted growth strategies, and effective risk management. Digital initiatives and analytics, alongside a significant dividend yield, are expected to bolster the bank’s resilience against market swings.
Conversely, we acknowledge a 25% likelihood of a pessimistic scenario where KeyCorp faces a significant impact on its profitability and share price due to the convergence of the discussed risks.
Doomsday Share Price Projection
Our “doomsday” scenario for KeyCorp, visualized in the chart below, taking cues from historic lows during the 2020 COVID-19 market downturn, suggests a possible 25% decline in share price to $7.50, based on conservative multiples drawn from that period’s market behaviour.
Analysis by: MacroDozer | Data Sources: MacroDozer & Koyfin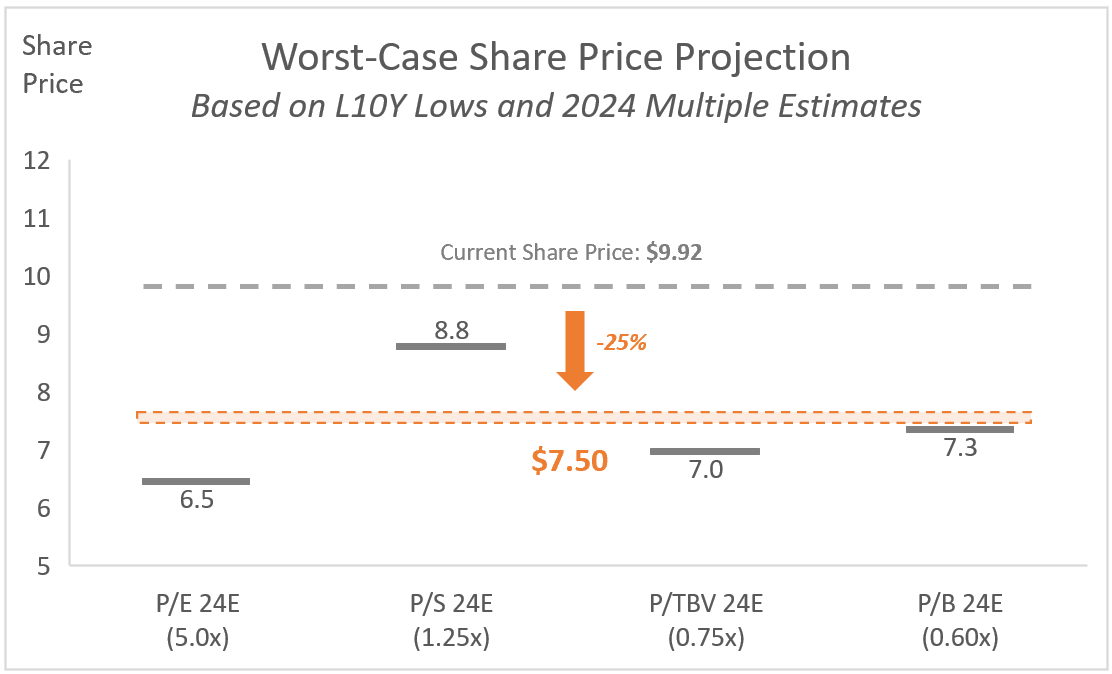
Expected Return Calculation
The expected return is calculated using a weighted probability approach, combining the outcomes of both positive and negative scenarios. The potential for a 38% gain in an optimistic case aligns with KeyCorp’s undervaluation and market positioning, while the 26% possible loss in a pessimistic case accounts for the identified risk factors. The calculation yields an overall expected return as follows:
ER = (38% Gain * 75% Weight) + (-26% Loss * 25% Weight) = 22%
We like to visualize when possible; the waterfall chart below shows a more intuitive approach.
MacroDozer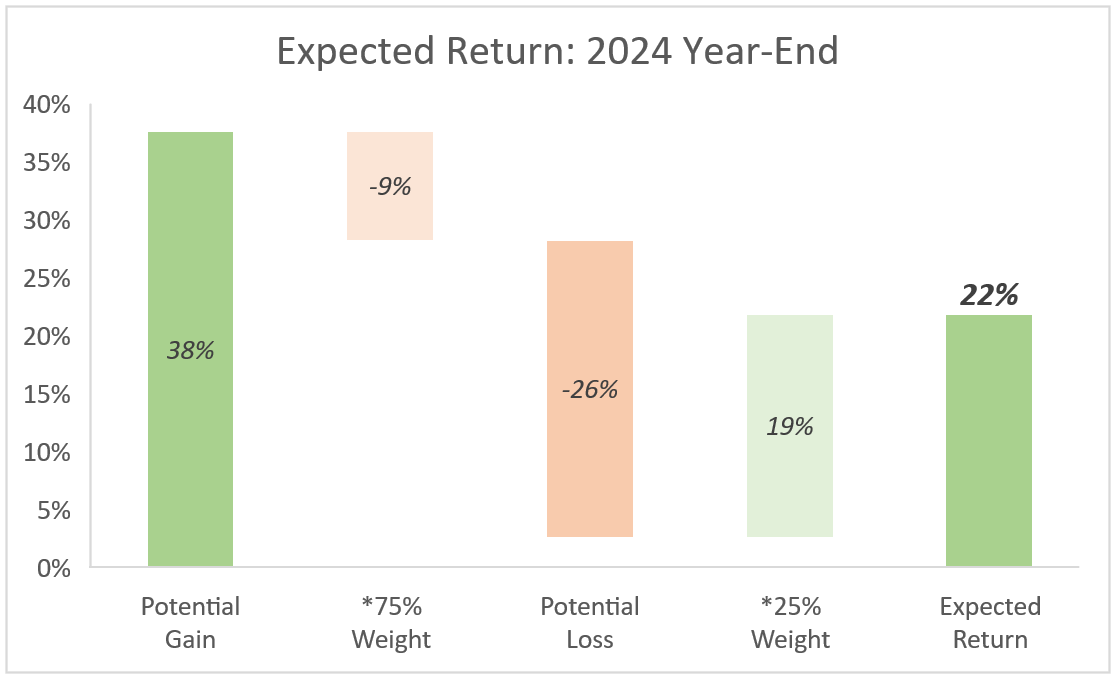
Conclusion
KeyCorp presents a solid investment opportunity, focusing on profitable sectors like healthcare and renewable energy and investing in tech and data analytics. Its financial stability is evident through growing loans and controlled bad debts. Despite some income pressures and temporary investment losses, KeyCorp offers an attractive dividend yield and appears undervalued, indicating the potential for a higher valuation. While aware of risks like interest rates and regulation changes, its expected return of 22% makes it a solid, well-balanced investment option.
Read the full article here