My recent article on Altria Group, Inc. (MO) received mostly positive feedback from readers, who liked being able to compare the company’s progress in a few key dividend related metrics over the last 7 years. I don’t have as much history covering Lockheed Martin Corporation (NYSE:LMT) as I do with Altria Group, which can be an added benefit in this case since it helps longer term comparison.
My last LMT coverage on Seeking Alpha as in 2014, reviewing the company’s then 12th consecutive annual dividend increase. Since then,
- LMT has increased dividends for 8 more years, bringing its streak to 20 consecutive years.
- The dividend has exactly doubled in this time frame, going from $1.50/quarter to $3.00/quarter.
- The lowest dividend increase in this span (in terms of %) was the most recent 7.15% increase in 2022.
- The lowest dividend increase in this span (in terms of $) was 15 cents increase in 2015.
- Looking at the chart below and the two bullets above, it is obvious that while the dividend keeps getting bigger in terms of $, the increase as percentage has and should drop down as expected.
LMT Dividend Growth (Author, with data from Seeking Alpha)
But the larger question is, how strong is LMT’s dividend coverage today compared to almost a decade ago? To find that out, let’s use the same format used in the 2014 article.
Current Dividend and Yield
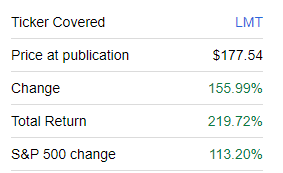
The current annual dividend of $12.00 per share gives LMT investors a current yield of 2.64%. While this is slightly lower than the 3.40% during my 2014 review, I attribute this primarily to the stock’s strong outperformance as shown below. The slowing dividend growth rate has also contributed undoubtedly but to a much lesser extent.
LMT since 2014 (Seekingalpha.com)
Payout Ratio (Based on Earnings Per Share)
Based on LMT’s forward earnings estimate of about $27, the stock has a forward payout ratio of 44%, which compares favorably to the 50% in 2014 based on 2015’s forward EPS.
Payout Ratio (Based on Free Cash Flow)
My analysis and writing styles have both evolved over the years, hopefully for the better. I’ve started using Free Cash Flow (“FCF”) as my primary metric to evaluate dividend coverage due to the flakiness that can be attributed to EPS. Let’s see how strong LMT’s dividend coverage is using FCF metric:
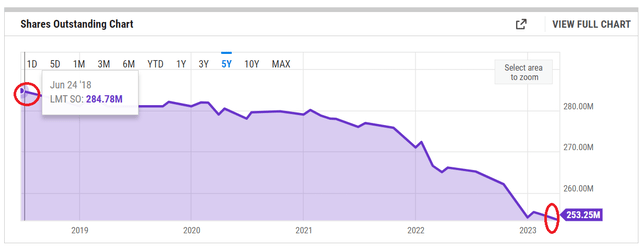
- Total shares outstanding: 253.25 million.
- Current quarterly dividend: $1.50/share.
- Quarterly FCF required to cover dividends: $379.87 million.
- LMT’s average Quarterly FCF over the last 5 years: $1.439 billion.
- Payout ratio using average Quarterly FCF over the last 5 years: 26.40% (that is, $379.87 million divided by $1.439 billion). That’s one of the most impressive dividend coverages I’ve seen, especially for a company that has been increasing dividends for 20 years now.
- So strong is LMT’s dividend coverage based on FCF that only 8 quarters dating back to 2010 have generated FCF lesser than the company’s current quarterly dividend commitment of $379 million.
Dividend Growth Rate [DGR]
This is the only area in the article that should be of concern to dividend investors, as the 5-year dividend growth rate average has fallen to 10.63% from 19.16% in 2014. In addition, the trend is clear in the table below, with each year’s increase being progressively lower than the previous.
LMT DGR (Compiled by author with data from Seeking Alpha)
Cash on Hand
LMT’s cash on hand has fallen from $3.44 billion in 2014 to 2.44 right now. I’ve stopped paying much attention to this metric over the years given the low interest rate environment we had till recently. Even in the current environment, this number may not matter much for companies like LMT with their strong ability to generate continuous cash flow.
Buyback
This is another area that LMT has been getting better at over the years. Shares count has been on a continuous decline irrespective of the time frame you are looking at:
- 10% reduction in the last 5 years.
- 20% reduction since 2014.
- 36% reduction since 2009.
As I’ve stated before, meaningful reduction in shares count has double benefit for shareholders of companies that pay dividends. Not only do buybacks enhance EPS, but also save money every single quarter as the retired shares do not demand/expect their quarterly dividend with wide eyes like we silly investors do.
LMT Shares (YCharts.com)
Extrapolation
I had stated this in my 2014 article: “Even though LMT has been very impressive in its dividend growth so far, one cannot expect the same super growth going forward.” And boy was I right? The dividend growth rate keeps falling each year, and that is to be expected. The last 6 increases have been by 20 cents each/quarter. Should LMT stick with the same pattern this year, investors can expect the new dividend to be $1.70/qtr when the company declares its new dividend in September.
However, let’s assume a paltry 5%/yr increase on average per year over the next 5 years. The yield on cost should go up respectably for someone buying here.
LMT Extrapolation (Author)
Conclusion
Although this article is about LMT’s dividend and how it gets progressively stronger despite (expected) reduced dividend growth rate, let’s take a quick look at the stock’s outlook.
-
I am far from an expert in the defense industry, but I know how to study the financials. I can say with confidence that in the World we live in, defense spending and needs (perceived or real) is unlikely to ever fall meaningfully enough to concern LMT investors, especially if you are careful to not overpay for your shares.
- At a forward multiple of 17, LMT stock is trading below its 5-year average of ~20. When you factor in the expected earnings growth rate of nearly 11%, the stock’s Price-Earnings/Growth (“PEG”) multiple is an attractive 1.50. As I’ve stated before, it is very hard to find many stocks with a Peter Lynch-esque PEG of 1 or below these days. I’ll settle for a PEG of 1.50 on strong companies with excellent dividend coverage.
- These factors have not gone unnoticed, as analysts have a median price target that is almost 30% higher than the current market price.
To conclude, I expect LMT’s dividend growth rate to slow down over the years, but the actual dividend is more than likely to keep investors happy due to the size of it. LMT’s dividend is aging like a fine wine.
Read the full article here


