

We’re over three-quarters of the way through the Q1 Earnings Season for the Gold Miners Index (GDX) and one of the first companies to report its results was Lundin Gold (OTCQX:LUGDF). We previously covered Lundin Gold in April 2023. Not only did the company report record quarterly production in Q1 and trounce its previous quarterly record by ~18,000 ounces, but it paid down its gold prepay facility of $208 million in the period and still ended the quarter with one of the strongest balance sheets among its peer group with ~$210 million in cash. Meanwhile, the company’s margins came at some of the best levels sector-wide, with AISC margins of $1,308/oz placing it among the highest-margin assets globally, including Fosterville, Olimpiada, and Blagodatnoye. Let’s take a closer look at the Q1 results below:
Q1 Production & Sales
Lundin Gold (“Lundin”) released its Q1 results earlier this month, reporting quarterly production of ~140,000 ounces of gold, a record for the company. This represented ~31.1% of its annual production guidance midpoint, and record sales volumes of ~134,700 ounces, Lundin’s quarterly revenue also hit a record of $256.7 million. The incredible performance in Q1 was driven by solely high-grade feed hitting the mill with its low-grade stockpiles exhausted and the benefit of high grade material not in the plan that led to even higher processed grades. And while daily throughput rates were slightly below plan at 4,359 tonnes per day, this was more than offset by an average head grade of 12.3 grams per tonne of gold, and better recoveries because of an ore blending strategy that led to improved flotation recoveries.
Lundin Gold – Tonnes Mine, Tonnes Processed & Head Grade (Company Filings, Author’s Chart)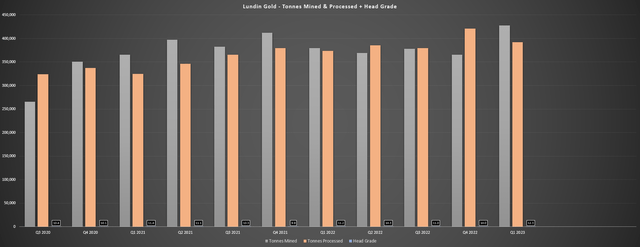
As the chart above shows, Q1 head grades were the best on record since Fruta Del Norte went into commercial production in 2020 and well above the average reserve grade of 8.7 grams per tonne of gold in the 2022 reserve update and the 9.7 gram per tonne head grade guided at the beginning of the year. Given that there was no change to guidance, and the company reiterated in the period that grades will decline as the year progresses even if throughput notches up to ~4,400 tonnes per day with the completion of the relining of the SAG and ball mills in Q1, this suggests that production will normalize and head back below 120,000 ounces per quarter for the remaining quarters of the year unless there are some positive surprises from a grade reconciliation standpoint. Hence, while Lundin looks set to smash guidance from the Q1 results, coming in at high end looks more likely (~475,000 ounces).
Meanwhile, from a financial standpoint, Lundin Gold may have reported negative free cash flow of ~$11 million in the period (Q1 2022: ~$92 million), but this was related to ~$129 million in interest and finance charges based on the extinguishment of the gold prepay facility. So, if we adjust for this one-time item, free cash flow actually came in higher year-over-year at ~$117 million, helped by a higher average realized gold price ($1,952/oz), higher sales volumes, and limited cost creep vs. last year’s levels, making Lundin Gold unique in this aspect vs. peers that have struggled with considerable inflationary pressures. Finally, operating cash flow came in at $144.4 million, also a record for the company relative to $127.3 million in the year-ago period.
Lundin Gold – Operating Cash Flow, Free Cash Flow, Cash Position (Company Filings, Author’s Chart)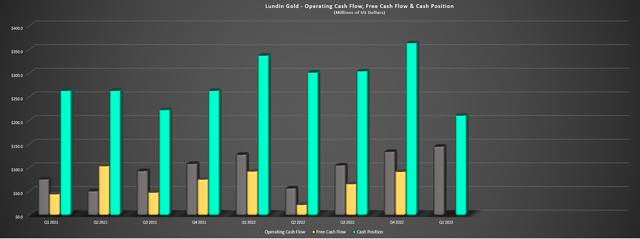
Costs & Margins
Looking at Lundin Gold’s costs and margins, its results were phenomenal, with all-in sustaining costs [AISC] coming in ~45% below the estimated Q1 industry average at $728/oz, and cash costs coming in at $644/oz. And while these unit costs were up marginally on a year-over-year basis from $696/oz and $619/oz, respectively, these costs continue to be among the best sector-wide. Given the help from a rising gold price and one of the strongest average realized gold prices sector-wide ($1,952/oz), Lundin Gold’s AISC margins came in at $1,308/oz, a record for the company and one of the best AISC margin figures sector-wide, among Fosterville, Olimpiada, and Blagodatnoye. And despite tough comps because of inflationary pressures experienced from Q1 2022 to Q1 2023 in areas like fuel and some consumables, Lundin’s AISC margins were up over 12% year-over-year.
Lundin Gold – Quarterly Production & All-in Sustaining Costs + Forward Cost Trend (Company Filings, Author’s Chart, Implied Cost Trend From Guidance)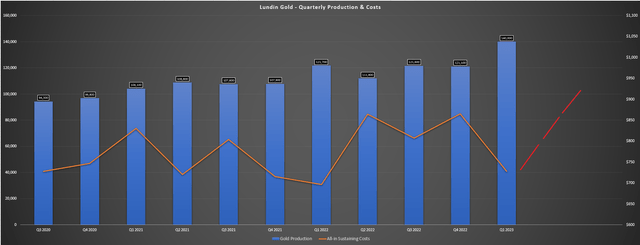
However, while all-in sustaining costs came in 20% below its guidance mid-point of $905/oz for FY2023, these costs will rise materially as the year progresses, with sustaining capital tracking at just ~14.4% of the guidance mid-point. The company noted that sustaining capital will ramp up throughout the year and will be spent on the fourth tailings dam raise (Q2 through Q4), a new sewage treatment plant facility, and an underground mine maintenance facility, among other items. At the same time, we should see higher throughput combined with 20% lower grades, resulting in much lower production levels. Hence, I wouldn’t be surprised to see all-in sustaining costs come in closer to $900/oz in Q2 and Q3, more than offsetting the higher gold price, resulting in margin compression sequentially.
Lundin Gold – All-in Sustaining Costs & AISC Margins (Company Filings, Author’s Chart)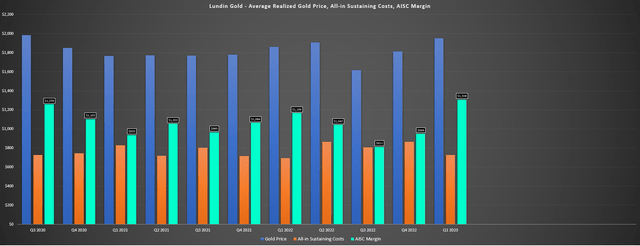
That said, while we will see some margin compression, Lundin Gold is still a cash-flow machine and the company continues to report some of the best margins sector-wide. So, this is not a case of a high-cost miner seeing margin compression and struggling to generate any cash flow, but simply a case of some normalization in grades that will translate to lower margins in the coming quarters. To summarize, this is not a bearish argument by any means, it’s only a reminder that the Q1 results were abnormally strong, which is the opposite of many other miners that will see margins improve as the year progresses, which, in my view, provides a more favorable reward/risk setup.
Valuation & Technical Picture
Based on ~242 million fully diluted shares and a share price of US$12.80, Lundin Gold trades at a market cap of ~$3.1 billion and an enterprise value of US$3.4 billion. This makes Lundin Gold one of the highest-valued single-asset gold producer in the sector by a wide margin, with double the market cap of Torex Gold (OTCPK:TORXF) and Centamin (OTCPK:CELTF), and its market cap is now within ~$1.4 billion of Evolution Mining (OTCPK:CAHPF), a larger producer that operates out of solely Tier-1 jurisdictions (Australia, Canada). And while Lundin Gold deserves to trade at a premium, given that its Fruta Del Norte Mine is arguably one of the top-10 best gold assets globally (with significant exploration upside) I am surprised that the company hasn’t used its highly valued currency to look at M&A to shed its single-asset producer status, with some producers and high-grade developers trading at attractive valuations.
LUGDF – 6-Month Chart (StockCharts.com)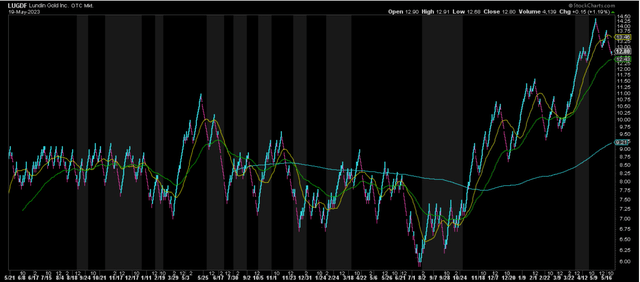
Using what I believe to be a fair multiple of 1.1x P/NAV given Lundin’s strong resource growth and reserve replacement and an estimated net asset value of ~$2.85 billion, I see a fair value for the stock of ~$3.20 billion or US$13.20. This points to limited upside from current levels, and the stock certainly doesn’t have any margin of safety baked in at current levels. So, unless one is banking on a major discovery or significantly higher gold prices, I don’t see any way to justify paying up for the stock above US$13.00. In fact, if I were long the stock, I would use any rallies above US$14.15 as an opportunity to book more profits. This view is reinforced by the technical picture, which shows that the stock has enjoyed a near-parabolic advance since October and is vulnerable to a deeper correction.
Summary
Lundin Gold came out of the gate much stronger than its peer group in Q1, and while many other producers expect to see production and costs steadily improve as the year progresses, Lundin’s best quarter is now out of the way early, with lower production and much higher costs expected in Q2 through Q4. And while investors can look forward to attractive shareholder returns with a minimum of $0.40 in annualized dividends this year, I don’t think the current dividend justifies paying up for the stock at current levels. Hence, I continue to see far more attractive opportunities elsewhere in the sector, and I see a high probability of the stock creating a double top if it were to rally back to its May 10th highs before July.
Editor’s Note: This article discusses one or more securities that do not trade on a major U.S. exchange. Please be aware of the risks associated with these stocks.
Read the full article here