


Investment Thesis
My colleague at the Hoya Capital Investing Group, Retired Investor, recently performed in-depth coverage of the Franklin U.S. Low Volatility High Dividend Index ETF (NASDAQ:LVHD), concluding that it was a better choice than its closest competitor, the Invesco S&P 500 High Dividend Low Volatility ETF (SPHD). I don’t dispute this conclusion because LVHD does better balancing the volatility and yield factors and has a better track record. However, we still can choose neither. That was my position in November 2022, and LVHD has underperformed the SPDR S&P 500 Trust ETF (SPY) by approximately 9% since. SPHD has done even worse.
Seeking Alpha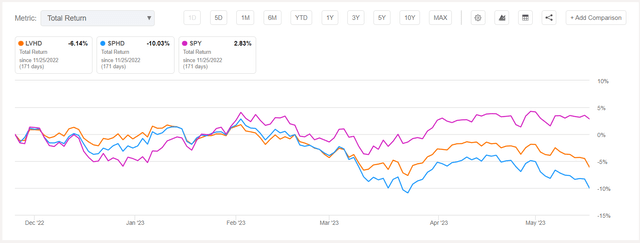
Instead, today’s article aims to evaluate whether LVHD is even needed in the first place. I believe it’s not. As I will demonstrate, investors can select a well-rounded ETF like the Schwab U.S. Dividend Equity (SCHD), get much of the yield and downside protection LVHD offers without sacrificing growth and profitability, and then make slight adjustments with other factor ETFs to suit their preferences. This multi-factor, low-fee approach is more appropriate for long-term investors, and I look forward to taking you through my findings in more detail below.
LVHD Overview
Strategy Discussion
LVHD tracks the QS Low Volatility High Dividend Index, selecting 50-100 companies from the Solactive U.S. Broad Market Index that can pay relatively high and sustainable dividends. The methodology is proprietary, but additional points are below, sourced from LVHD’s website.
- Selected constituents are scored based on the attractiveness of their price and earnings volatility
- Only the highest-scoring securities are selected, subject to limits, including a 2.5% and 25% security and sector cap (15% for REITs)
- The Index reconstitutes annually and rebalances quarterly
Note how both earnings and price stability are the key screens. As a result, stable businesses, particularly in the Utilities sector, are advantaged. In contrast, companies with less stable earnings patterns in the Technology sector are disadvantaged. This approach helps investors diversify away from broad-based market-cap-weighted ETFs like SPY, especially since high-yielding securities (with lower market caps) are preferred.
Sector Exposures and Top Ten Holdings
The following table highlights sector exposures for SPY, SPHD, and LVHD. I’ve also included the Schwab U.S. Dividend Equity ETF for comparison purposes. While you might consider SCHD in a different category, it has one thing going for it that helps it in market downturns: high profitability. We’ll see that later in my fundamental analysis of the four ETFs.
Morningstar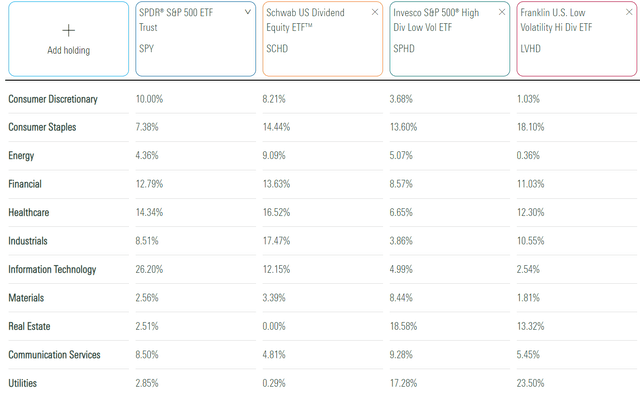
As mentioned, LVHD overweights Utilities (23.50%) and underweights Technology (2.54%). It also leans into Consumer Staples (18.10%), resulting in a category-leading 0.72 five-year beta. SPHD is more balanced, with a much higher 0.82 beta. Meanwhile, SCHD is the outlier. It excludes REITs and virtually excludes Utilities, which is the key reason for LVHD’s low beta. I’ve written recently about how I’ve changed my view on the sector lately. I predicted it would outperform in 2022, but there are good reasons to believe the opposite will occur moving forward. Feel free to read why in my Q1 2023 earnings season recap here.
LVHD’s top ten holdings are below. Due to the 2.5% cap on individual securities, it only covers 25% of the portfolio. PepsiCo (PEP), Coca-Cola (KO), and The Southern Company (SO) are above the limit because of relatively strong performance since the last rebalancing.
Franklin Templeton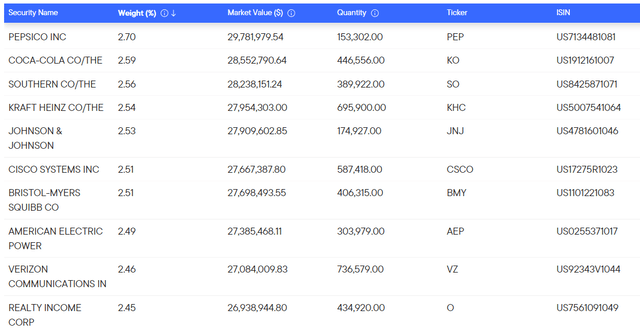
Performance Analysis
Only a handful of ETFs combine the low volatility and high yield factors, so it’s understandable how investors can feel trapped with either LVHD or SPHD. Here are three others with trailing dividend yields above 3% and five-year betas below 0.85:
- Global X Super Dividend U.S. ETF (DIV)
- VanEck Morningstar Durable Dividend ETF (DURA)
- SPDR SSGA US Small Cap Low Volatility Index ETF (SMLV)
DURA is an exciting but little-known alternative. I covered it in January, recommending it over both LVHD and SPHD, and it’s outperformed since. The reason is superior quality.
Seeking Alpha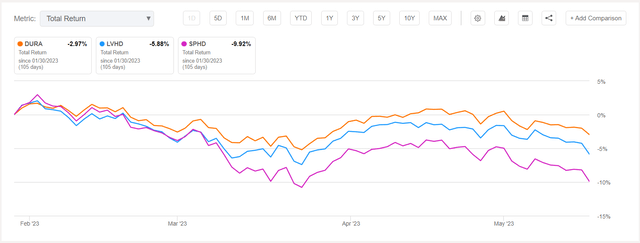
Since SMLV focuses only on small caps, DIV is the only other choice. Here is how it has performed against LVHD and SPHD since December 2015.
Seeking Alpha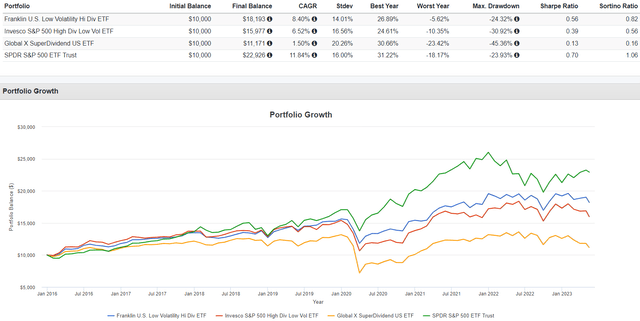
LVHD’s 8.40% annualized return was superior to SPHD and DIV but still lagged SPY by 3.44%. LVHD’s worst year was in 2018, losing 5.62%, but even that wasn’t enough to make up for several underperforming years (2017, 2019, 2020, 2023). Unless you follow markets closely and can reasonably predict when you need low-volatility ETFs’ downside protection, they aren’t good buys.
LVHD Fundamentals
The following table highlights selected fundamental metrics for LVHD’s top 25 holdings. I’ve also included summary metrics for SPHD, SCHD, and SPY in the final rows to illustrate the key differences between the four ETFs.
The Sunday Investor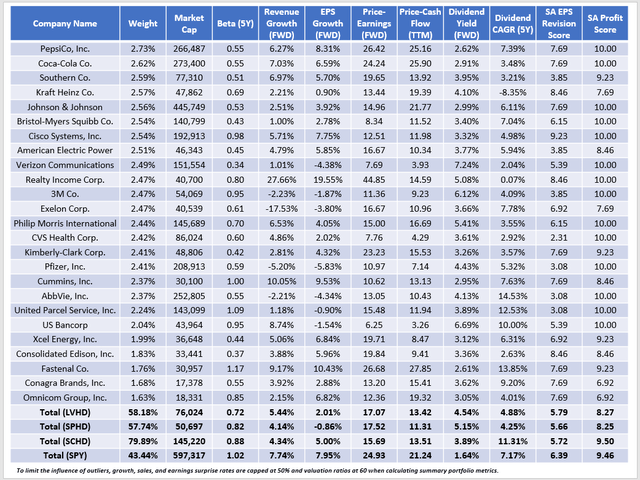
I mentioned earlier how LVHD does a better job balancing the volatility and yield factors than SPHD, and that’s evident in this table. LVHD’s five-year beta is the lowest at 0.72, and constituents yield 4.54% (4.27% after fees). Meanwhile, SPHD’s 0.82 beta is hardly a differentiator anymore but has a 5.15% gross yield (4.85% net). The trailing yield figures for the two are different, but they don’t reflect the latest reconstitutions and price declines, so these are the most accurate figures for today’s buyer.
What’s not advertised is LVHD’s 2.01% weak estimated earnings growth rate. Although better than SPHD, whose holdings are declining, it’s 6% and 3% less than SPY and SCHD. In addition, LVHD’s 8.27/10 profitability score is only average for the category, a disappointing feature for long-term investors.
A commenter on my colleague’s review questioned why an investor would choose LVHD over SCHD. Based on these fundamentals, I wonder the same. SCHD is also less volatile than the market, albeit not as much as LVHD. However, its low 0.06% expense ratio means its net 3.83% dividend yield is still strong. Furthermore, its constituents have grown dividends at a faster rate over the last five years (11.31% vs. 4.88%), its superior profitability score indicates it can handle market turbulence easier, and its higher growth rate suggests it has more capacity to raise dividends and produce more considerable capital gains moving forward. SCHD is the clear winner based on fundamentals alone.
Investment Recommendation
LVHD tracks an Index that selects stocks based on dividend yield and earnings volatility. It’s one of a handful of funds combining these two factors, so given the limited choice, you may have already settled on LVHD. However, I think that’s a mistake. These funds typically score well on these two factors by sacrificing other important metrics like growth, valuation, and profitability. Instead, I suggest a more well-rounded ETF like SCHD. If you need more downside protection, consider adding the iShares MSCI USA Min Vol Factor ETF (USMV), recommended here. If it’s yield you’re seeking, adding a small position in a covered-call fund or even risk-free U.S. Treasuries might be sufficient. Just don’t assume you need a low-volatility/high-dividend ETF like LVHD. There are plenty of other choices in the ETF space, and if you’re looking for recommendations based on the metrics discussed today, I hope you’ll let me know in the comments section below. Thank you for reading.
Read the full article here