

For the second quarter, the Madison Dividend Income Fund (Class Y) returned -4.1%, which compared to the S&P 500, Russell 1000 Value, and Lipper Equity Income peer group returns of +4.3%, -2.2% and -0.4%, respectively.
On a year-to-date basis, the Fund returned -0.5%, which compared to the S&P 500, Russell 1000 Value, and Lipper Equity Income peer group returns of +15.3%, +6.6%, and +7.5%, respectively.
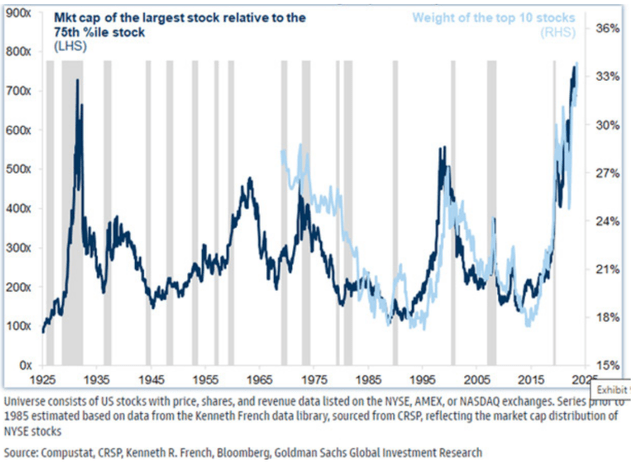
After outperforming all three benchmarks in 2022, the past six quarters since the beginning of 2023 have been a challenging relative performance period for the Fund. We believe it has been an unusual period marked by extreme concentration among the largest companies in the U.S. stock market combined with the lowest percentage of stocks outperforming since the late 1990s. As shown in the graphs below, the top ten largest stocks in the market now represent 37% of the S&P 500, which is the highest weight in the index since 1929.
Exhibit 1: Extreme Concentration Among the Top 10 Largest Stocks
| Performance data shown represents past performance. Investment returns and principal value will fluctuate, so that fund shares, when redeemed, may be worth more or less than the original cost. Past performance does not guarantee future results and current performance may be lower or higher than the performance data shown. Visit Madison Funds or call 800.877.6089 to obtain performance data current to the most recent month-end. |
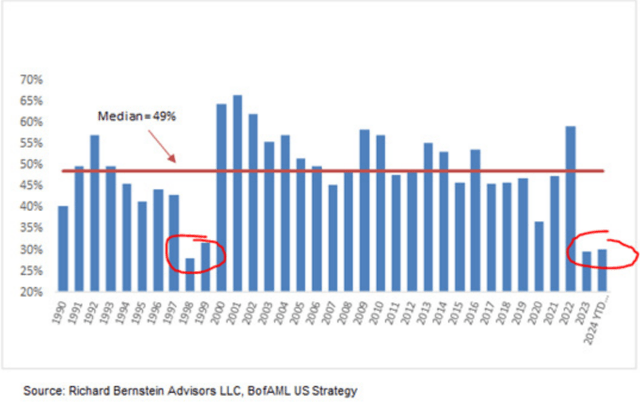
At the same time, the number of stocks outperforming the S&P 500 has only been between 25-28%, which is far below the median percentage of 49% over the last 35 years and the lowest level since 1998 and 1999.
Exhibit 2: Percentage of Stocks Outperforming the S&P 500
1990-2024 YTD thru 6.04.24 (Price Returns)
It has been a strong market rally since the start of 2023, led by a narrow group of Technology and Communication Service stocks (including Amazon (AMZN) and Tesla (TSLA), which are technically classified as Consumer Discretionary stocks) as market participants have grown increasingly excited about prospects related to Artificial Intelligence. This excitement can be observed and quantified by looking at valuations for these companies. What is notable to us is that valuations have significantly expanded in these areas of the market in a short period. Bloomberg shows the following valuation metrics for the Technology sector ending 6/30/2024:
Exhibit 3: S&P 500 Technology Sector Valuations
|
Current |
2-year average |
% change |
|
|
Last 12-month Price-to-Earnings ratio |
41.9x |
31.2x |
34% |
|
Last 12-month Price-to-Book Value ratio |
13.1x |
9.9x |
32% |
|
Last 12-month Price-to-Cash Flow ratio |
32.8x |
24x |
37% |
|
Last 12-month Price-to-Sales ratio |
9.8x |
6.7x |
46% |
Source: Bloomberg
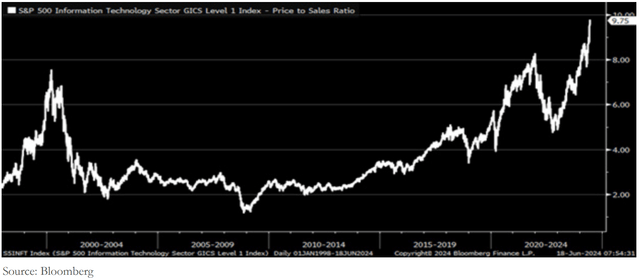
Looking back further, it becomes apparent how much Technology sector valuations have expanded in the past five, ten and fifteen years. The graph below shows the price-to-sales ratio for the Technology sector over the last three decades. The current price-to-sales of 9.75x has doubled since mid-2022, is up from 4x in 2020, and up from 2x in 2011, meaning the Technology price-to-sales ratio has expanded five-fold since then! We believe these valuations have reached extreme levels and there are growing risks that valuations will contract in the future. Mean reversion happens regularly in markets, and the proverbial rubber band feels stretched extremely far in one direction.
Exhibit 4: Historical Price-to-Sales Ratio for the Technology Sector
While Technology sector and related stock valuations have significantly expanded, valuations for dividend-paying stocks have contracted during the past six quarters. Our preferred valuation metric is looking at the relative yield of dividend stocks compared to the S&P 500. Relative yield is defined as a stock or portfolio dividend yield divided by the index dividend yield, and a high relative yield ratio indicates a low valuation for the stock or portfolio. Looking at the data, the relative yield of the Fund was 2.20x the S&P 500 at quarter end compared to 1.66x at the end of 2022, which is a 32% higher relative yield and the highest level since we’ve been managing the fund and going back 25 years. It appears to us that market participants have been buying Technology and related stocks and selling dividend-paying stocks the last six quarters. We believe this presents a historically attractive opportunity to own high-quality, above-average dividend stocks.
The Dividend Opportunity Hidden In Plain Sight
The Madison Dividend Income Fund is a conservatively managed equity strategy that owns a high-quality portfolio of above-average dividend yield stocks with strong balance sheets and sustainable competitive advantages (wide moats). We believe that owning high-quality stocks with above-average dividend yields is the best way to provide income and generate attractive long-term returns over a full market cycle while limiting drawdowns in bear markets and market corrections.
While the Fund has trailed the indices cumulatively for the past six quarters, valuations have now reached historically cheap levels compared to the broad market including the S&P 500 and Russell 1000 Value indices. Our view is that this provides a generational opportunity to own a high-quality portfolio of dividend stocks with attractive characteristics, including:
- An absolute dividend yield of 2.9%
- Relative dividend yields of 2.20x and 1.33x vs. the S&P 500 and Russell 1000 Value indices, respectively. Both relative yield ratios are at the highest levels going back at least 25 years.
- A growing income stream that protects against inflation. Portfolio holdings have increased their dividends by nearly 8% on average over the past year, which is well above inflation rates over that time. Consistent annual dividend increases are a key metric we require in portfolio holdings.
- A high-quality portfolio with strong balance sheets that could protect on the downside in a market correction. Using Standard & Poor’s credit ratings to assess financial strength, 89% of fund holdings are rated A- or better, which compares favorably to the S&P 500 at 32% and the Russell 1000 Value at 20%. If there is a down market and/or credit spreads begin to widen, we believe our high-quality portfolio is likely to hold up much better than the overall market.
As mentioned above, mean-reversion happens regularly in markets. The last time there was significant dividend stock underperformance was the late 1990s, which has some similarities to the current environment, including extreme market concentration and a low percentage of stocks outperforming. In the late 1990’s example, the relative performance of dividend stocks improved dramatically over the subsequent 1-, 3-, and 5-year periods. With extreme valuations in large, non-dividend paying stocks and cheap valuations in many dividend stocks, we think a similar outcome is possible this time too.
Sincerely,
John Brown, CFA & Drew Justman, CFA
|
Disclosures “Madison” and/or “Madison Investments” is the unifying tradename of Madison Investment Holdings, Inc., Madison Asset Management, LLC (“MAM”), and Madison Investment Advisors, LLC (“MIA”). MAM and MIA are registered as investment advisers with the U.S. Securities and Exchange Commission. Madison Funds are distributed by MFD Distributor, LLC. MFD Distributor, LLC is registered with the U.S. Securities and Exchange Commission as a broker-dealer and is a member firm of the Financial Industry Regulatory Authority. The home office for each firm listed above is 550 Science Drive, Madison, WI 53711. Madison’s toll-free number is 800-767-0300. Any performance data shown represents past performance. Past performance is no guarantee of future results. Non-deposit investment products are not federally insured, involve investment risk, may lose value and are not obligations of, or guaranteed by, any financial institution. Investment returns and principal value will fluctuate. This report is for informational purposes only and is not intended as an offer or solicitation with respect to the purchase or sale of any security. Consider the investment objectives, risks, and charges and expenses of Madison Funds carefully before investing. Each fund’s prospectus contains this and other information about the fund. Call 800.877.6089 or visit Madison Funds to obtain a prospectus and read it carefully before investing. Although the information in this report has been obtained from sources that the firm believes to be reliable, we do not guarantee its accuracy, and any such information may be incomplete or condensed. All opinions included in the report constitute the authors’ judgment as of the date of this report and are subject to change without notice. Madison Asset Management, LLC does not provide investment advice directly to shareholders of the Madison Funds. Opinions stated are informational only and should not be taken as investment recommendation or advice of any kind whatsoever (whether impartial or otherwise). Madison Funds are distributed by MFD Distributor, LLC, member FINRA. Madison-571137-2024-07-10 |
Original Post
Editor’s Note: The summary bullets for this article were chosen by Seeking Alpha editors.
Read the full article here