


A guest post by Ovi
The focus of this post is an overview of World oil production, along with a more detailed review of the top 11 Non-OPEC oil producing countries. OPEC production is covered in a separate post.
Below are a number of Crude plus Condensate (C + C) production charts, usually shortened to “oil”, for oil producing countries. The charts are created from data provided by the EIA’s International Energy Statistics and are updated to May 2024. This is the latest and most detailed/complete World Oil production information available. Information from other sources such as OPEC, the STEO and country specific sites such as Brazil, Norway and China is used to provide a short term outlook.
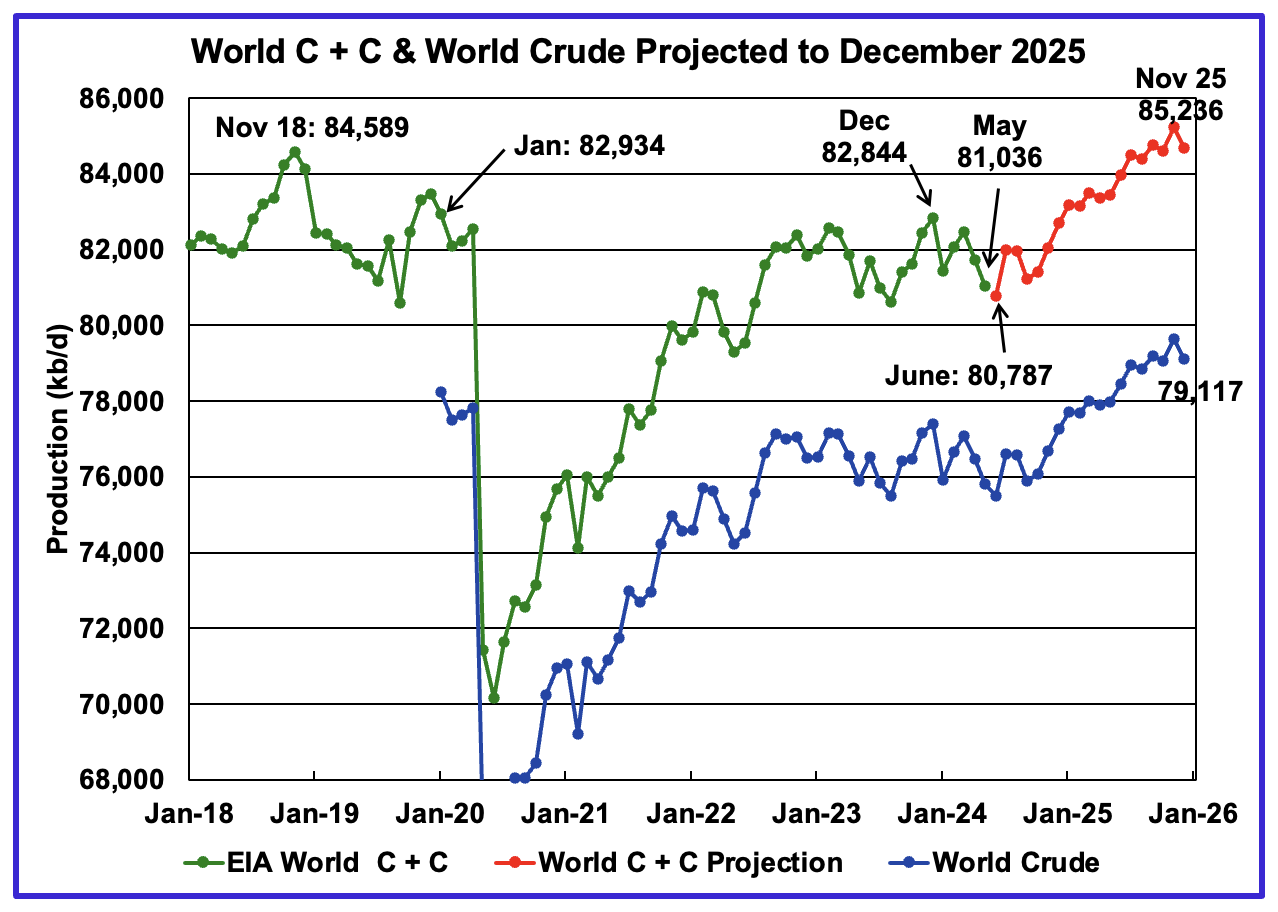
World oil production decreased by 687 kb/d in May to 81,036 kb/d, green graph. The largest decreases came from Canada 259 kb/d, Saudi Arabia 200 kb/d, and Norway 138 kb/d. June’s World oil production is projected to drop by 249 kb/d to 80,787 kb/d.
This chart also projects World C + C production out to December 2025. It uses the September 2024 STEO report along with the International Energy Statistics to make the projection. The red graph forecasts World oil (C+C) production out to December 2025 using the STEO’s September crude oil report.
For December 2025, production is expected to be 84,675 kb/d. It is preceded by a November 2025 peak of 85,236 kb/d. The December 2025 production is 351 kb/d higher than estimated in the previous post.
From June 2024 to December 2025, World oil production is estimated to increase by 3,888 kb/d.
A note of caution. The September STEO is now reporting/forecasting only Crude production, which is also shown in the chart. As a result the red C+C graph is a projection based on the crude production graph.
There is a significant change in the ratio (C + C)/C over the last six months of reported crude oil production relative to the previous six months. The average (C + C)/C ratio for the last 6 months is 0.6% higher than the previous six months. While this is a small difference percentage-wise, it makes a significant change to the December 2025 production projection of close to 400 kb/d. Also, for May, the average has dropped from the previous month. This drop may indicate that this ratio has a seasonal component. The red graph uses the average for last six months of data to make this forecast. This report will now use a fixed latest six month average going forward to try to detect any seasonal variation in the ratio.
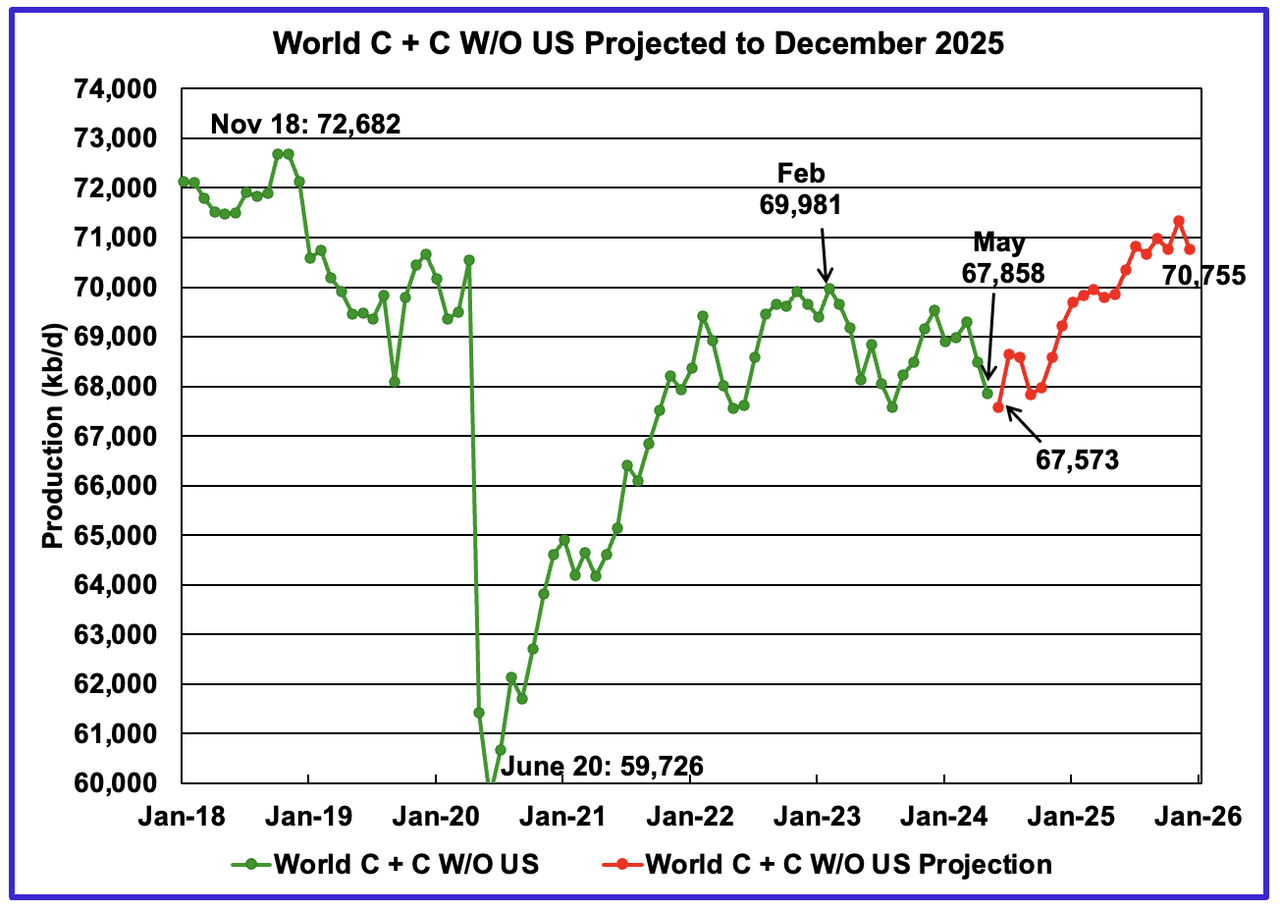
World without US May oil output decreased by 626 kb/d to 67,858 kb/d. June production is expected to drop by 285 kb/d to 67,573 kb/d.
Note that December 2025 output of 70,755 kb/d is 1,927 kb/d lower than the November 2018 peak of 72,682 kb/d. The December 2025 production of 70,755 is also 107 kb/d lower than reported in the previous post.
World oil production W/O the U.S. from June 2024 to December 2025 is forecast to increase by a total of 3,182 kb/d.
A Different Perspective on World Oil Production
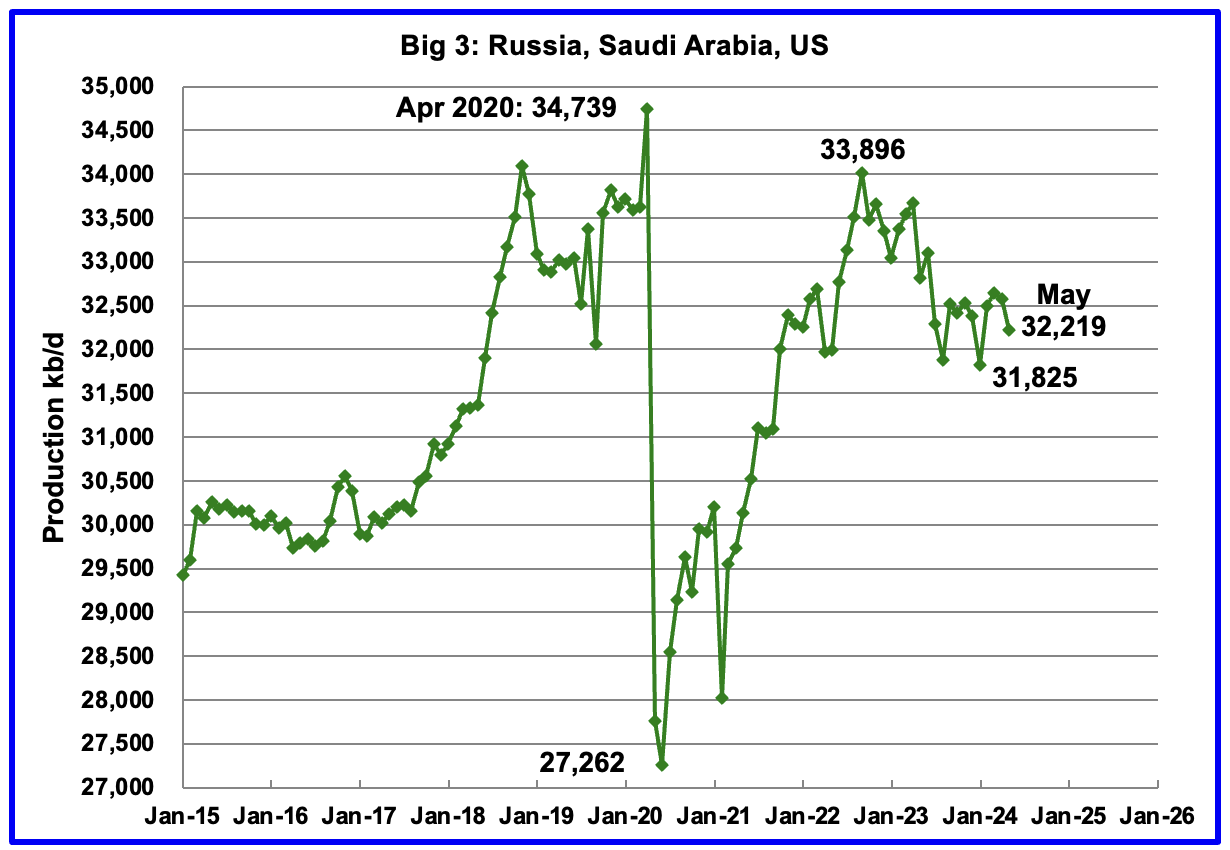
Peak production in the Big 3 occurred in April 2020 at a rate of 34,739 kb/d. The peak was associated with a large production increase from Saudi Arabia. Post covid, production peaked at 33,896 kb/d in September 2022. The production drop since then is primarily due to cutbacks/decline in Russia and Saudi Arabia.
May’s Big 3 oil production decreased by 361 kb/d to 32,219 kb/d. May’s production is 1,677 kb/d lower than the September 2022 post pandemic high of 33,896 kb/d. The countries with the biggest drops were Canada, Norway and Russia.
Adding in the current Saudi Arabia 1,000 kb/d cut would raise production to 33,219 kb/d, just 677 kb/d lower than September 2022 production. Saudi Arabia along with other OPEC + countrieswhich were scheduled to reverse their cuts in October 2024 have now delayed them to December 2024 because of lower Chinese demand.
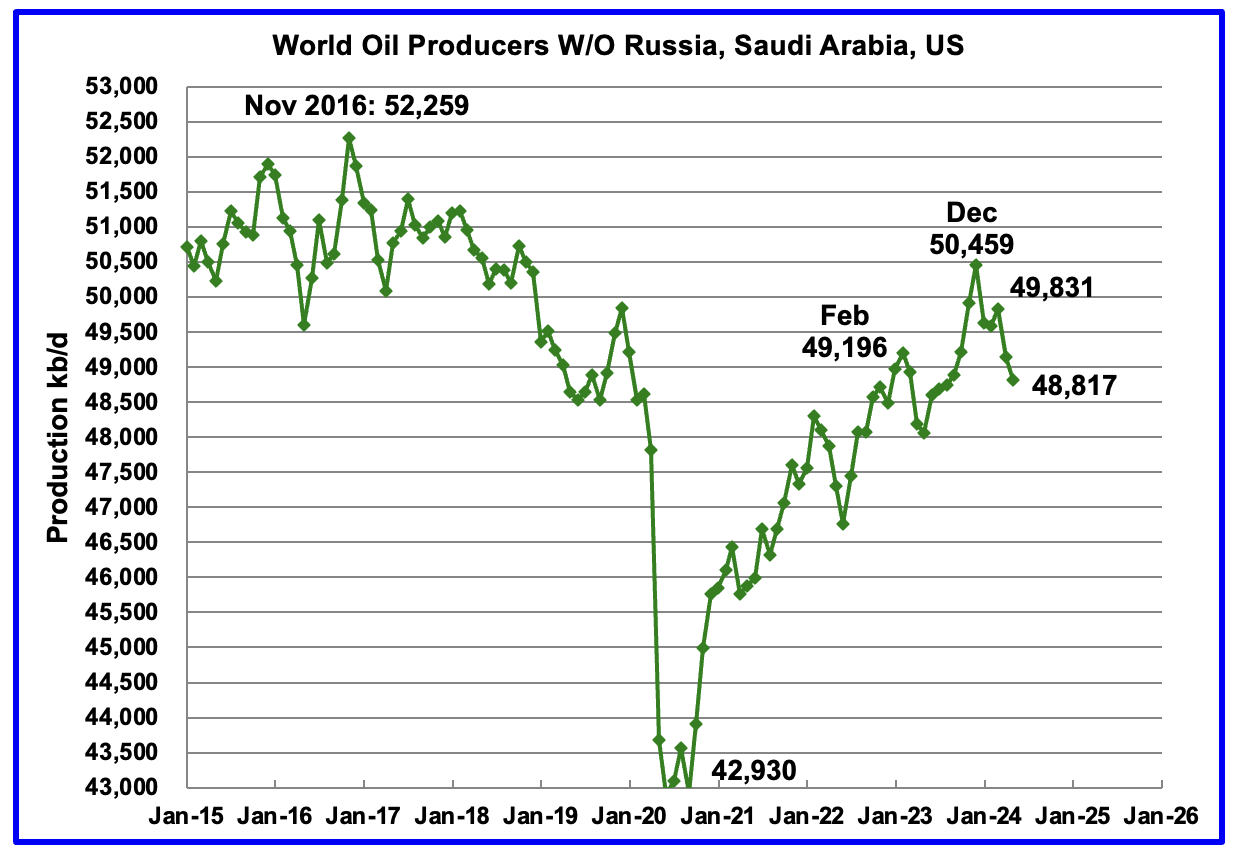
Production in the Remaining Countries had been slowly increasing since the September 2020 low of 42,930 kb/d. Output in December 2023 reached 50,459 kb/d, a new post covid high. However, production began to fall in January 2024. May’s production decreased by an additional 326 kb/d to 48,817 kb/d. Of the 326 kb/d, Canada contributed 259 kb/d. The overall drop from December 2023 is 1,642 kb/d.
Countries Ranked by Oil Production
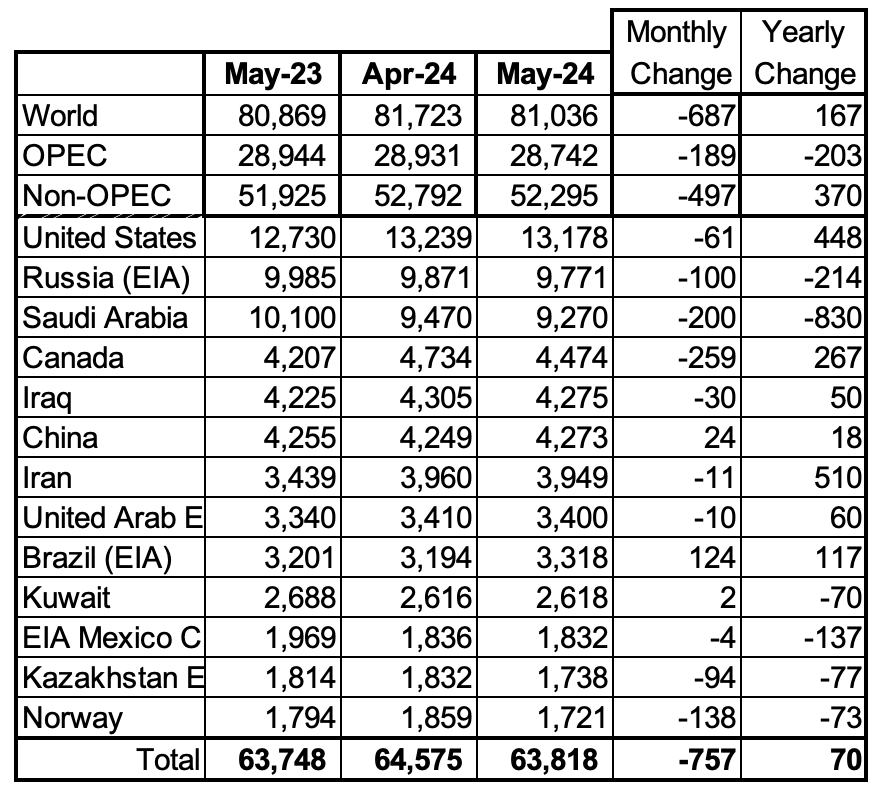
Above are listed the World’s 13th largest oil producing countries. In May 2024, these 13 countries produced 78.7% of the World’s oil. On a MoM basis, production decreased by 757 kb/d in these 13 countries, while on a YOY basis, production rose by 70 kb/d.
Note the large and very similar YoY increase in Iranian and US oil production, 510 kb/d vs 448 kb/d.
May Non-OPEC Oil Production Charts
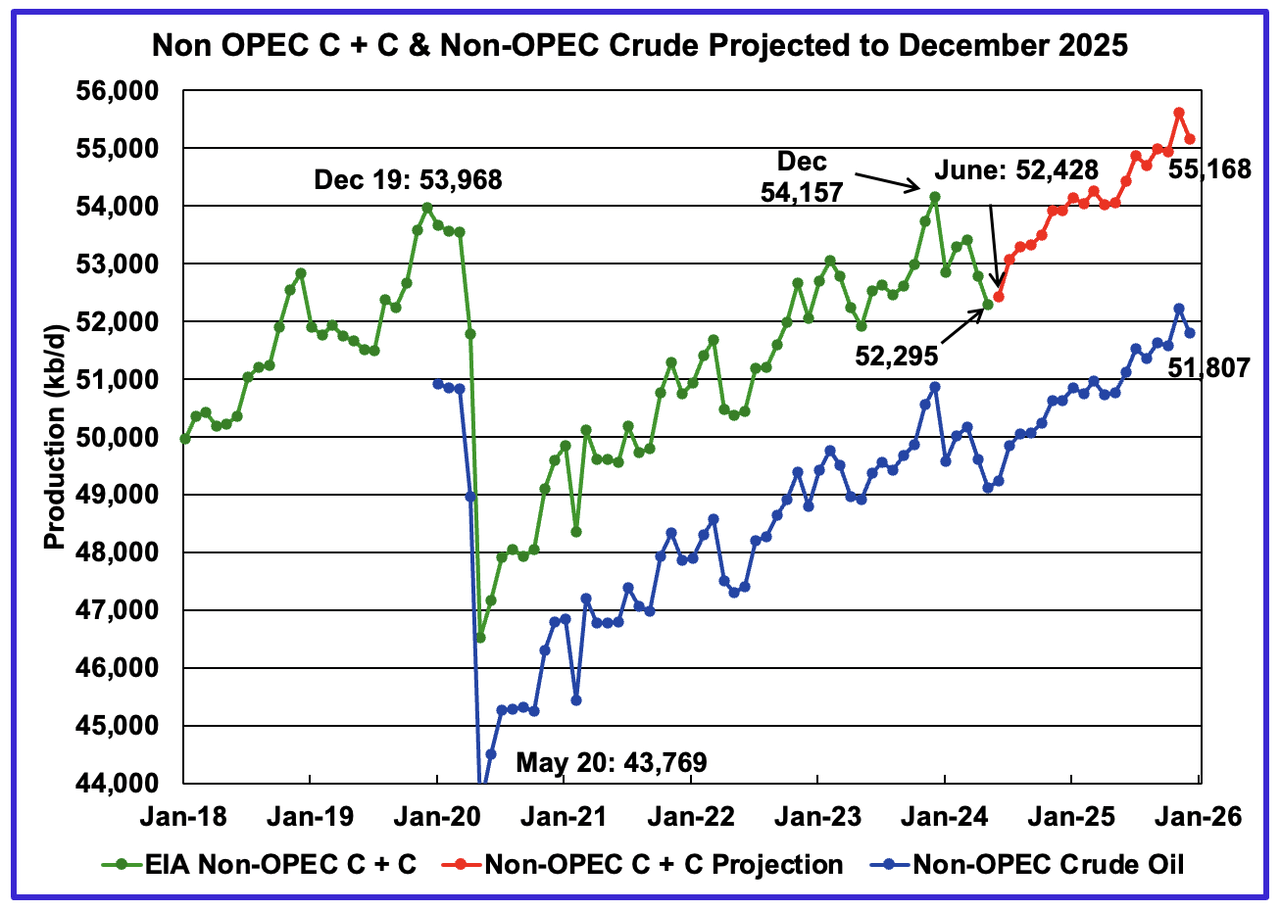
May Non-OPEC oil production decreased by 497 kb/d to 52,295 kb/d. The largest decreases came from Canada and Norway. Note that Non-OPEC production now includes Angola.
Using data from the September 2023 STEO, a projection for Non-OPEC oil output was made for the period June 2024 to December 2025. (Red graph). Output is expected to reach 55,168 kb/d in December 2025, which is 1,200 kb/d higher than the December 2019 peak of 53,968 kb/d.
The same caution as noted in the comments for the World chart above apply to this chart.
From December 2023 to December 2025, oil production in Non-OPEC countries is expected to increase by 1,011 kb/d.
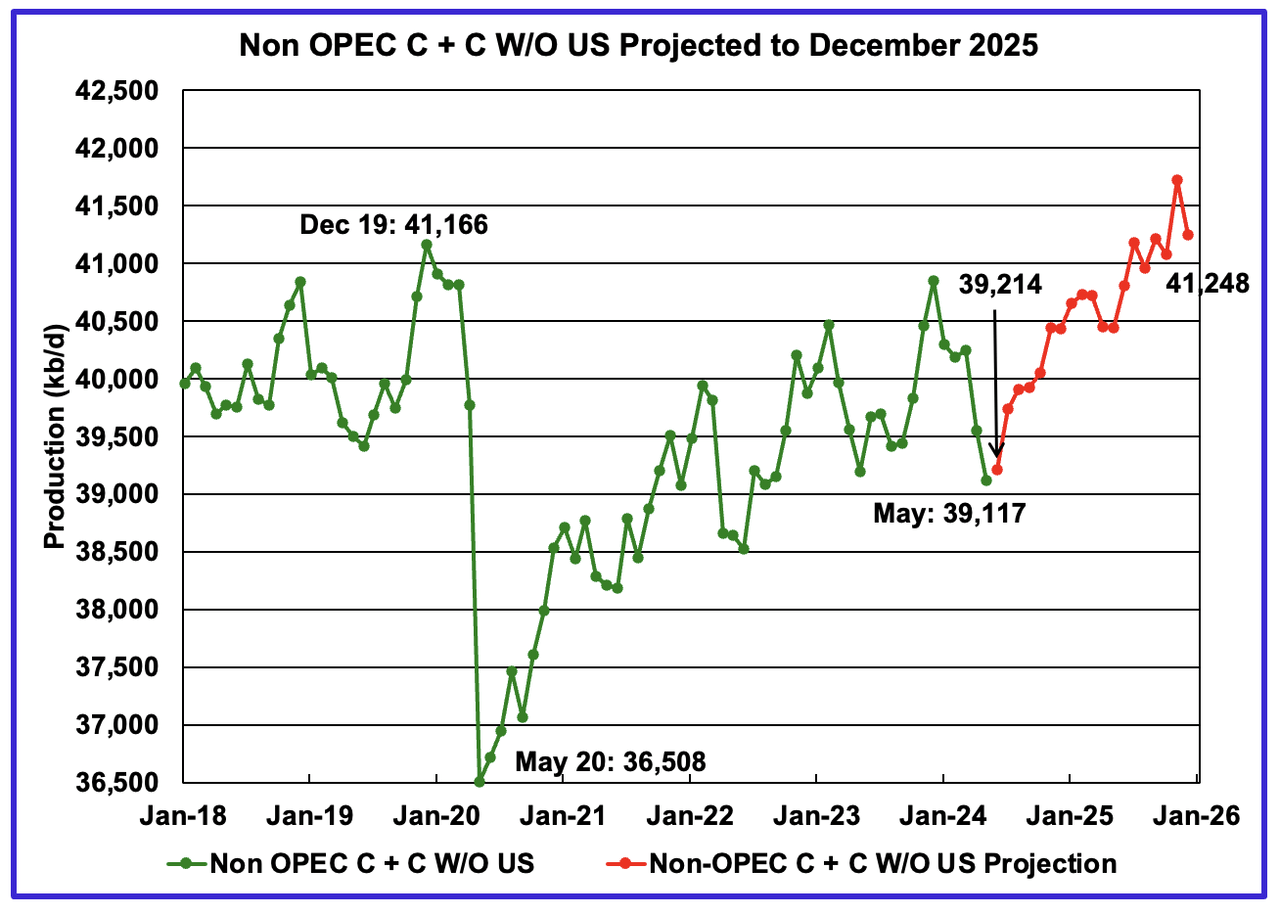
May Non-OPEC W/O US production decreased by 436 kb/d to 39,117 kb/d. June’s production is projected to rise by 97 kb/d to 39,117 kb/d.
From June 2024 to December 2025, production in Non-OPEC countries W/O the US is expected to increase by2,131kb/d. December 2025 production is projected to be 82 kb/d higher than December 2019.
Non-OPEC Oil Countries Ranked by Production
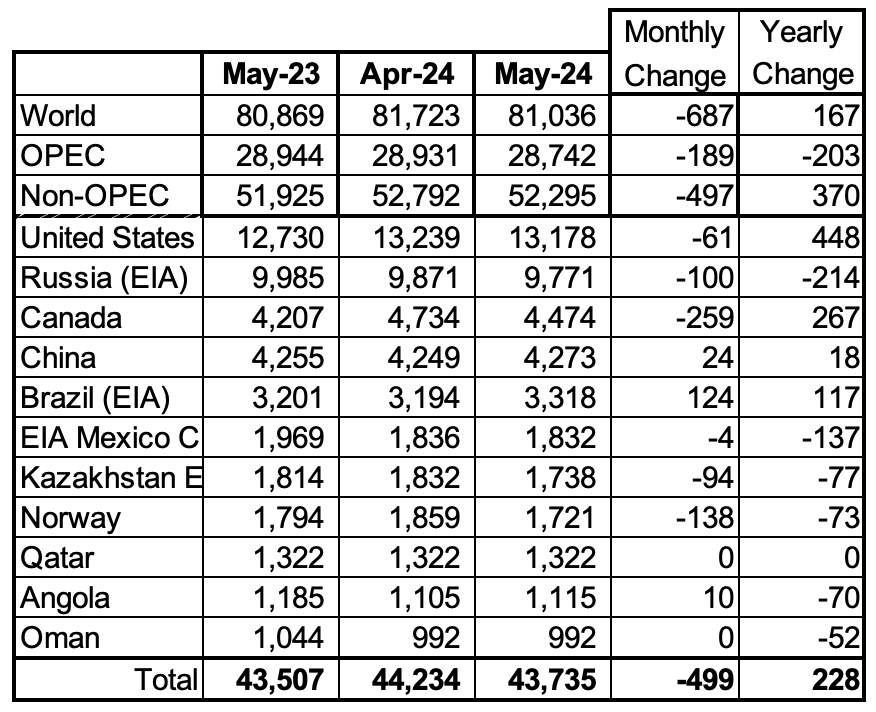
Listed above are the World’s 11 largest Non-OPEC producers. The criteria for inclusion in the table is that all of the countries produce more than 1,000 kb/d. Note that Angola has been added to this table.
May’s production decreased by 499 kb/d to 43,735 kb/d for these eleven non-OPEC countries, while as a whole the Non-OPEC countries saw a monthly production decrease of 497 kb/d.
In May 2024, these 11 countries produced 83.6% of all Non-OPEC oil production.
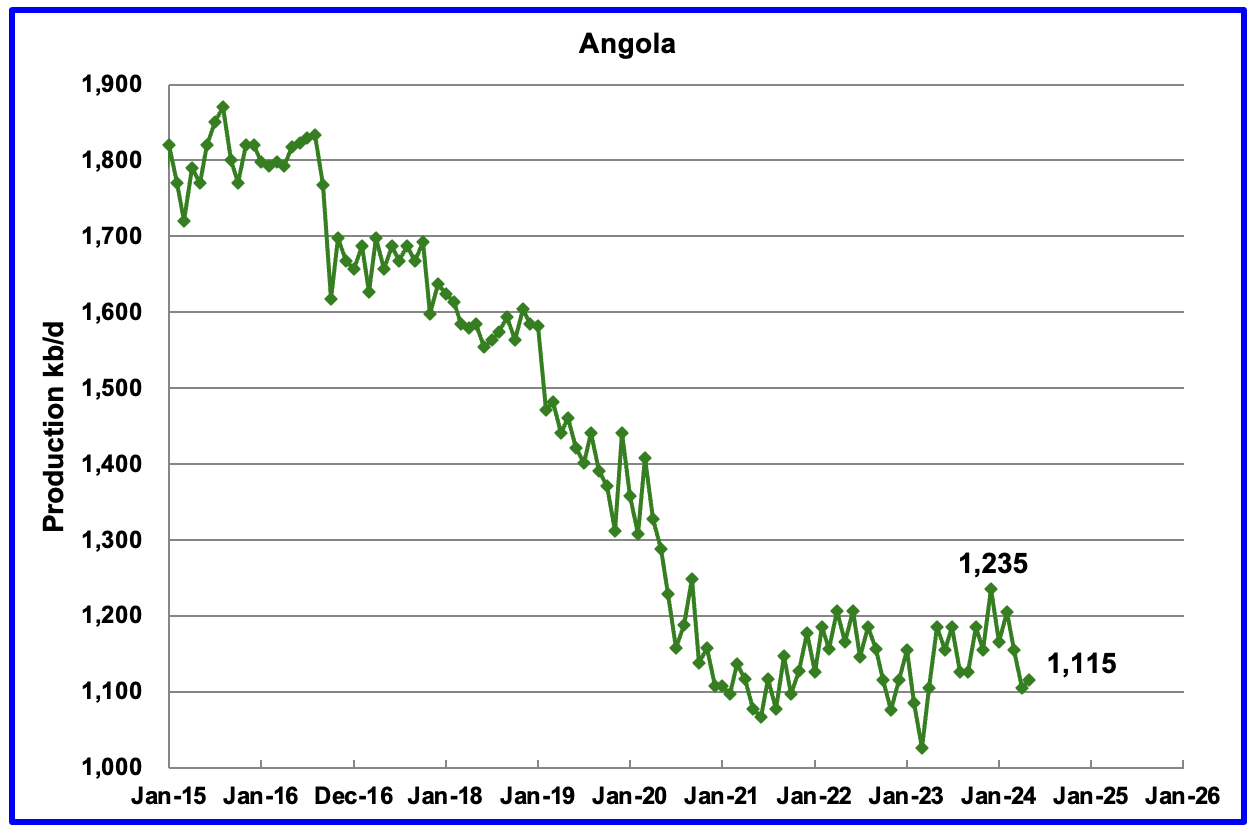
Angola has been added to the Non-OPEC producing countries since they withdrew from OPEC.
Angola’s May production increased by 10 kb/d to 1,115 kb/d. Angola’s production since early 2022 appears to have settled into a plateau phase.
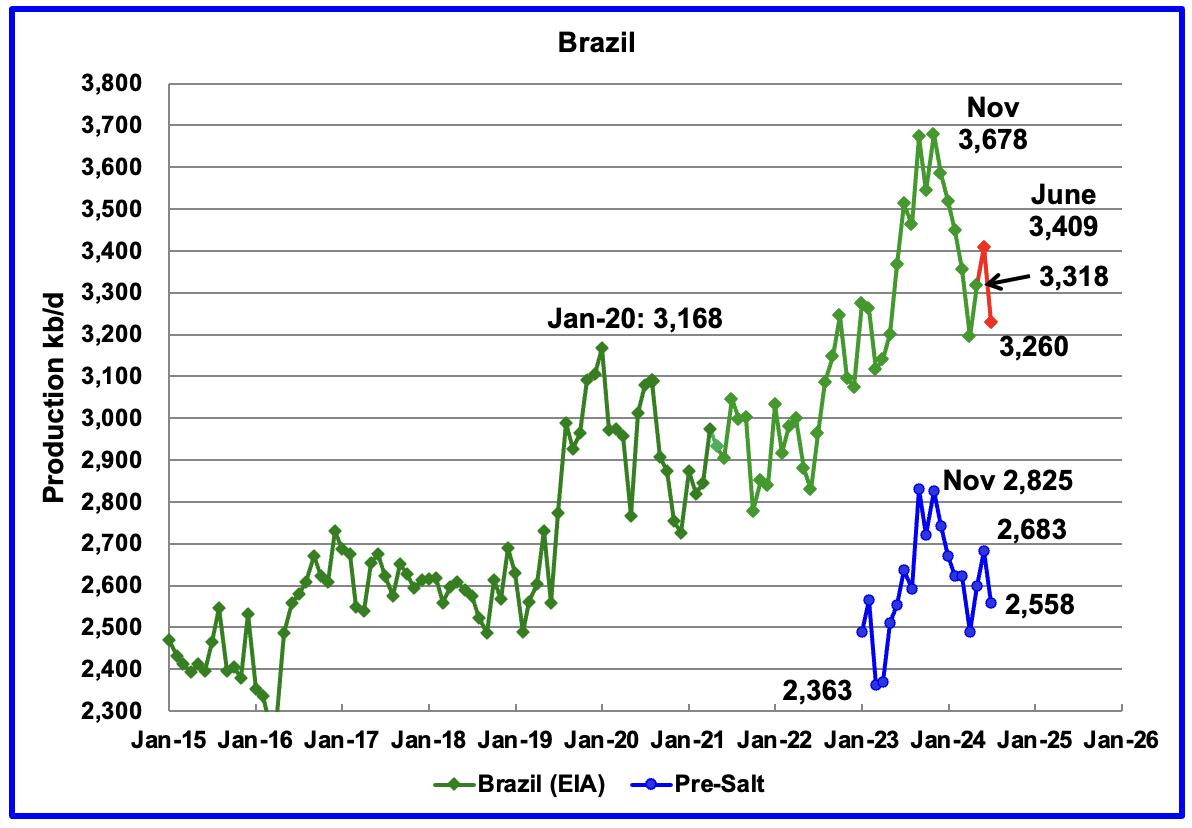
The EIA reported that Brazil’s May production rose by 124 kb/d to 3,318 kb/d.
Brazil’s National Petroleum Association (BNPA) reported that production increased in June by 91 kb/d but had a significant drop in July to 3,260 kb/d. The BNPA has begun reporting Brazil’s pre-salt production again. The August pre-salt report reflects the crude oil pattern. For July, pre-salt production was down by 125 kb/d.
The drop in production up to April was primarily due to extensive maintenance, and production is expected to recover to previous levels going forward. According to OPEC:“The Brazilian state-controlled Petrobras FPSO unit, Maria Quiteria, is expected to start production in 4Q24 – earlier than previously expected – following its deployment at the Parque das Baleias integrated project.
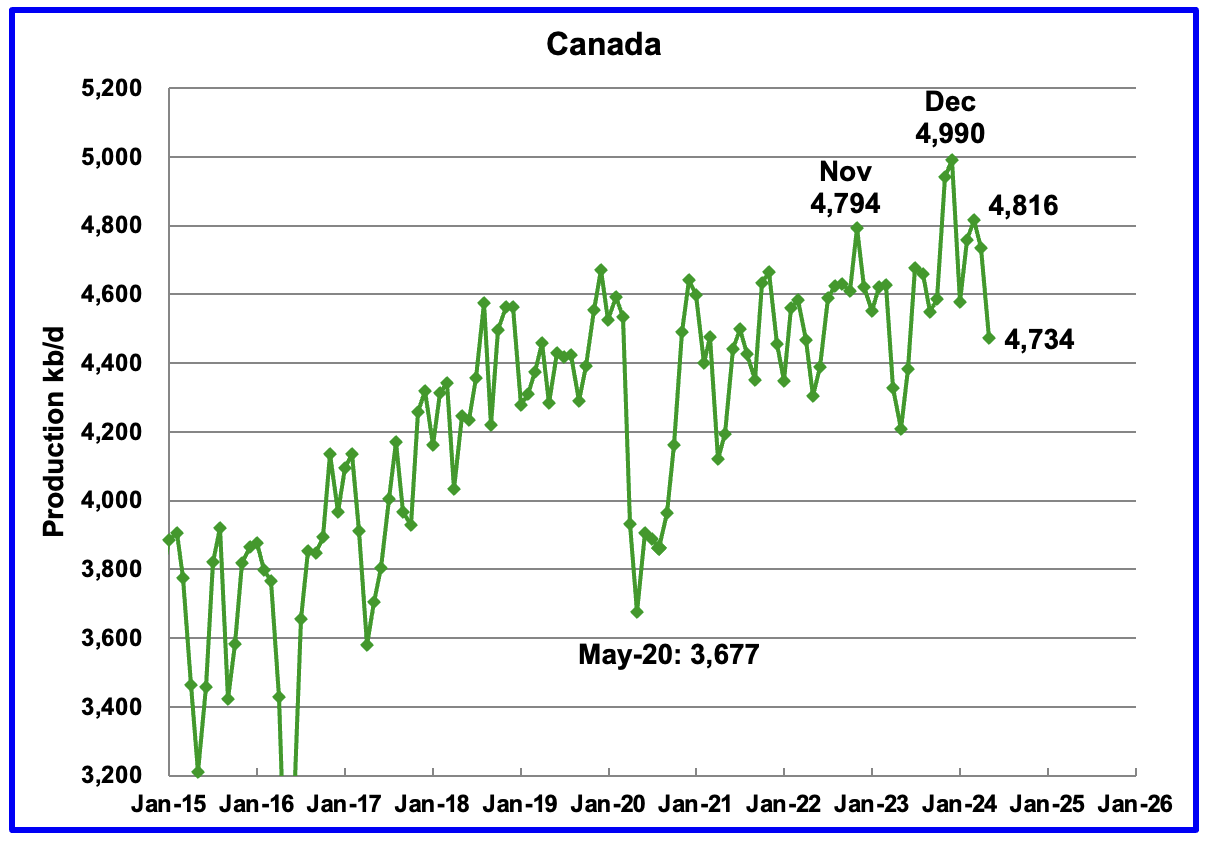
Canada’s production decreased by 259 kb/d in May to 4,474 kb/d. The drop is primarily due to maintenance at oil sands plants.
According to this article, a lot of maintenance was planned for Q2.
“This year the maintenance season is average, union representatives said, and will peak in the second quarter with around 238,000 barrels per day of oil sands production being taken offline.”
According to this article, the TMX pipeline has given Canada the opportunity to compete with Middle East crudes in the China/Asia economy.
“The recently expanded 590,000 b/d Trans Mountain Expansion (TMX) pipeline’s start-up has improved Asian refiners’ access to heavy Canadian crude at a time when supplies of such grades have tightened, PetroChina International’s chief economist Wu Qiunan said.
The TMX pipeline has cut the shipping time to export crude from Canada’s west coast to Asia-Pacific to “only 19 days compared with the US Gulf [coast] which is basically 45 days,” Wu said at the S&P Global Commodity Insights Appec conference in Singapore on 9 September. This “opens a very good option for Asia to receive more from Canada”.
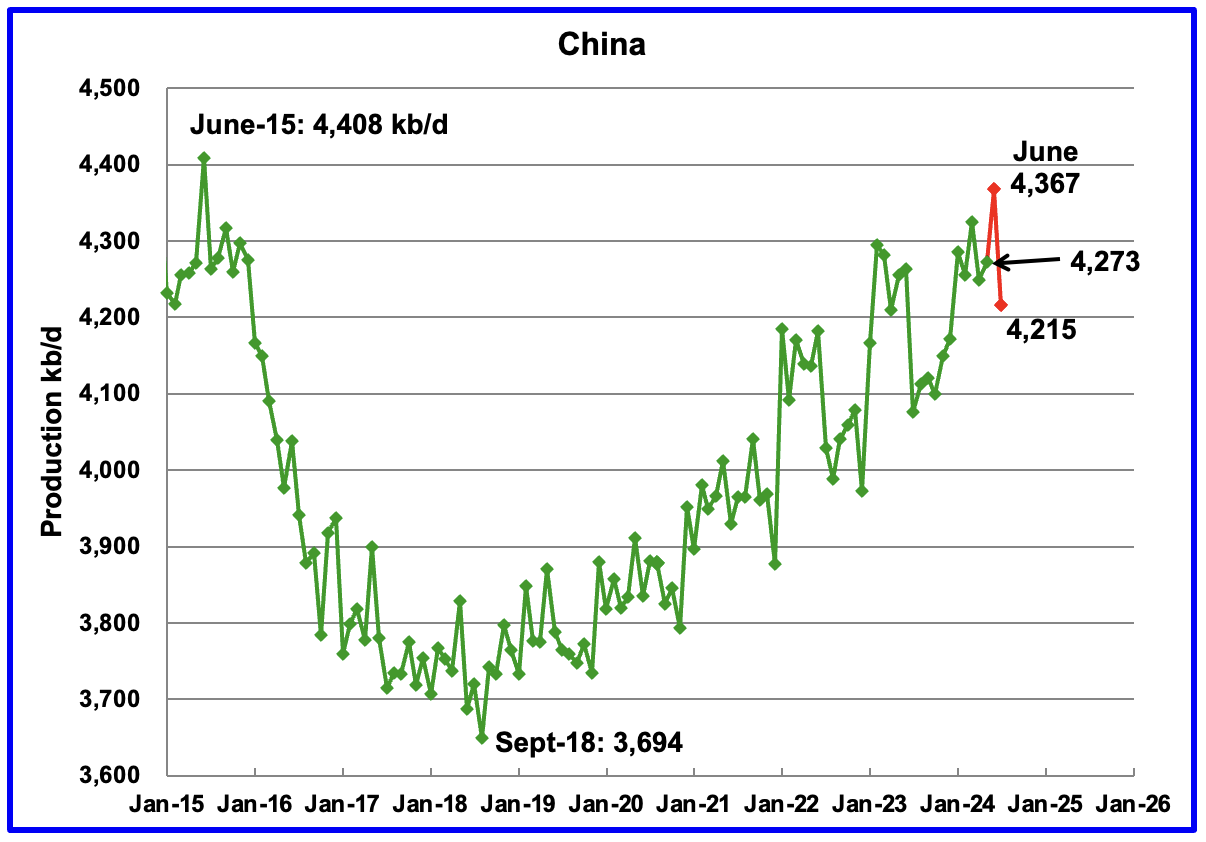
The EIA reported China’s oil output in April increased by 24 kb/d to 4,273 kb/d.
The China National Bureau of Statistics reported production for June and July. June added 94 kb/d to 4,367 kb/d and July dropped by 152 to 4,215 kb/d. June production is just 41 kb/d short of the previous June 2015 high of 4,408 kb/d.
According to OPEC, for 2024 “Natural decline rates are anticipated to be offset by additional growth through more infill wells and EOR projects. Chinese majors are set to maintain high upstream Capex in 2024 to meet the growth requirements stated in the 2019 Seven-Year Exploration and Production Increase Action Plan.”

According to the EIA, Kazakhstan’s oil output decreased by 91 kb/d in May to 1,738 kb/d. Kazakhstan’s recent crude oil production, as reported by Argus, has been added to the chart. In August crude production dropped by 40 kb/d to 1,370 kb/d.
Since January, Kazakhstan crude production has dropped by 240 kb/d to 1,370 kb/d. Their production target is 1,470 kb/d. At 1,370 kb/d, Kazakhstan is exceeding its target by producing 100 kb/d less than is permitted. This lower production is intended to offset those times when they were exceeding their target by over producing.
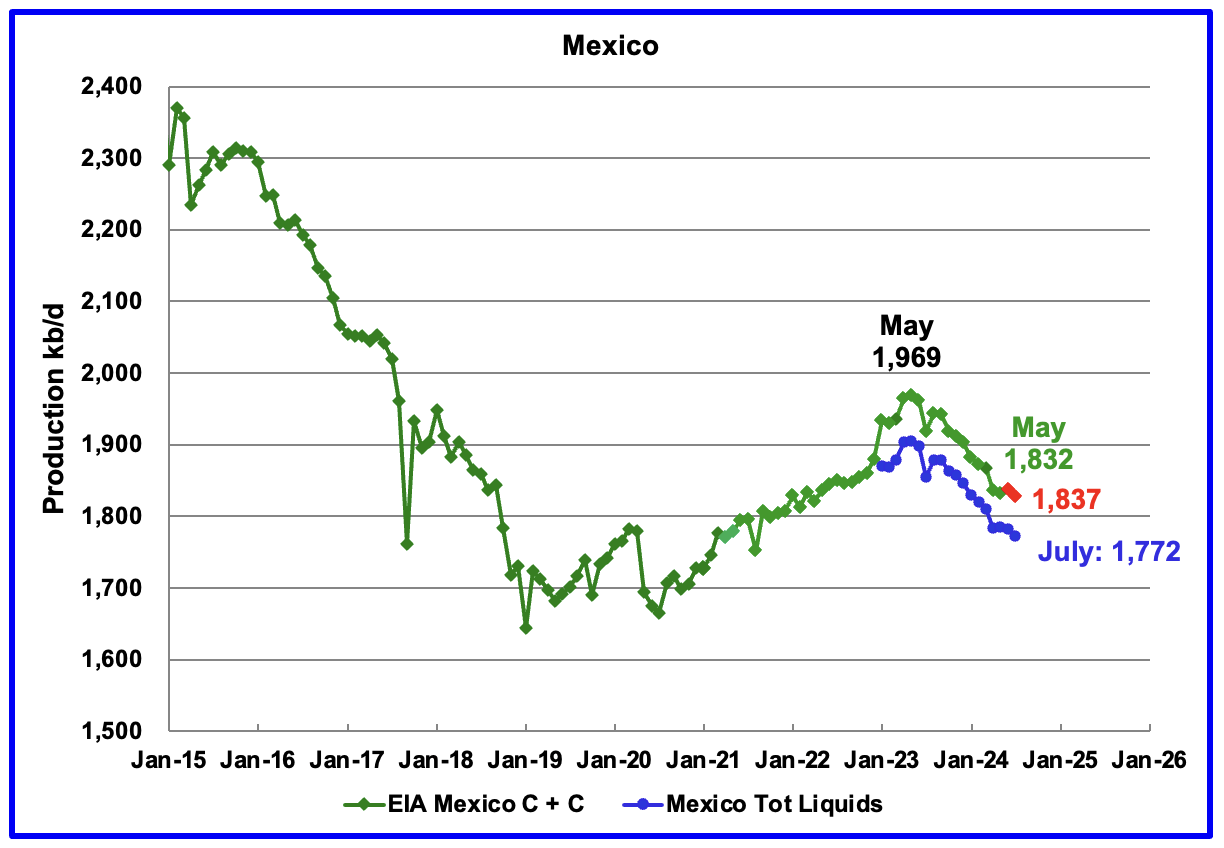
According to the EIA, Mexico’s output decreased by 4 kb/d in May to 1,832 kb/d.
For June, Pemex issued a new and modified oil production report for Heavy, Light and Extra Light oil. It is shown in blue in the chart, and it appears that Mexico is not reporting condensate production when compared to the EIA report.
In earlier reports, the EIA would add close to 55 kb/d to the Pemex report. The gap between the EIA report and Pemex on average has been close to 55 kb/d over the last 6 months. Condensate of 55 kb/d has been added to the Pemex report to estimate Mexico’s June production of C + C 1,837 kb/d, red markers.
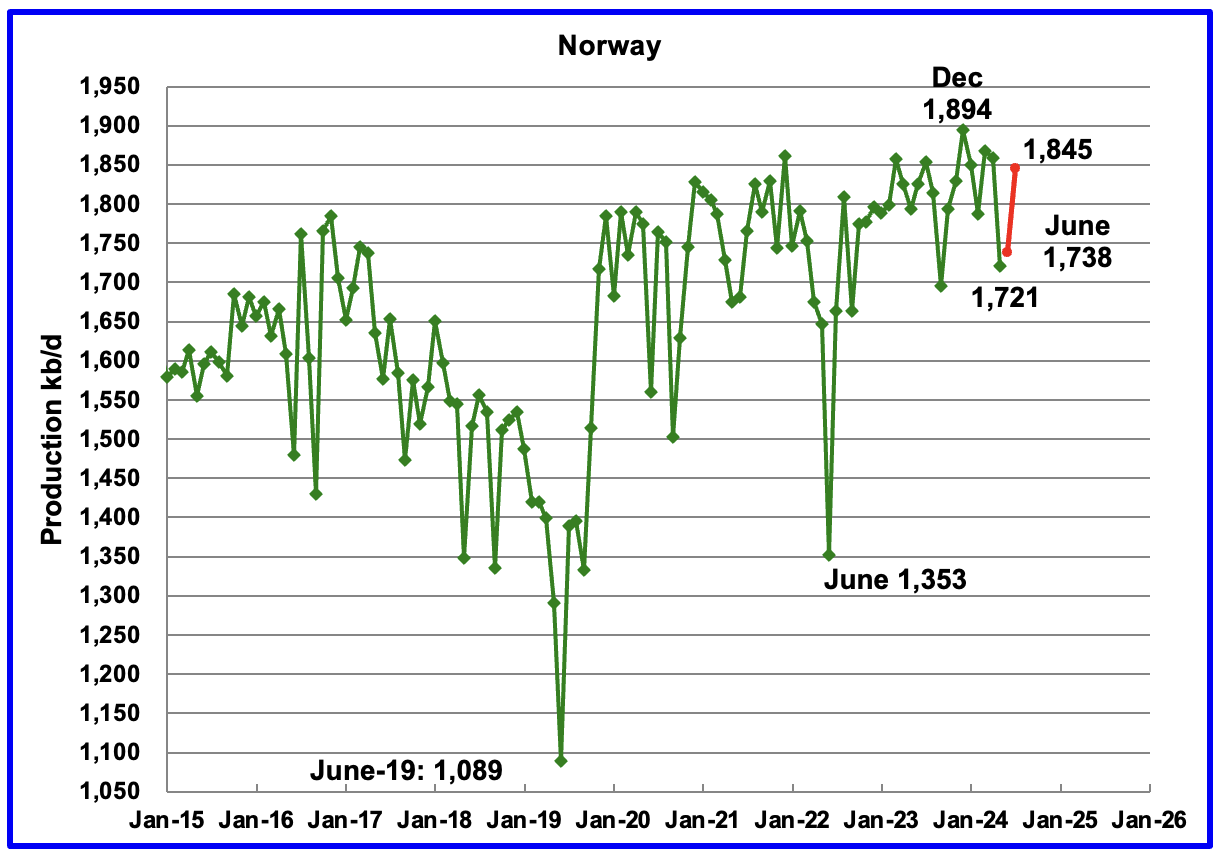
The EIA reported Norway’s May’s production decreased by 129 kb/d to 1,721 kb/d.
Separately, the Norway Petroleum Directorate (NPD) reported that June’s production increased by 17 kb/d to 1,738 kb/d and July added 107 kb/d to 1,845 kb/d, red markers.
The Norway Petroleum Directorship stated that July’s production is 6.0% more than forecast and 2.7% more than the forecast so far this year.
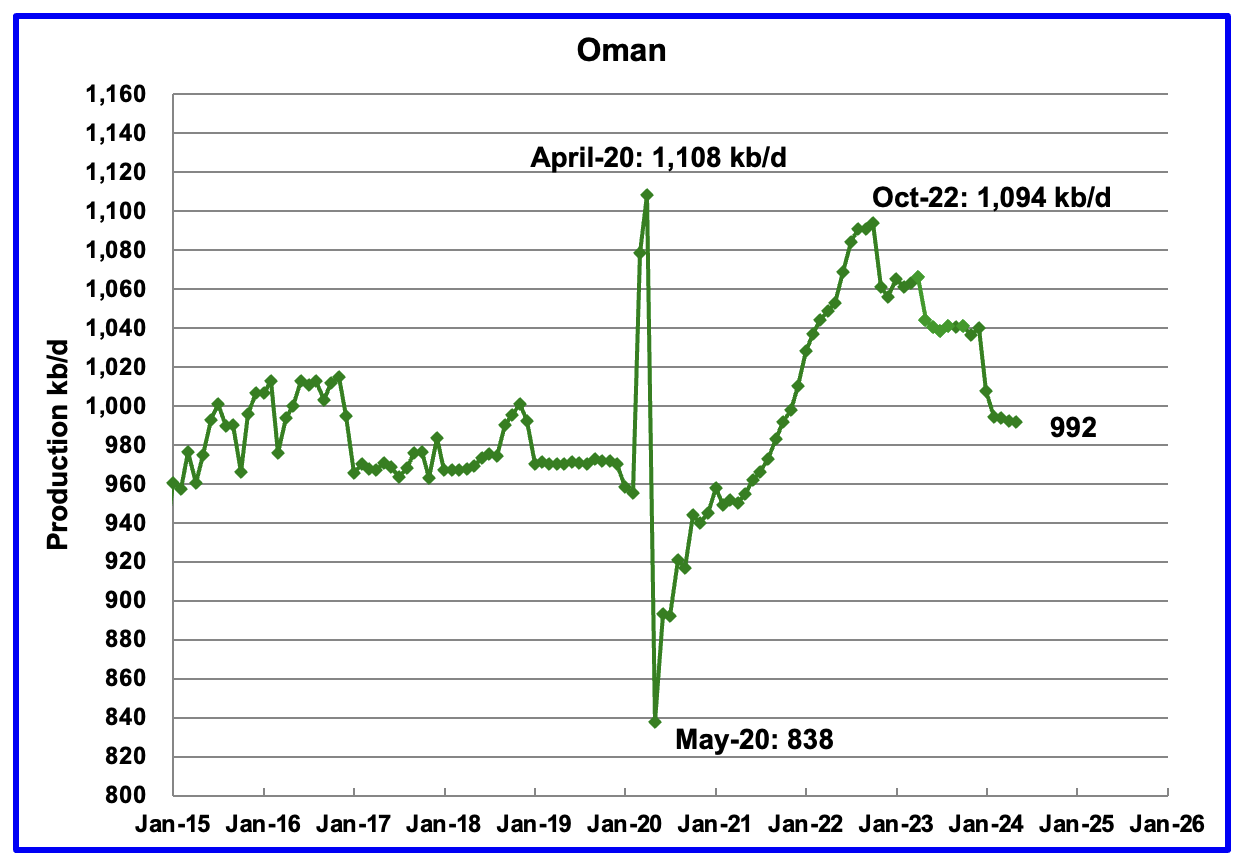
Oman’s production has risen very consistently since the low of May 2020. However, production began to drop in November 2022. According to the EIA, May’s output was unchanged at 992 kb/d.
Oman produces a lot of condensate. The OPEC MOMR reports that crude production in June was 766 kb/d, 226 kb/d lower than the EIA’s C + C.
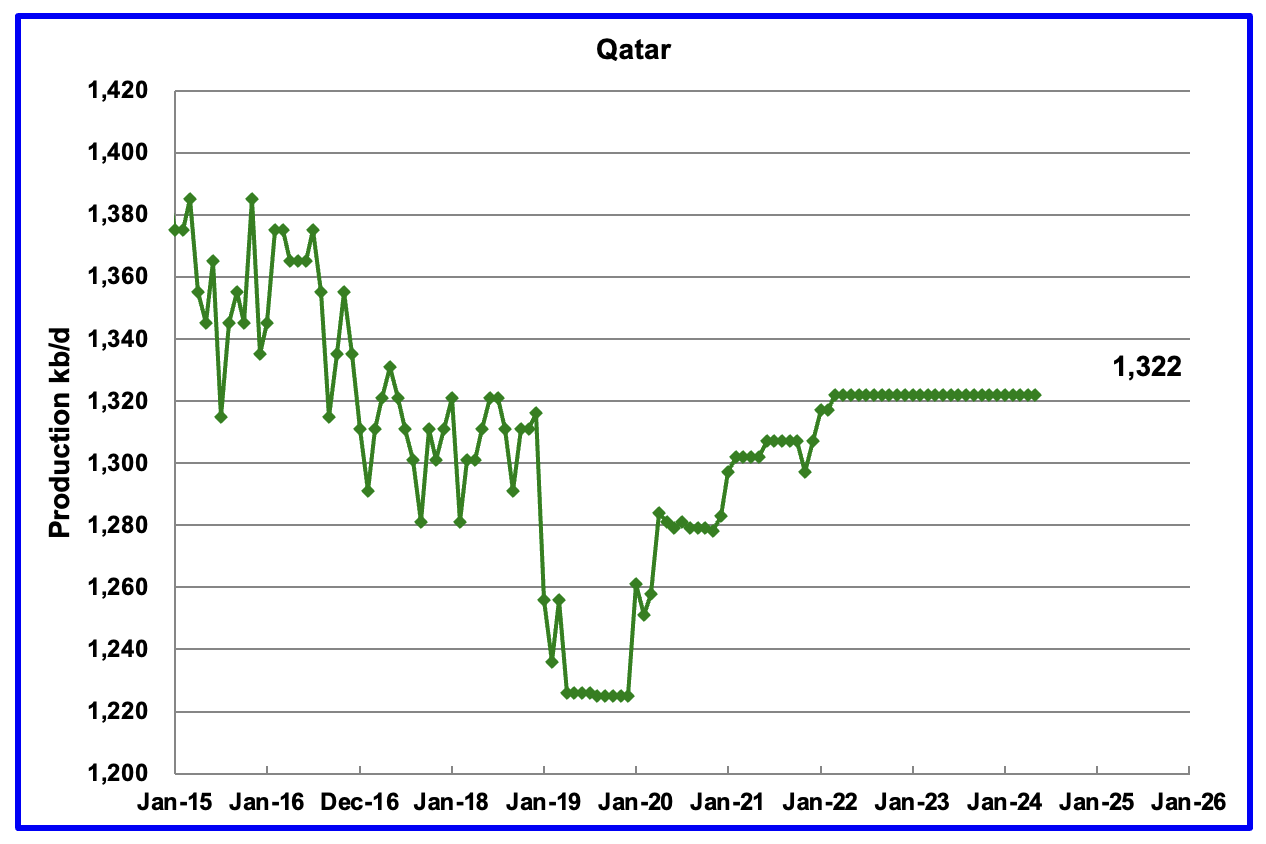
Qatar’s May output was unchanged at 1,322 kb/d, possibly due to lack of updated information.
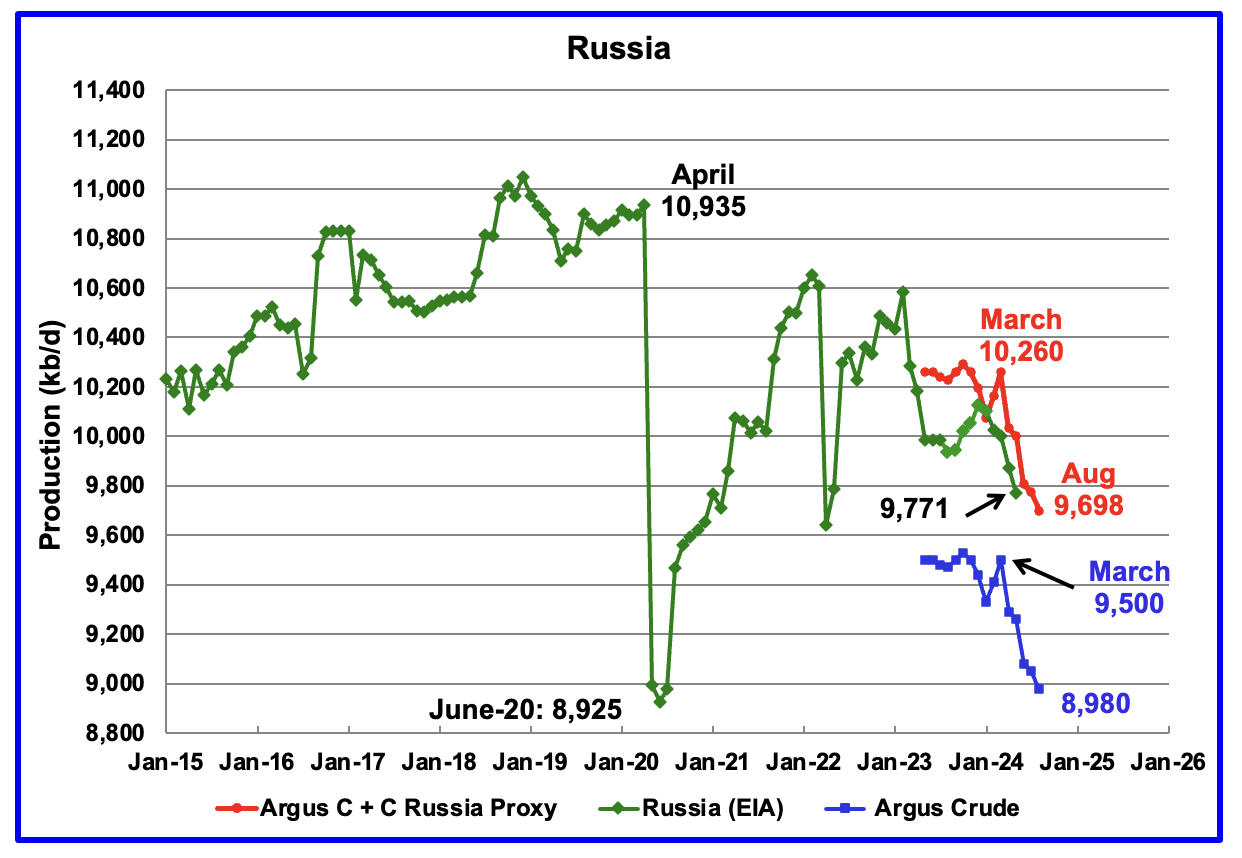
The EIA reported Russia’s May’s C + C production dropped by 100 kb/d to 9,771 kb/d.
Using data from Argus Media reports, Russian crude production is shown from May 2023 to August 2024. For August 2024, Argus reported Russian crude production was 8,980 kb/d, a decrease of 70 kb/d from July, blue markers. Adding 8% to Argus’ August crude production provides a C + C production estimate of 9,698 kb/d for Russia, which is a proxy for the Pre-War Russian Ministry estimate, red markers.
According to Argus, Russian crude production of 8,978 kb/d is essentially in compliance with their OPEC target of 8,980 kb/d.
In pre-war times, the Russia Energy Ministry production estimate used to be 400 kb/d higher than the EIA estimate. For May, the Argus proxy estimate is 230 kb/d higher.
“S&P Platts reports that Russian August crude production was 9,050 kb/d, lower by 50 kb/d from July. Platts’ August production is 70 kb/d higher than reported by the Argus report.
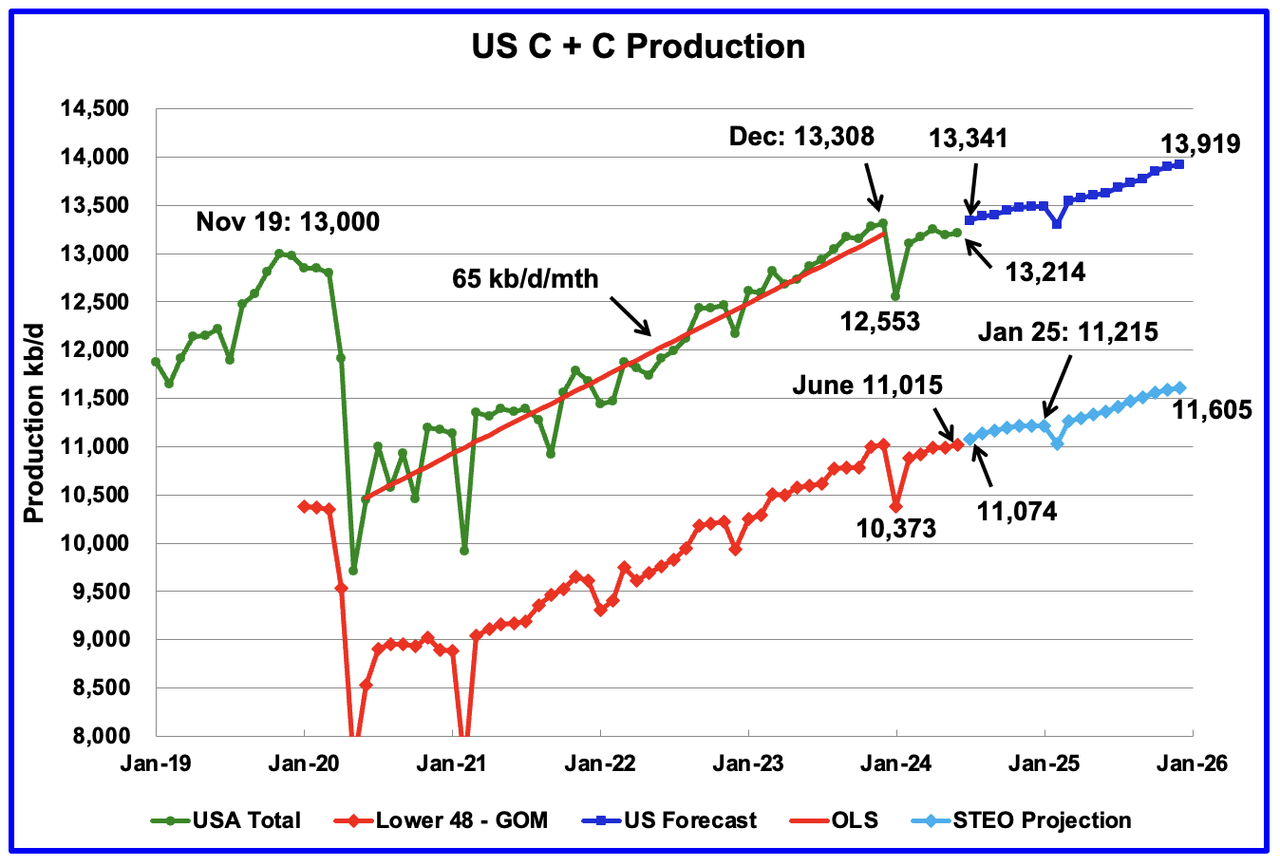
This chart is almost the same as the one posted in the US June update, except that the light and dark blue graphs have been updated with almost negligible changes using the September STEO.
Original Post
Editor’s Note: The summary bullets for this article were chosen by Seeking Alpha editors.
Read the full article here