


Introduction
The Weekly Breakout Forecast continues my doctoral research analysis on MDA breakout selections over more than 8 years. This is a high frequency breakout subset of the different portfolios types I regularly release has now reached 343 weeks of public selections as part of this ongoing live forward-testing research.
Plus, all new long term portfolios for 2024 will be released at the end of December in a Part 2 of this article.
2023 Performance of the MDA Algorithm
For 2023, we had 125 out of 208 selections (60%) gain over 5% and as high as 66.1% in a week, while 65 out of 208 (31%) gained over 10% in their measured week this year.
VMBreakouts.com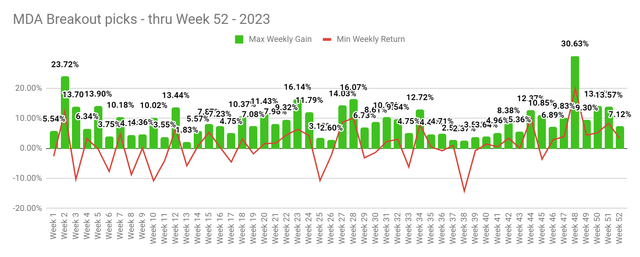
In the new 5 week format to help convey measured returns, I am posting a snap shot of closing values, peak values and the S&P 500 returns. This does not show cumulative or compounded returns and reflects only each week’s returns of the S&P 500 and MDA stocks.
VMBreakouts.com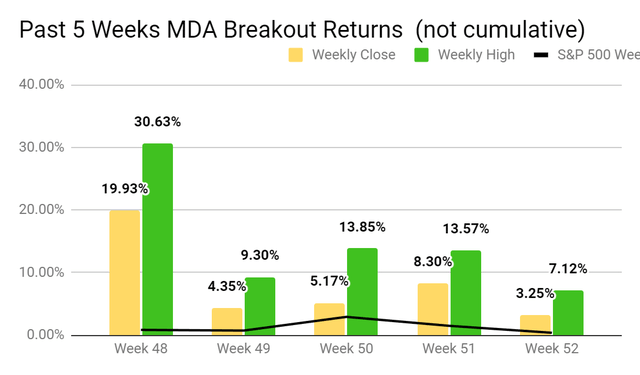
- For the 12th consecutive week at least one pick had peak gains over 10% in less than a week with ALLO +18.47%
- 16 out of 20 picks in the last 5 weeks have gained over 5% in less than a week, 11 out of 20 picks have gained over 10% in less than a week.
- 12 out of 20 picks in the last 5 weeks have had peak gains over 10% in less than a week and as high as 56.1% and 40.9%.
- 5 out of these 20 have now gained over 45% from selection with CLSK +121%, SGHT +91.8%, GCT +53.8%, FDMT +62.3%, IOVA +45.9%
- The count of weekly portfolios with at least one stock gaining over 10% in less than a week increased to 271 out of 343 trading weeks (79.0%).
- Following positive signals of the Momentum Gauges has produced 206.8% avg cumulative returns in the 30 positive signal weeks or +6.95% avg weekly gains this year.
As long term investors know, you can compound $10,000 into $1 million with 10% annual returns in less than 50 years. This model serves to increase the rate of 10% breakouts into 52 weekly intervals instead of years.
VMBreakouts.com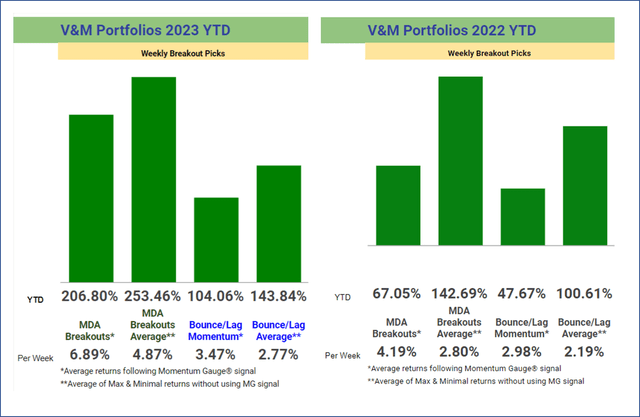
The ongoing competition between the Bounce/Lag Momentum model (from Prof Grant Henning, PhD Statistics) and MDA Breakout picks (from JD Henning, PhD Finance) are shown above with / without using the Momentum Gauge trading signal. The per-week returns equalize the comparison where there were only 16 positive trading weeks last year and 30 positive weeks this year using the MDA trading signal.
Methodology
Using a statistical model of multiple discriminant analysis (MDA) the weekly selections rely on a combination of non-price change related fundamental, technical, and behavioral variables to identify changes in the momentum cycle.
You can view my recent Seeking Alpha webinar on the model and how it works.
app.vmbreakouts.com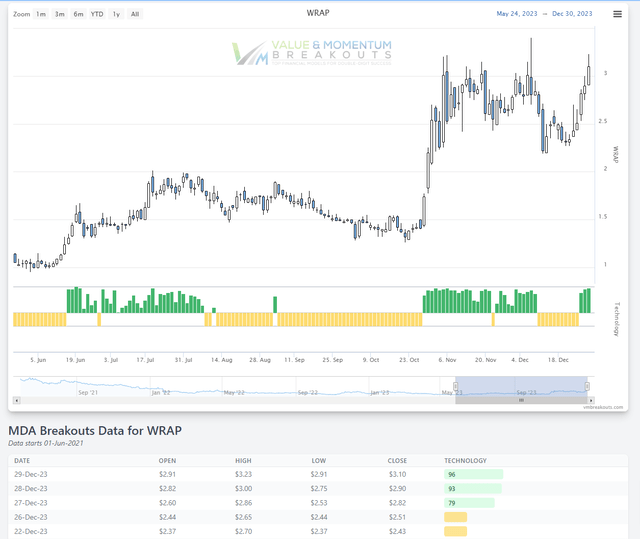
These MDA charts shows the prior breakout signals into Segment 6 positive acceleration (green) for strong gains and how long those conditions lasted. Prior to the development of these visual signals, I used seven years of arbitrary 1-week sample periods to measure if the breakout returns were statistically significant. More resources are available here:
- A Visual Explanation Of The MDA Breakout Research
- Webinar Replay: JD Henning’s Momentum Breakout Models For 2024
The Daily Momentum Gauges
After repeating nearly identical topping patterns over the past year, the momentum gauges continue positive again from nearly the exact lows of October last year and this past February. The current breakout is back near prior peaks with potential for another pullback in the near term. Watch to see when Negative values (orange boxes) start to rise again off these extremely low levels.
app.vmbreakouts.com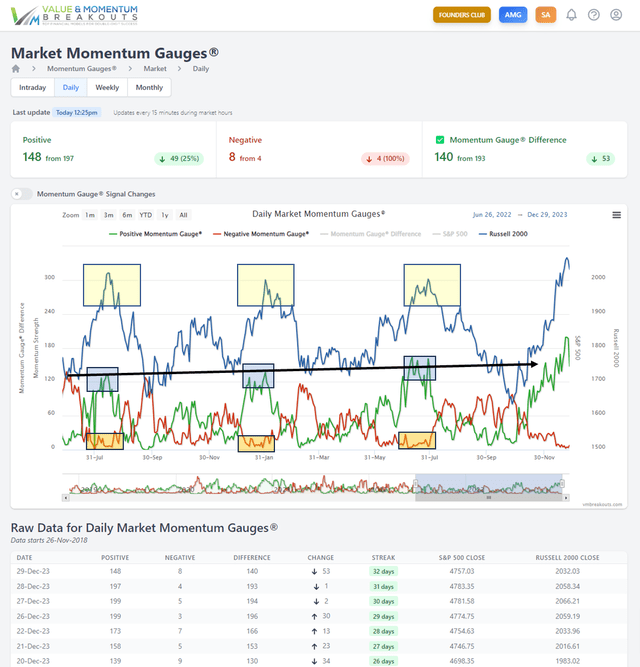
Trading in positive momentum gauge signals greatly enhance returns versus trading against market downturns with large net outflows.
Historical Minimal Performance Measurements
Historical MDA Breakout minimal buy/hold (worst case) returns have a compound average growth rate of 45.7% and cumulative minimum returns of +1,348.2% from 2017. The minimal cumulative returns for 2023 were 90.37%, average cumulative returns were +253.4%, and the best case cumulative returns were +451.0%. The chart reflects only the most conservative measurements adding each 52 minimal weekly return in an annual portfolio simulation — though each weekly selection could be compounded weekly.
vmbreakouts.com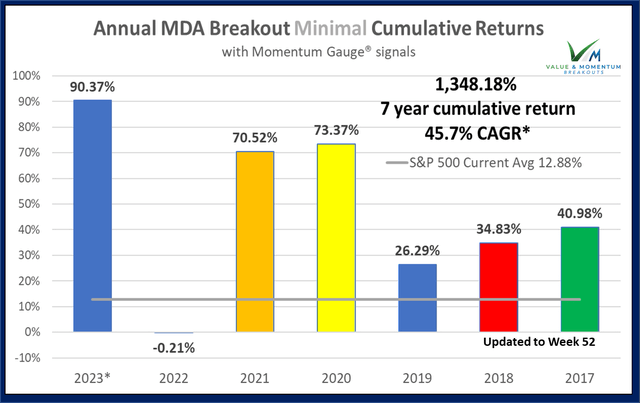
Each year return is a simulation of a portfolio by adding separate weekly portfolio returns together through the year. For research/testing purposes, no stocks are selected in consecutive weeks even if breakout conditions remain strong.
The Week 1 – 2024 Breakout Stocks for next week are:
Four MDA selections are released in advance to members every Friday with current gains of +1.70% for members since release. Prior selections may be doing well, but for research purposes ONLY new selections are used each week. Documented best results occur when buying when the gauges are positive and improving.
- TAL Education (TAL)
- Wrap Technologies (WRAP)
MDA selections are restricted to stocks above $2/share, $100M market cap, and greater than 100k avg daily volume. Penny stocks well below these minimum levels have been shown to benefit greatly from the model but introduce much more risk and may be distorted by inflows from my followers selecting the same micro-cap stocks. I avoid these stocks even though they could greatly enhance the model’s annual returns.
TAL Education Group
FinViz.com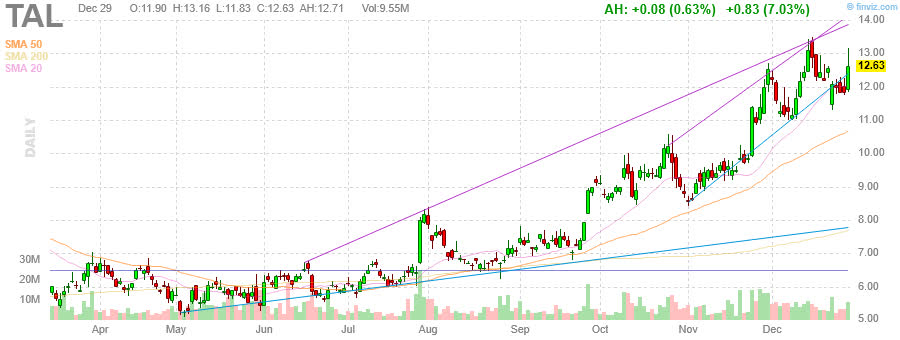
Price Target: $20.0/share (Analyst Consensus + Technical)
(Source: Company Resources)
TAL Education Group is a holding company, which engages in the provision of after-school tutoring programs for primary and secondary school students. The company was founded by Bang Xin Zhang and Yun Dong Cao in August 2003 and is headquartered in Beijing, China.
StockRover.com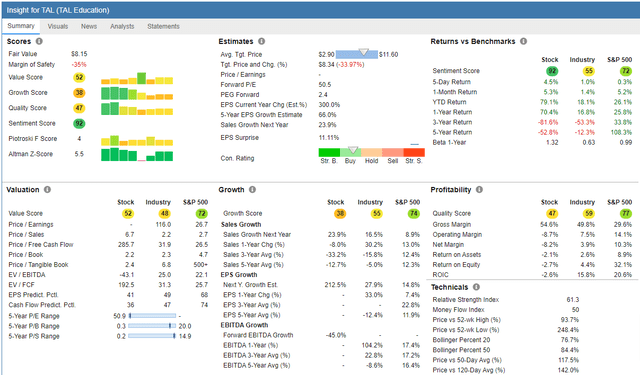
Wrap Technologies
Weekly chart showing potential for multi-year breakout above $3.20/share
FinViz.com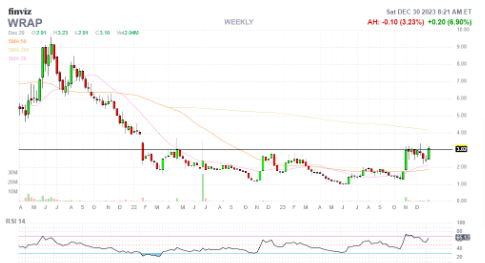
Price Target: $4.0/share (Analyst Consensus + Technical)
(Source: Company Resources)
Wrap Technologies, Inc. is a global public safety technology and service company, which engages in the provision of modern policing solutions to law enforcement and security personnel. Its products include BolaWrap Remote Restraint Device and Wrap Reality.
StockRover.com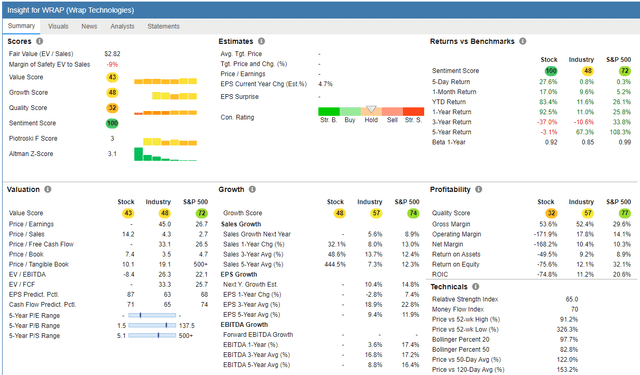
Top Dow 30 Stocks to Watch for Week 1
First, be sure to follow the Momentum Gauges® when applying the same MDA breakout model parameters to only 30 stocks on the Dow Index. Second, these selections are made without regard to market cap or the below-average volatility typical of mega-cap stocks that may produce good results relative to other Dow 30 stocks. Third, the 30 Dow stocks had been the worst performing major index only turning positive into November of 2023.
twitter.com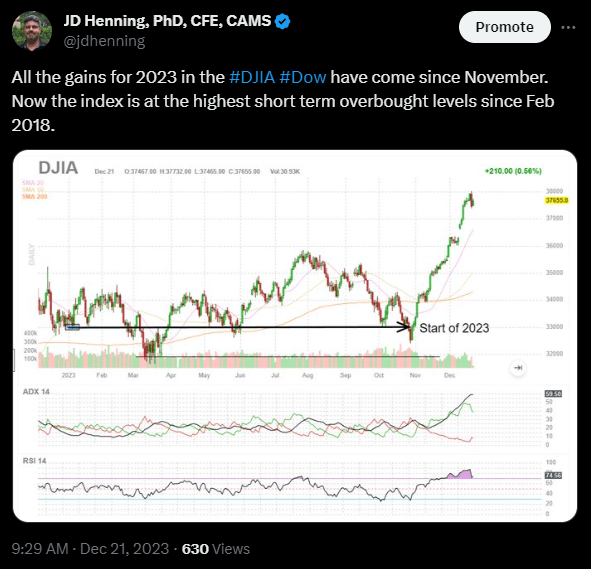
The last 5 weeks of Dow picks
| Week Picked | Symbol | Company | Friday % | Return % | Current Price |
| Week 52 | CVX | Chevron Corporation | -0.41% | -1.78% | 149.16 |
| Week 52 | MRK | Merck & Co Inc | 0.23% | 1.79% | 109.02 |
| Week 51 | INTC | Intel Corporation | -0.28% | 8.41% | 50.25 |
| Week 51 | CSCO | Cisco Systems Inc | 0.08% | 1.85% | 50.52 |
| Week 50 | CAT | Caterpillar Inc. | -0.41% | 14.79% | 295.67 |
| Week 50 | MMM | 3M Co | -0.34% | 5.76% | 109.32 |
| Week 49 | JNJ | Johnson & Johnson | 0.10% | 0.42% | 156.74 |
| Week 49 | MRK | Merck & Co Inc | 0.23% | 5.25% | 109.02 |
| Week 48 | HON | Honeywell International | 0.26% | 8.47% | 209.71 |
| Week 48 | UNH | UnitedHealth Group Inc | 0.28% | -3.64% | 526.47 |
The Dow pick for next week is:
Merck (MRK)
Merck continues in breakout conditions again this week after months of declines in the long negative channel. Money flows have increased sharply following Q3 earnings beat. The current breakout above $106/share is clearing several months of resistance with potential for strong gains into 2024 also with a solid dividend of 2.50%.
FinViz.com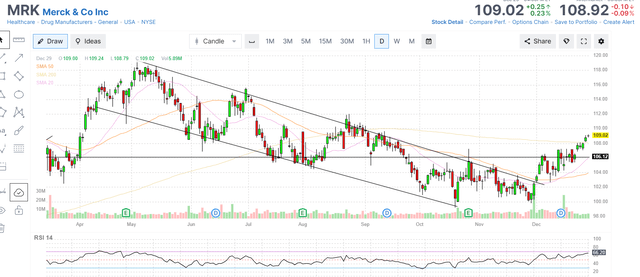
If you are looking for a much broader selection of large cap breakout stocks, I recommend these long term portfolios. More details on the value stocks and ETF trading models that go out in separate articles.
VMBreakouts.com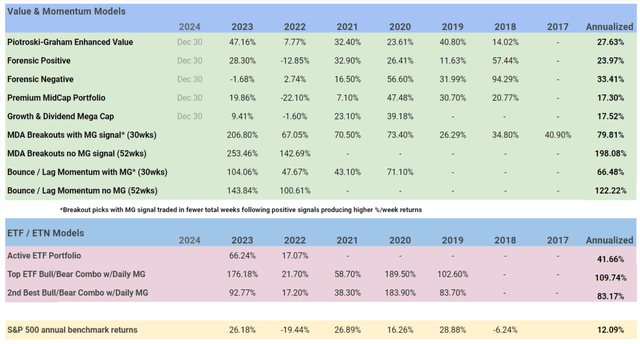
All new picks out the end of December! Wish you the very best in the New Year!
JD Henning, PhD, MBA, CFE, CAMS
Read the full article here